Zip Codes with the Highest Percentage of Population Employed in Agriculture, Fishing & Hunting in Georgetown, TX
RELATED REPORTS & OPTIONS
Agriculture, Fishing & Hunting
Georgetown
Compare Zip Codes
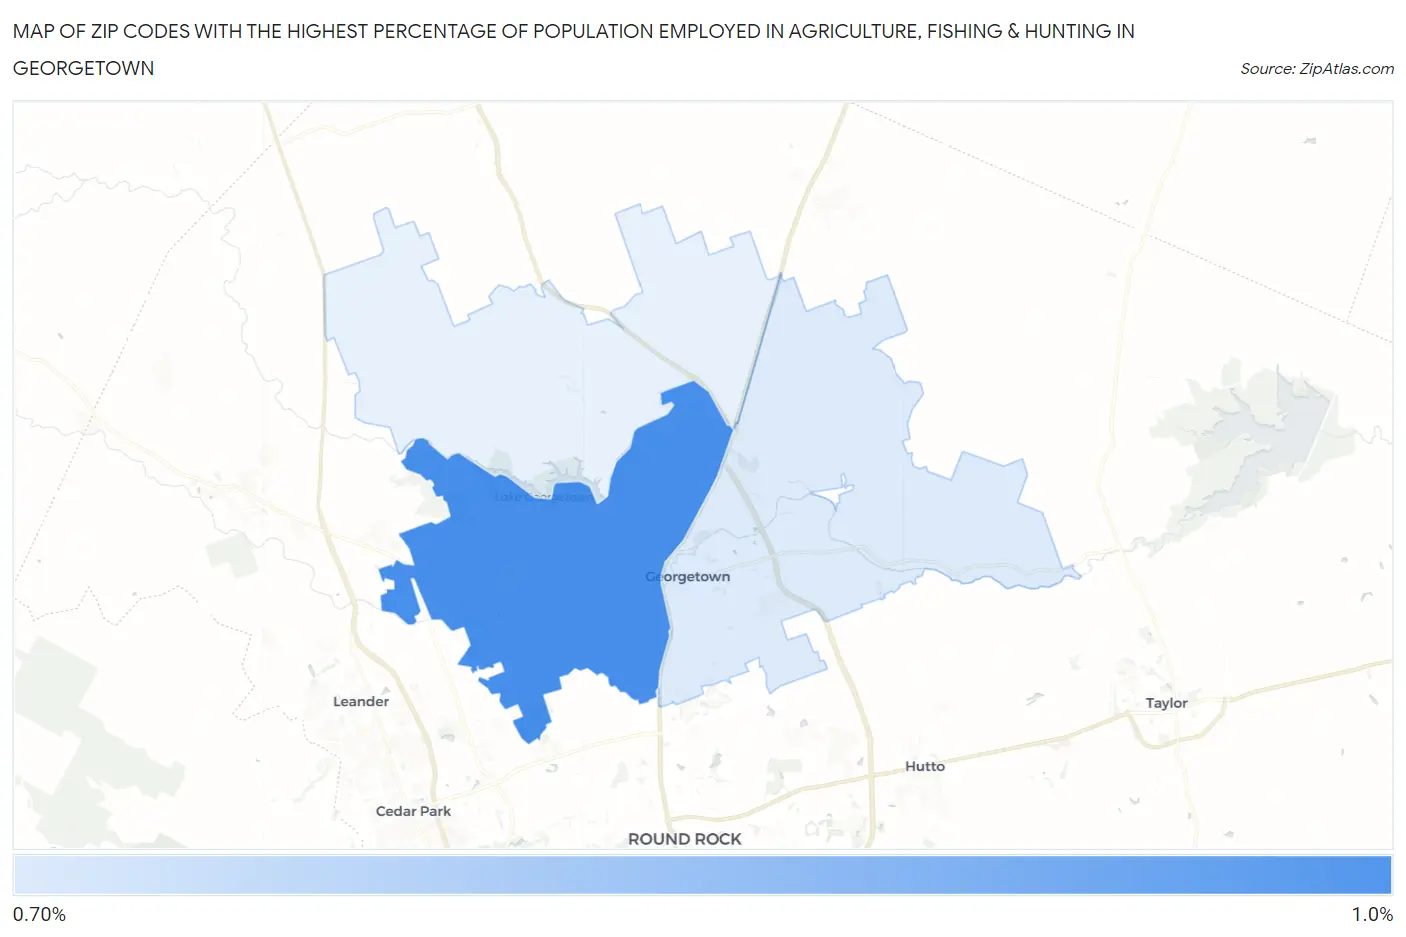
Map of Zip Codes with the Highest Percentage of Population Employed in Agriculture, Fishing & Hunting in Georgetown
0.77%
0.82%
Zip Codes with the Highest Percentage of Population Employed in Agriculture, Fishing & Hunting in Georgetown, TX
| Zip Code | % Employed | vs State | vs National | |
| 1. | 78628 | 0.82% | 0.75%(+0.067)#909 | 1.2%(-0.380)#17,144 |
| 2. | 78626 | 0.77% | 0.75%(+0.018)#928 | 1.2%(-0.430)#17,422 |
1
Common Questions
What are the Top Zip Codes with the Highest Percentage of Population Employed in Agriculture, Fishing & Hunting in Georgetown, TX?
Top Zip Codes with the Highest Percentage of Population Employed in Agriculture, Fishing & Hunting in Georgetown, TX are:
What zip code has the Highest Percentage of Population Employed in Agriculture, Fishing & Hunting in Georgetown, TX?
78628 has the Highest Percentage of Population Employed in Agriculture, Fishing & Hunting in Georgetown, TX with 0.82%.
What is the Percentage of Population Employed in Agriculture, Fishing & Hunting in Georgetown, TX?
Percentage of Population Employed in Agriculture, Fishing & Hunting in Georgetown is 0.88%.
What is the Percentage of Population Employed in Agriculture, Fishing & Hunting in Texas?
Percentage of Population Employed in Agriculture, Fishing & Hunting in Texas is 0.75%.
What is the Percentage of Population Employed in Agriculture, Fishing & Hunting in the United States?
Percentage of Population Employed in Agriculture, Fishing & Hunting in the United States is 1.2%.