Misquamicut, RI Map & Demographics
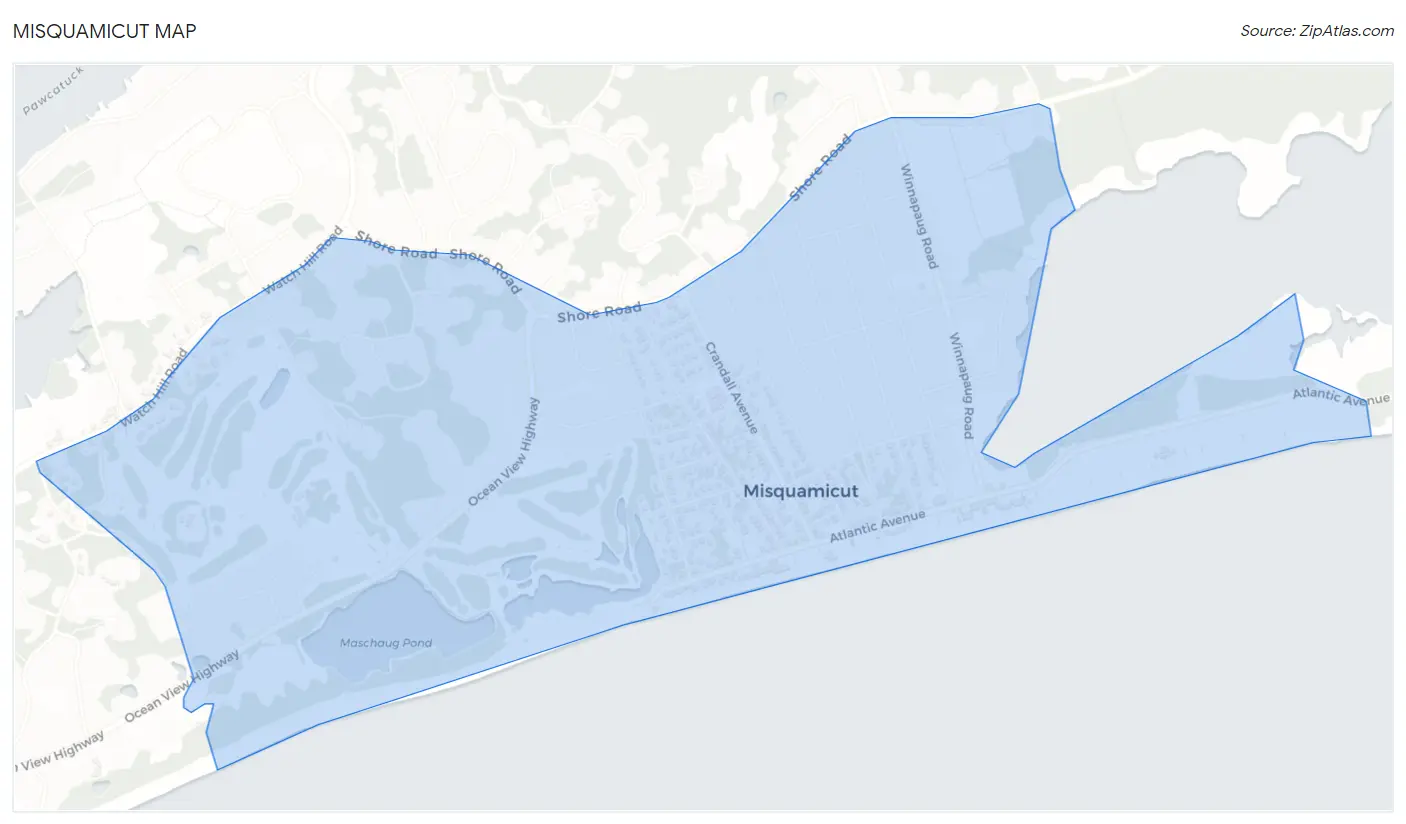
Misquamicut Map
Misquamicut Overview
$109,352
PER CAPITA INCOME
$113,438
AVG HOUSEHOLD INCOME
0.56
INEQUALITY / GINI INDEX
379
TOTAL POPULATION
196
MALE POPULATION
183
FEMALE POPULATION
107.10
MALES / 100 FEMALES
93.37
FEMALES / 100 MALES
65.0
MEDIAN AGE
2.2
AVG FAMILY SIZE
1.8
AVG HOUSEHOLD SIZE
140
LABOR FORCE [ PEOPLE ]
38.9%
PERCENT IN LABOR FORCE
Income in Misquamicut
Income Overview in Misquamicut
| Characteristic | Number | Measure |
| Per Capita Income | 379 | $109,352 |
| Median Family Income | 118 | $0 |
| Mean Family Income | 118 | $245,854 |
| Median Household Income | 217 | $113,438 |
| Mean Household Income | 217 | $187,481 |
| Income Deficit | 118 | $0 |
| Wage / Income Gap (%) | 379 | 0.00% |
| Wage / Income Gap ($) | 379 | 100.00¢ per $1 |
| Gini / Inequality Index | 379 | 0.56 |
Earnings by Sex in Misquamicut
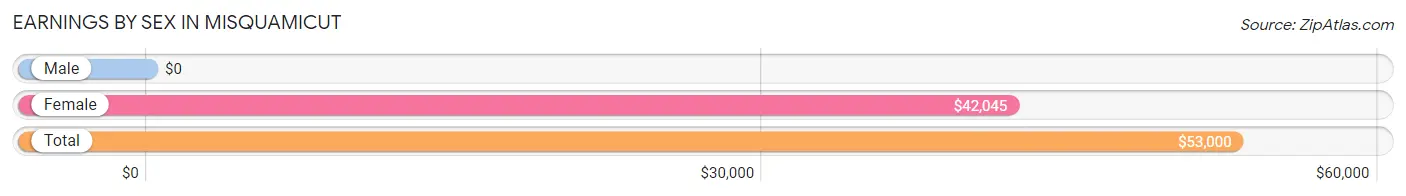
| Sex | Number | Average Earnings |
| Male | 72 (51.4%) | $0 |
| Female | 68 (48.6%) | $42,045 |
| Total | 140 (100.0%) | $53,000 |
Earnings by Sex by Income Bracket in Misquamicut
The most common earnings brackets in Misquamicut are $100,000+ for men (31 | 43.1%) and $75,000 to $99,999 for women (15 | 22.1%).
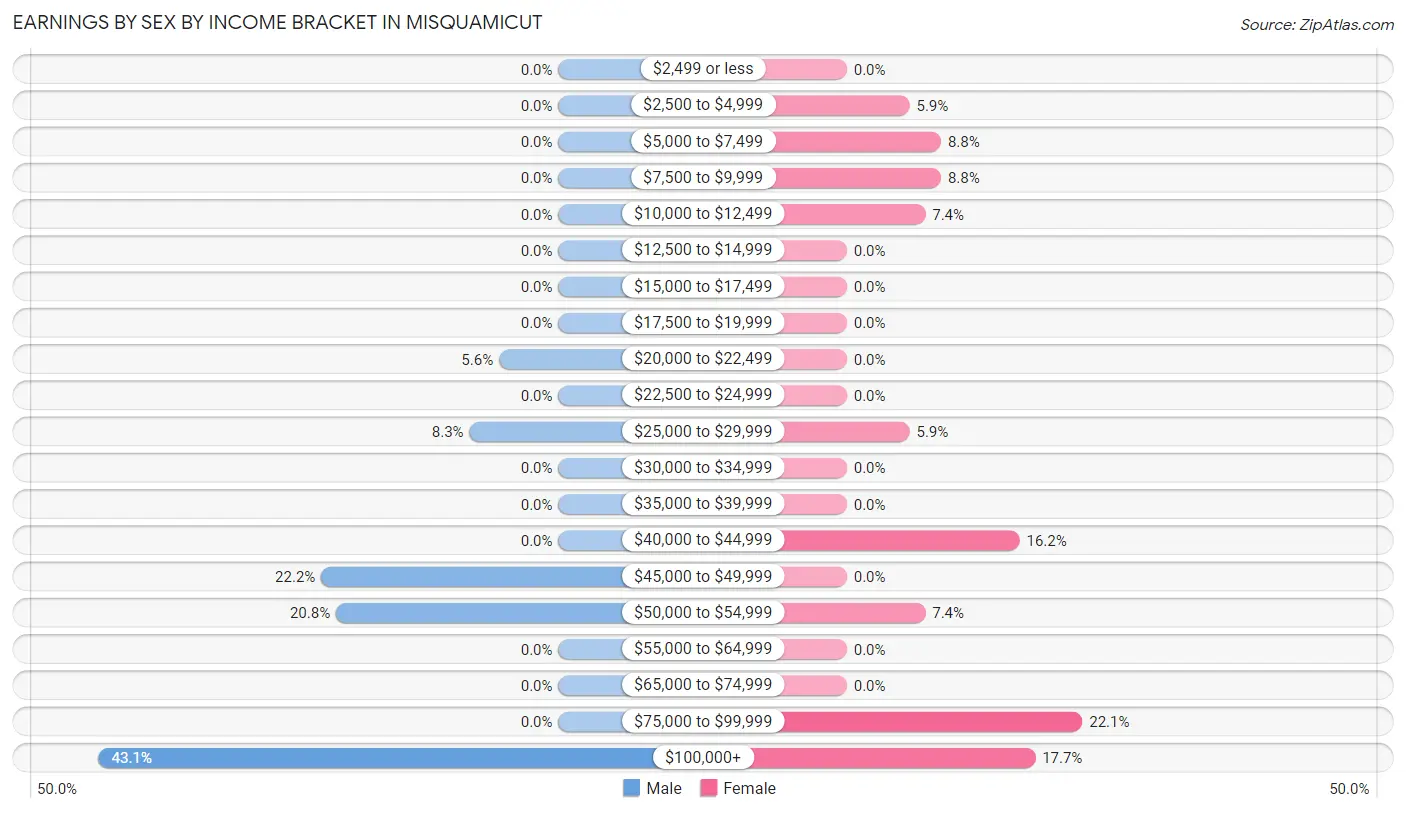
| Income | Male | Female |
| $2,499 or less | 0 (0.0%) | 0 (0.0%) |
| $2,500 to $4,999 | 0 (0.0%) | 4 (5.9%) |
| $5,000 to $7,499 | 0 (0.0%) | 6 (8.8%) |
| $7,500 to $9,999 | 0 (0.0%) | 6 (8.8%) |
| $10,000 to $12,499 | 0 (0.0%) | 5 (7.3%) |
| $12,500 to $14,999 | 0 (0.0%) | 0 (0.0%) |
| $15,000 to $17,499 | 0 (0.0%) | 0 (0.0%) |
| $17,500 to $19,999 | 0 (0.0%) | 0 (0.0%) |
| $20,000 to $22,499 | 4 (5.6%) | 0 (0.0%) |
| $22,500 to $24,999 | 0 (0.0%) | 0 (0.0%) |
| $25,000 to $29,999 | 6 (8.3%) | 4 (5.9%) |
| $30,000 to $34,999 | 0 (0.0%) | 0 (0.0%) |
| $35,000 to $39,999 | 0 (0.0%) | 0 (0.0%) |
| $40,000 to $44,999 | 0 (0.0%) | 11 (16.2%) |
| $45,000 to $49,999 | 16 (22.2%) | 0 (0.0%) |
| $50,000 to $54,999 | 15 (20.8%) | 5 (7.3%) |
| $55,000 to $64,999 | 0 (0.0%) | 0 (0.0%) |
| $65,000 to $74,999 | 0 (0.0%) | 0 (0.0%) |
| $75,000 to $99,999 | 0 (0.0%) | 15 (22.1%) |
| $100,000+ | 31 (43.1%) | 12 (17.6%) |
| Total | 72 (100.0%) | 68 (100.0%) |
Earnings by Sex by Educational Attainment in Misquamicut
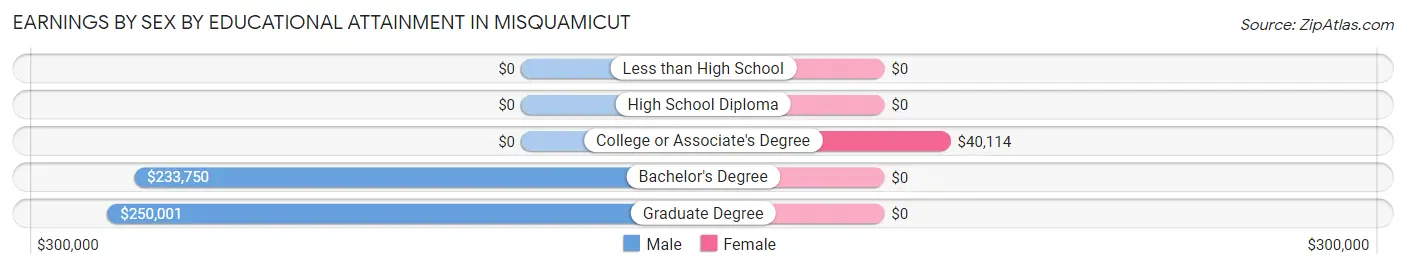
| Educational Attainment | Male Income | Female Income |
| Less than High School | - | - |
| High School Diploma | - | - |
| College or Associate's Degree | - | - |
| Bachelor's Degree | $233,750 | $0 |
| Graduate Degree | $250,001 | $0 |
| Total | - | - |
Family Income in Misquamicut
Family Income Brackets in Misquamicut
According to the Misquamicut family income data, there are 52 families falling into the $200,000+ income range, which is the most common income bracket and makes up 44.1% of all families.
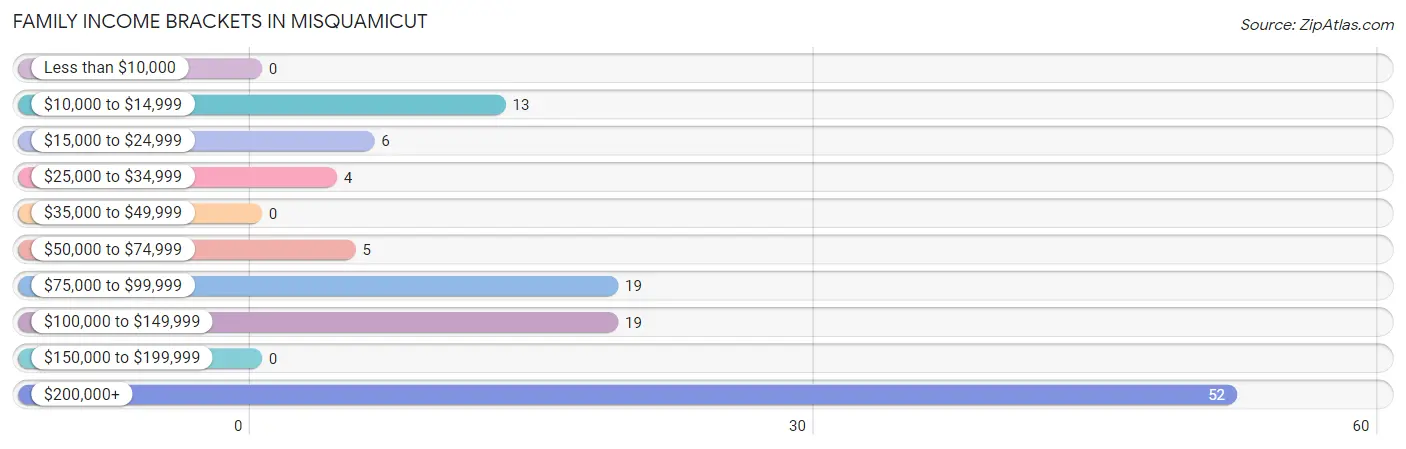
| Income Bracket | # Families | % Families |
| Less than $10,000 | 0 | 0.0% |
| $10,000 to $14,999 | 13 | 11.0% |
| $15,000 to $24,999 | 6 | 5.1% |
| $25,000 to $34,999 | 4 | 3.4% |
| $35,000 to $49,999 | 0 | 0.0% |
| $50,000 to $74,999 | 5 | 4.2% |
| $75,000 to $99,999 | 19 | 16.1% |
| $100,000 to $149,999 | 19 | 16.1% |
| $150,000 to $199,999 | 0 | 0.0% |
| $200,000+ | 52 | 44.1% |
Family Income by Famaliy Size in Misquamicut
3-person families (25 | 21.2%) account for the highest median family income in Misquamicut with $250,001 per family, while 3-person families (25 | 21.2%) have the highest median income of $83,334 per family member.
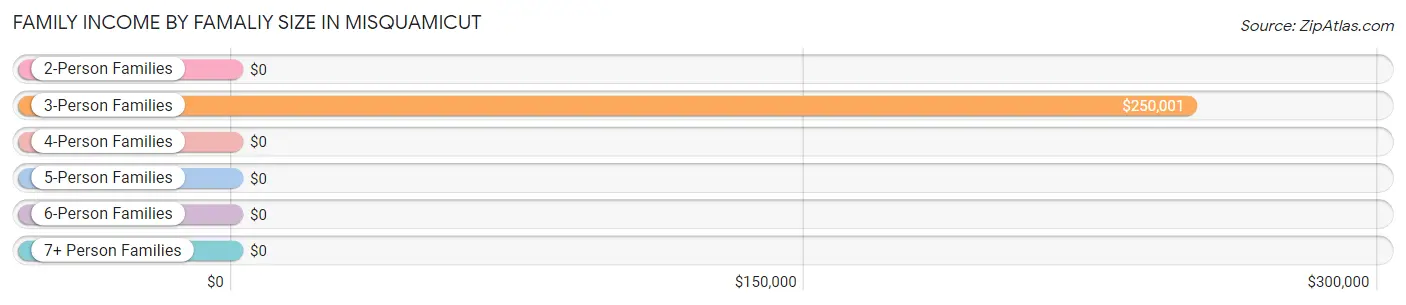
| Income Bracket | # Families | Median Income |
| 2-Person Families | 93 (78.8%) | $0 |
| 3-Person Families | 25 (21.2%) | $250,001 |
| 4-Person Families | 0 (0.0%) | $0 |
| 5-Person Families | 0 (0.0%) | $0 |
| 6-Person Families | 0 (0.0%) | $0 |
| 7+ Person Families | 0 (0.0%) | $0 |
| Total | 118 (100.0%) | $0 |
Family Income by Number of Earners in Misquamicut
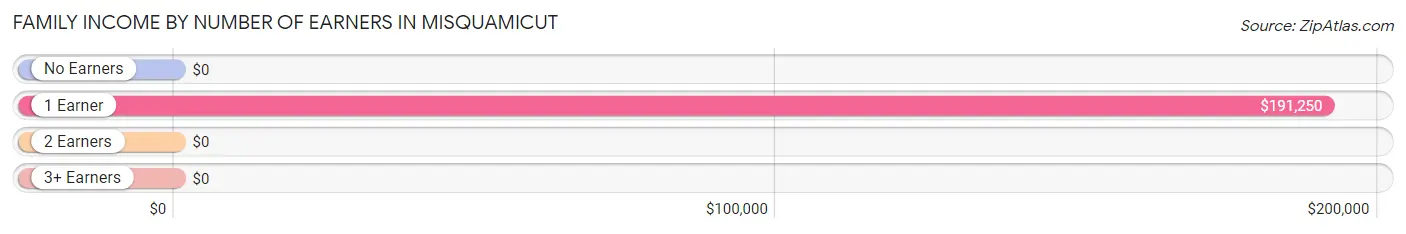
| Number of Earners | # Families | Median Income |
| No Earners | 53 (44.9%) | $0 |
| 1 Earner | 42 (35.6%) | $191,250 |
| 2 Earners | 18 (15.2%) | $0 |
| 3+ Earners | 5 (4.2%) | $0 |
| Total | 118 (100.0%) | $0 |
Household Income in Misquamicut
Household Income Brackets in Misquamicut
With 69 households falling in the category, the $200,000+ income range is the most frequent in Misquamicut, accounting for 31.8% of all households. In contrast, only 6 households (2.8%) fall into the $15,000 to $24,999 income bracket, making it the least populous group.
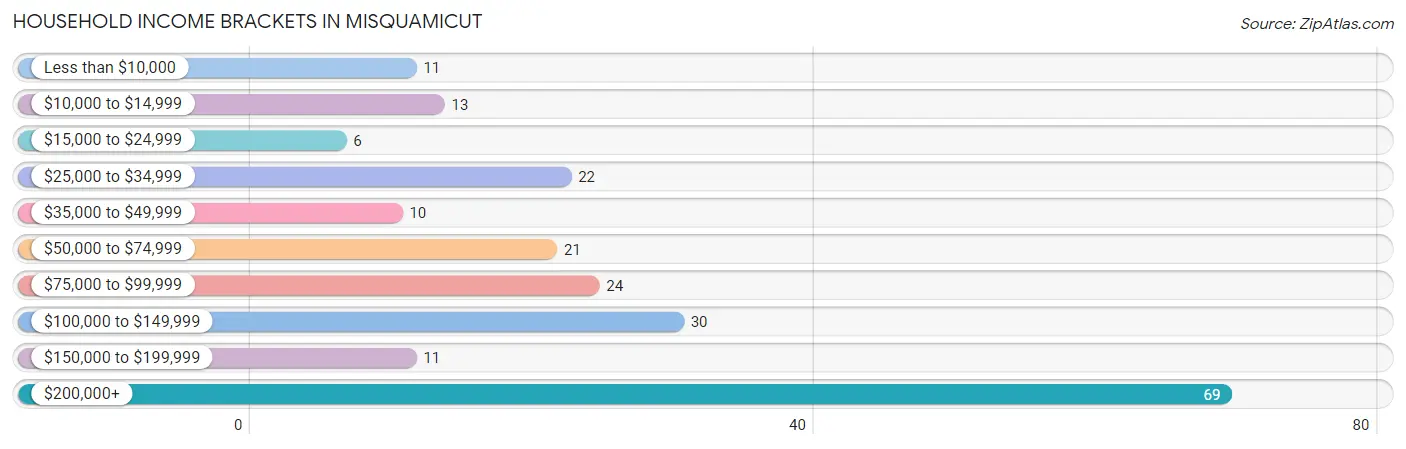
| Income Bracket | # Households | % Households |
| Less than $10,000 | 11 | 5.1% |
| $10,000 to $14,999 | 13 | 6.0% |
| $15,000 to $24,999 | 6 | 2.8% |
| $25,000 to $34,999 | 22 | 10.1% |
| $35,000 to $49,999 | 10 | 4.6% |
| $50,000 to $74,999 | 21 | 9.7% |
| $75,000 to $99,999 | 24 | 11.1% |
| $100,000 to $149,999 | 30 | 13.8% |
| $150,000 to $199,999 | 11 | 5.1% |
| $200,000+ | 69 | 31.8% |
Household Income by Householder Age in Misquamicut
The median household income in Misquamicut is $113,438, with the highest median household income of $101,250 found in the 65+ years age bracket for the primary householder. A total of 138 households (63.6%) fall into this category.
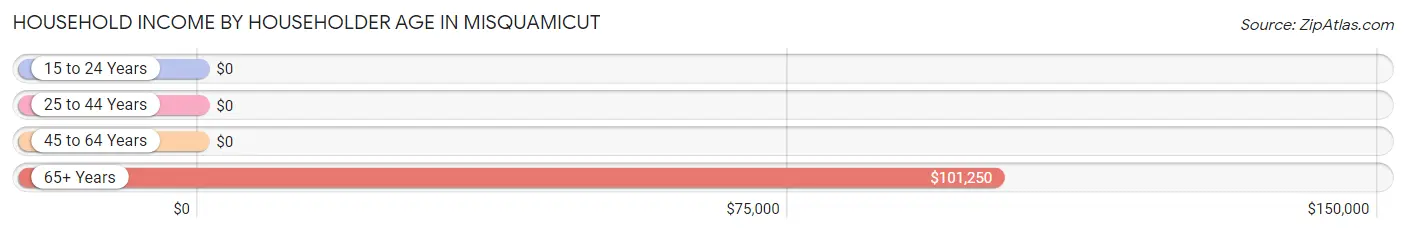
| Income Bracket | # Households | Median Income |
| 15 to 24 Years | 0 (0.0%) | $0 |
| 25 to 44 Years | 9 (4.2%) | $0 |
| 45 to 64 Years | 70 (32.3%) | $0 |
| 65+ Years | 138 (63.6%) | $101,250 |
| Total | 217 (100.0%) | $113,438 |
Poverty in Misquamicut
Income Below Poverty by Sex and Age in Misquamicut
With 10.2% poverty level for males and 3.3% for females among the residents of Misquamicut, 12 to 14 year old males and 55 to 64 year old females are the most vulnerable to poverty, with 2 males (100.0%) and 6 females (10.0%) in their respective age groups living below the poverty level.
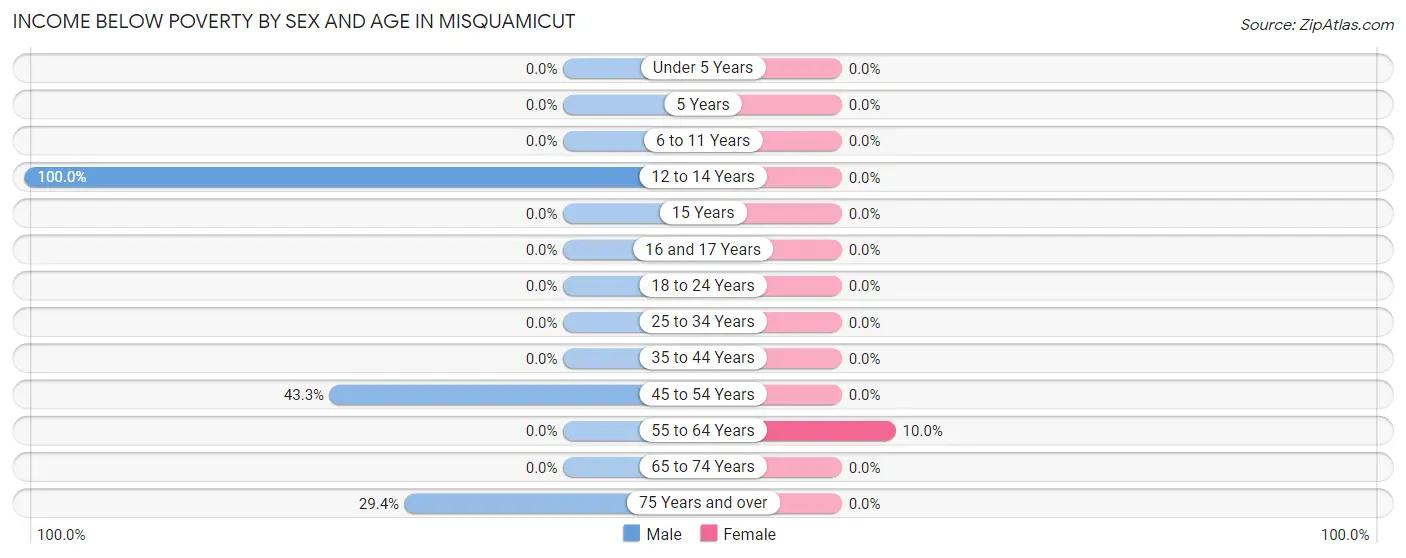
| Age Bracket | Male | Female |
| Under 5 Years | 0 (0.0%) | 0 (0.0%) |
| 5 Years | 0 (0.0%) | 0 (0.0%) |
| 6 to 11 Years | 0 (0.0%) | 0 (0.0%) |
| 12 to 14 Years | 2 (100.0%) | 0 (0.0%) |
| 15 Years | 0 (0.0%) | 0 (0.0%) |
| 16 and 17 Years | 0 (0.0%) | 0 (0.0%) |
| 18 to 24 Years | 0 (0.0%) | 0 (0.0%) |
| 25 to 34 Years | 0 (0.0%) | 0 (0.0%) |
| 35 to 44 Years | 0 (0.0%) | 0 (0.0%) |
| 45 to 54 Years | 13 (43.3%) | 0 (0.0%) |
| 55 to 64 Years | 0 (0.0%) | 6 (10.0%) |
| 65 to 74 Years | 0 (0.0%) | 0 (0.0%) |
| 75 Years and over | 5 (29.4%) | 0 (0.0%) |
| Total | 20 (10.2%) | 6 (3.3%) |
Income Above Poverty by Sex and Age in Misquamicut
According to the poverty statistics in Misquamicut, males aged 18 to 24 years and females aged 6 to 11 years are the age groups that are most secure financially, with 100.0% of males and 100.0% of females in these age groups living above the poverty line.
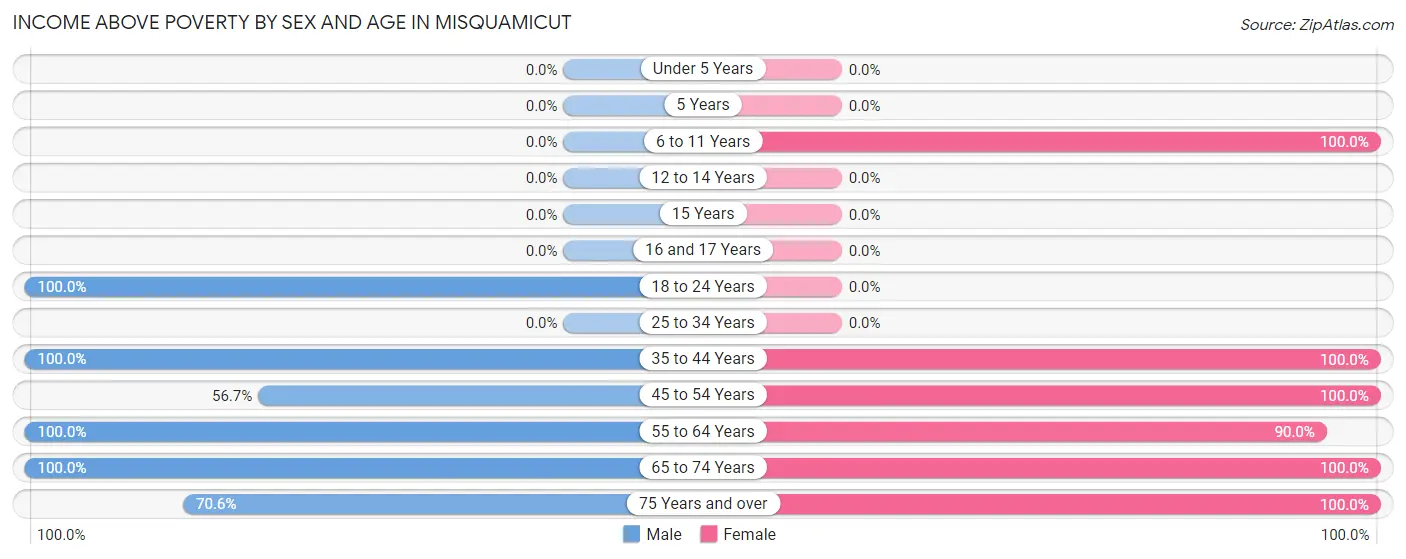
| Age Bracket | Male | Female |
| Under 5 Years | 0 (0.0%) | 0 (0.0%) |
| 5 Years | 0 (0.0%) | 0 (0.0%) |
| 6 to 11 Years | 0 (0.0%) | 17 (100.0%) |
| 12 to 14 Years | 0 (0.0%) | 0 (0.0%) |
| 15 Years | 0 (0.0%) | 0 (0.0%) |
| 16 and 17 Years | 0 (0.0%) | 0 (0.0%) |
| 18 to 24 Years | 7 (100.0%) | 0 (0.0%) |
| 25 to 34 Years | 0 (0.0%) | 0 (0.0%) |
| 35 to 44 Years | 9 (100.0%) | 9 (100.0%) |
| 45 to 54 Years | 17 (56.7%) | 15 (100.0%) |
| 55 to 64 Years | 40 (100.0%) | 54 (90.0%) |
| 65 to 74 Years | 91 (100.0%) | 58 (100.0%) |
| 75 Years and over | 12 (70.6%) | 24 (100.0%) |
| Total | 176 (89.8%) | 177 (96.7%) |
Income Below Poverty Among Married-Couple Families in Misquamicut
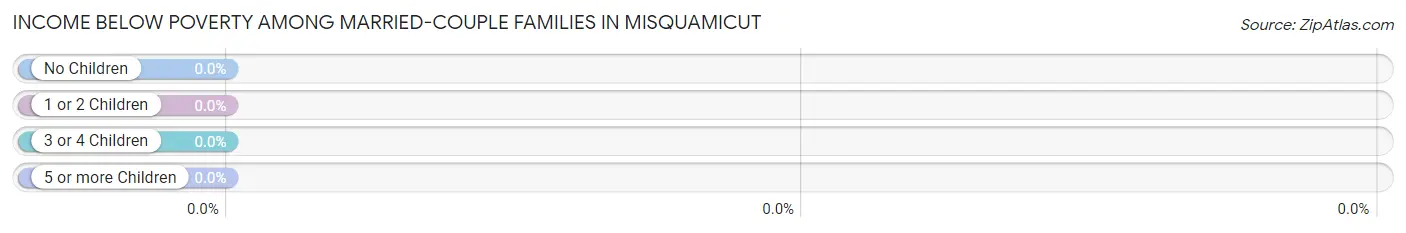
| Children | Above Poverty | Below Poverty |
| No Children | 85 (100.0%) | 0 (0.0%) |
| 1 or 2 Children | 20 (100.0%) | 0 (0.0%) |
| 3 or 4 Children | 0 (0.0%) | 0 (0.0%) |
| 5 or more Children | 0 (0.0%) | 0 (0.0%) |
| Total | 105 (100.0%) | 0 (0.0%) |
Income Below Poverty Among Single-Parent Households in Misquamicut
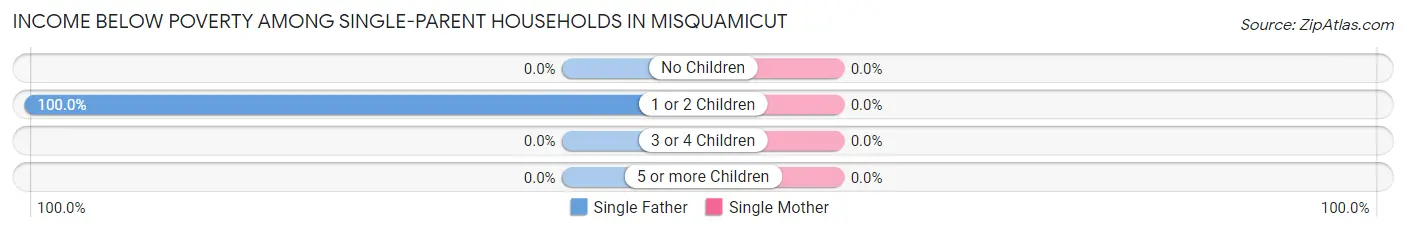
| Children | Single Father | Single Mother |
| No Children | 0 (0.0%) | 0 (0.0%) |
| 1 or 2 Children | 13 (100.0%) | 0 (0.0%) |
| 3 or 4 Children | 0 (0.0%) | 0 (0.0%) |
| 5 or more Children | 0 (0.0%) | 0 (0.0%) |
| Total | 13 (100.0%) | 0 (0.0%) |
Income Below Poverty Among Married-Couple vs Single-Parent Households in Misquamicut
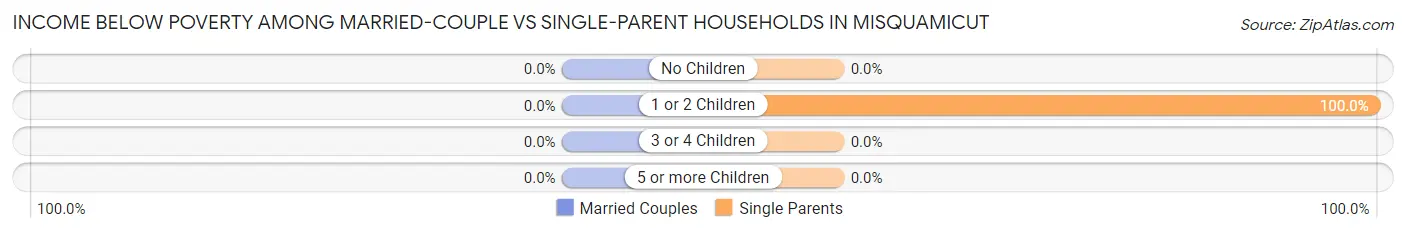
| Children | Married-Couple Families | Single-Parent Households |
| No Children | 0 (0.0%) | 0 (0.0%) |
| 1 or 2 Children | 0 (0.0%) | 13 (100.0%) |
| 3 or 4 Children | 0 (0.0%) | 0 (0.0%) |
| 5 or more Children | 0 (0.0%) | 0 (0.0%) |
| Total | 0 (0.0%) | 13 (100.0%) |
Race in Misquamicut
The most populous races in Misquamicut are , and White / Caucasian (379 | 100.0%).
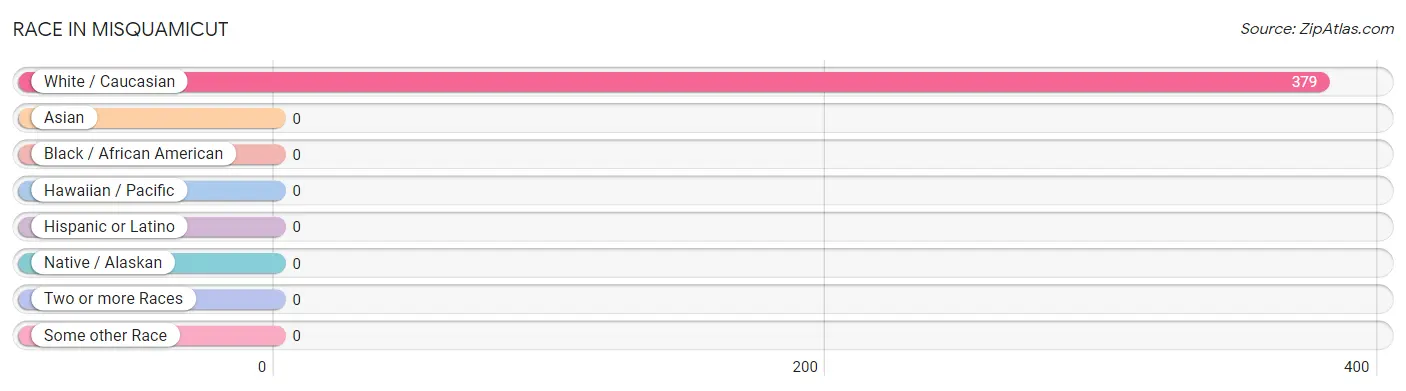
| Race | # Population | % Population |
| Asian | 0 | 0.0% |
| Black / African American | 0 | 0.0% |
| Hawaiian / Pacific | 0 | 0.0% |
| Hispanic or Latino | 0 | 0.0% |
| Native / Alaskan | 0 | 0.0% |
| White / Caucasian | 379 | 100.0% |
| Two or more Races | 0 | 0.0% |
| Some other Race | 0 | 0.0% |
| Total | 379 | 100.0% |
Ancestry in Misquamicut
The most populous ancestries reported in Misquamicut are Italian (136 | 35.9%), Irish (112 | 29.5%), English (77 | 20.3%), German (38 | 10.0%), and French Canadian (31 | 8.2%), together accounting for 104.0% of all Misquamicut residents.
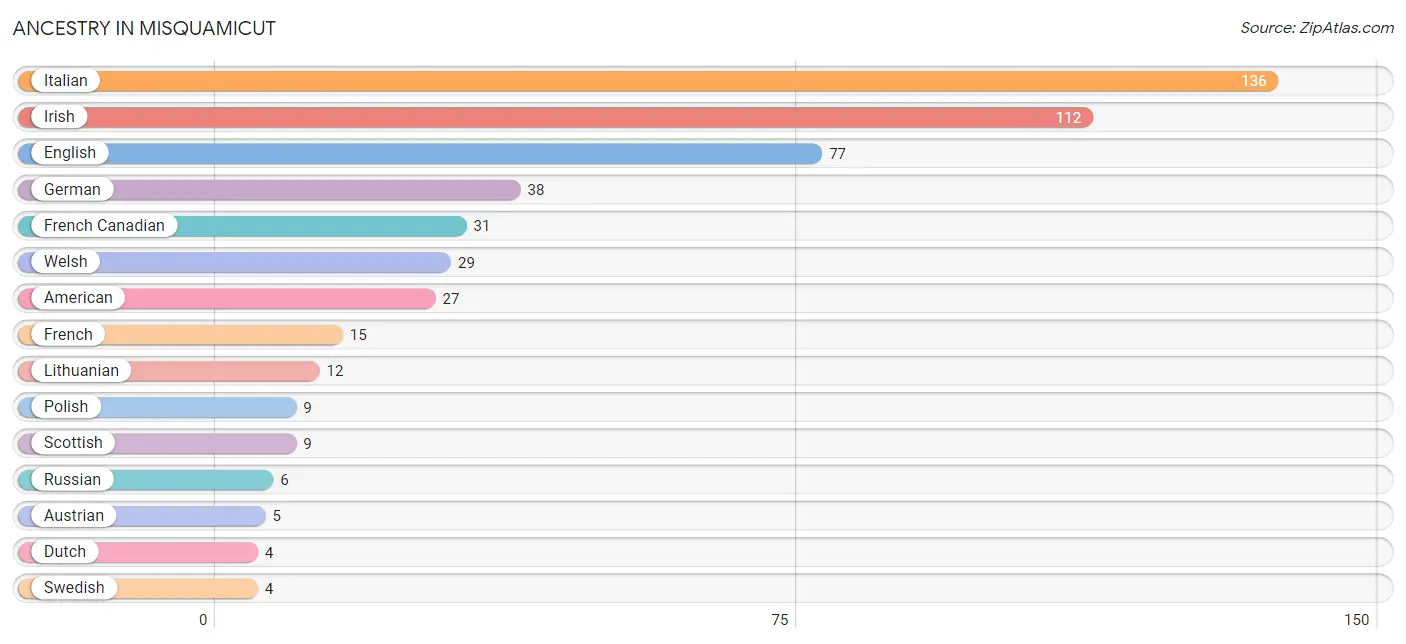
| Ancestry | # Population | % Population |
| American | 27 | 7.1% |
| Austrian | 5 | 1.3% |
| Dutch | 4 | 1.1% |
| English | 77 | 20.3% |
| French | 15 | 4.0% |
| French Canadian | 31 | 8.2% |
| German | 38 | 10.0% |
| Irish | 112 | 29.5% |
| Italian | 136 | 35.9% |
| Lithuanian | 12 | 3.2% |
| Polish | 9 | 2.4% |
| Russian | 6 | 1.6% |
| Scottish | 9 | 2.4% |
| Swedish | 4 | 1.1% |
| Welsh | 29 | 7.6% | View All 15 Rows |
Immigrants in Misquamicut
The most numerous immigrant groups reported in Misquamicut came from Europe (11 | 2.9%), Germany (6 | 1.6%), Western Europe (6 | 1.6%), Italy (5 | 1.3%), and Southern Europe (5 | 1.3%), together accounting for 8.7% of all Misquamicut residents.
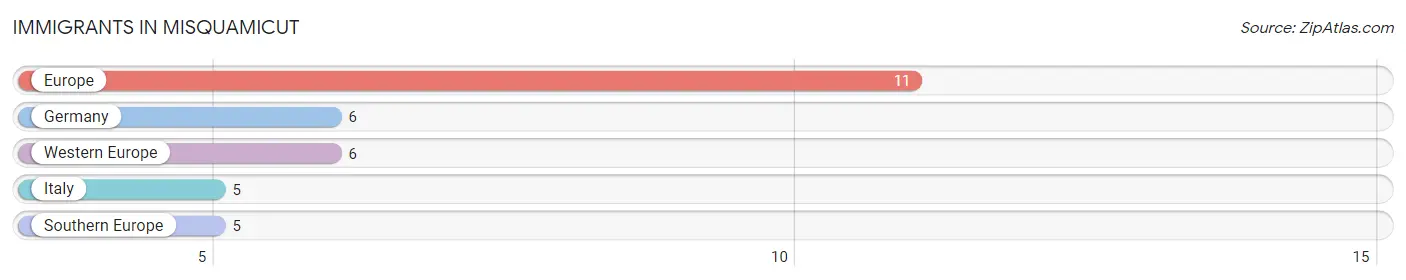
| Immigration Origin | # Population | % Population |
| Europe | 11 | 2.9% |
| Germany | 6 | 1.6% |
| Italy | 5 | 1.3% |
| Southern Europe | 5 | 1.3% |
| Western Europe | 6 | 1.6% | View All 5 Rows |
Sex and Age in Misquamicut
Sex and Age in Misquamicut
The most populous age groups in Misquamicut are 65 to 69 Years (67 | 34.2%) for men and 65 to 69 Years (38 | 20.8%) for women.
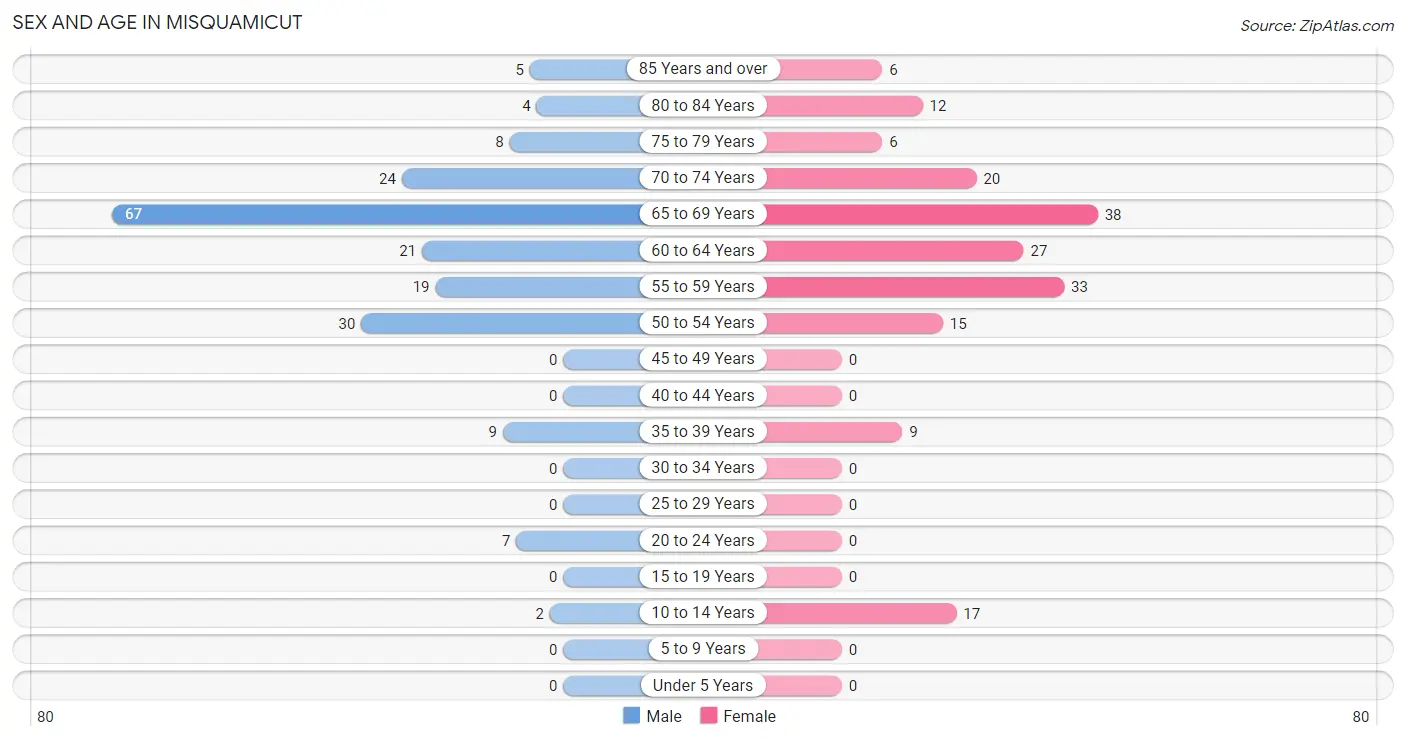
| Age Bracket | Male | Female |
| Under 5 Years | 0 (0.0%) | 0 (0.0%) |
| 5 to 9 Years | 0 (0.0%) | 0 (0.0%) |
| 10 to 14 Years | 2 (1.0%) | 17 (9.3%) |
| 15 to 19 Years | 0 (0.0%) | 0 (0.0%) |
| 20 to 24 Years | 7 (3.6%) | 0 (0.0%) |
| 25 to 29 Years | 0 (0.0%) | 0 (0.0%) |
| 30 to 34 Years | 0 (0.0%) | 0 (0.0%) |
| 35 to 39 Years | 9 (4.6%) | 9 (4.9%) |
| 40 to 44 Years | 0 (0.0%) | 0 (0.0%) |
| 45 to 49 Years | 0 (0.0%) | 0 (0.0%) |
| 50 to 54 Years | 30 (15.3%) | 15 (8.2%) |
| 55 to 59 Years | 19 (9.7%) | 33 (18.0%) |
| 60 to 64 Years | 21 (10.7%) | 27 (14.7%) |
| 65 to 69 Years | 67 (34.2%) | 38 (20.8%) |
| 70 to 74 Years | 24 (12.2%) | 20 (10.9%) |
| 75 to 79 Years | 8 (4.1%) | 6 (3.3%) |
| 80 to 84 Years | 4 (2.0%) | 12 (6.6%) |
| 85 Years and over | 5 (2.5%) | 6 (3.3%) |
| Total | 196 (100.0%) | 183 (100.0%) |
Families and Households in Misquamicut
Median Family Size in Misquamicut
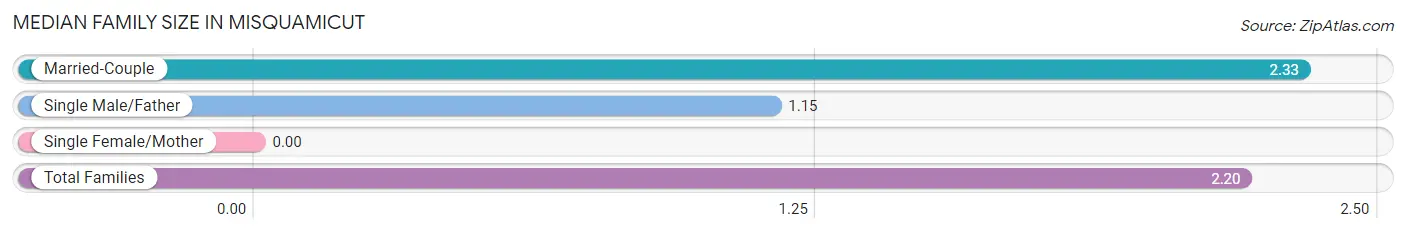
| Family Type | # Families | Family Size |
| Married-Couple | 105 (89.0%) | 2.33 |
| Single Male/Father | 13 (11.0%) | 1.15 |
| Single Female/Mother | 0 (0.0%) | - |
| Total Families | 118 (100.0%) | 2.20 |
Median Household Size in Misquamicut
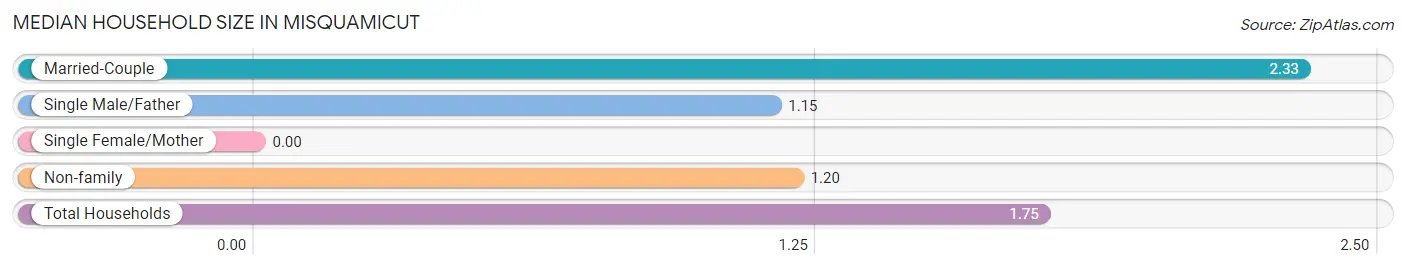
| Household Type | # Households | Household Size |
| Married-Couple | 105 (48.4%) | 2.33 |
| Single Male/Father | 13 (6.0%) | 1.15 |
| Single Female/Mother | 0 (0.0%) | - |
| Non-family | 99 (45.6%) | 1.20 |
| Total Households | 217 (100.0%) | 1.75 |
Household Size by Marriage Status in Misquamicut
Out of a total of 217 households in Misquamicut, 118 (54.4%) are family households, while 99 (45.6%) are nonfamily households. The most numerous type of family households are 2-person households, comprising 93, and the most common type of nonfamily households are 1-person households, comprising 78.
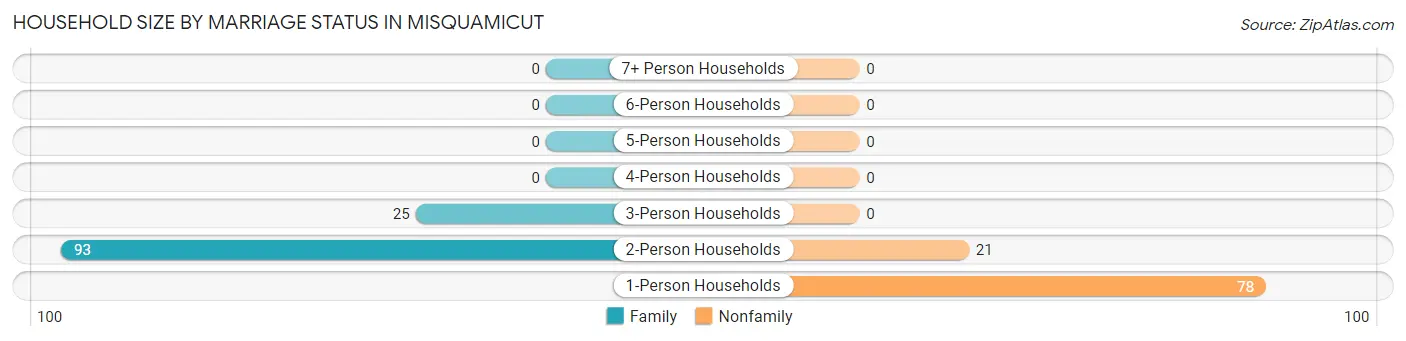
| Household Size | Family Households | Nonfamily Households |
| 1-Person Households | - | 78 (35.9%) |
| 2-Person Households | 93 (42.9%) | 21 (9.7%) |
| 3-Person Households | 25 (11.5%) | 0 (0.0%) |
| 4-Person Households | 0 (0.0%) | 0 (0.0%) |
| 5-Person Households | 0 (0.0%) | 0 (0.0%) |
| 6-Person Households | 0 (0.0%) | 0 (0.0%) |
| 7+ Person Households | 0 (0.0%) | 0 (0.0%) |
| Total | 118 (54.4%) | 99 (45.6%) |
Female Fertility in Misquamicut
Fertility by Age in Misquamicut
| Age Bracket | Women with Births | Births / 1,000 Women |
| 15 to 19 years | 0 (0.0%) | 0.0 |
| 20 to 34 years | 0 (0.0%) | 0.0 |
| 35 to 50 years | 0 (0.0%) | 0.0 |
| Total | 0 (0.0%) | 0.0 |
Fertility by Age by Marriage Status in Misquamicut
| Age Bracket | Married | Unmarried |
| 15 to 19 years | 0 (0.0%) | 0 (0.0%) |
| 20 to 34 years | 0 (0.0%) | 0 (0.0%) |
| 35 to 50 years | 0 (0.0%) | 0 (0.0%) |
| Total | 0 (0.0%) | 0 (0.0%) |
Fertility by Education in Misquamicut
| Educational Attainment | Women with Births | Births / 1,000 Women |
| Less than High School | 0 (0.0%) | 0.0 |
| High School Diploma | 0 (0.0%) | 0.0 |
| College or Associate's Degree | 0 (0.0%) | 0.0 |
| Bachelor's Degree | 0 (0.0%) | 0.0 |
| Graduate Degree | 0 (0.0%) | 0.0 |
| Total | 0 (0.0%) | 0.0 |
Fertility by Education by Marriage Status in Misquamicut
| Educational Attainment | Married | Unmarried |
| Less than High School | 0 (0.0%) | 0 (0.0%) |
| High School Diploma | 0 (0.0%) | 0 (0.0%) |
| College or Associate's Degree | 0 (0.0%) | 0 (0.0%) |
| Bachelor's Degree | 0 (0.0%) | 0 (0.0%) |
| Graduate Degree | 0 (0.0%) | 0 (0.0%) |
| Total | 0 (0.0%) | 0 (0.0%) |
Employment Characteristics in Misquamicut
Employment by Class of Employer in Misquamicut
Among the 140 employed individuals in Misquamicut, private company employees (83 | 59.3%), local government employees (22 | 15.7%), and state government employees (13 | 9.3%) make up the most common classes of employment.
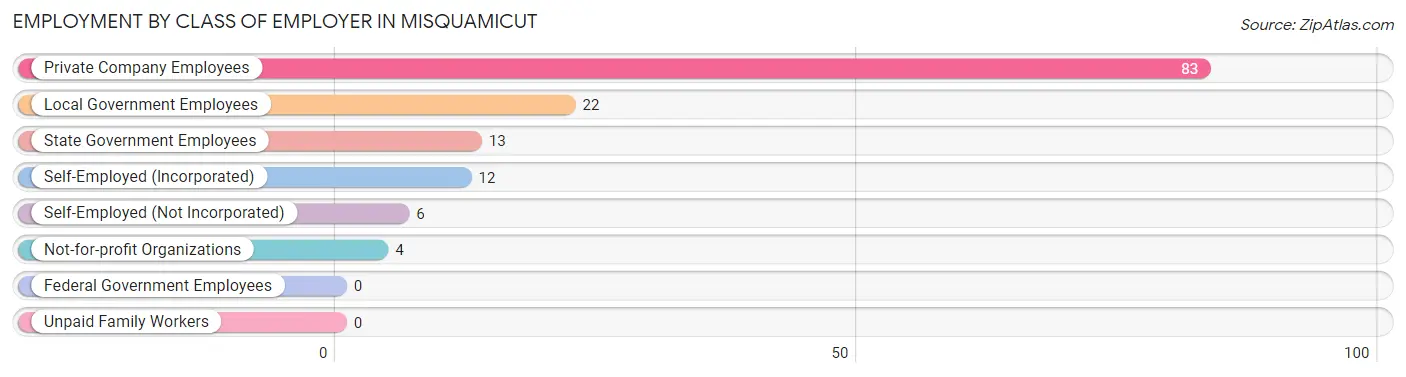
| Employer Class | # Employees | % Employees |
| Private Company Employees | 83 | 59.3% |
| Self-Employed (Incorporated) | 12 | 8.6% |
| Self-Employed (Not Incorporated) | 6 | 4.3% |
| Not-for-profit Organizations | 4 | 2.9% |
| Local Government Employees | 22 | 15.7% |
| State Government Employees | 13 | 9.3% |
| Federal Government Employees | 0 | 0.0% |
| Unpaid Family Workers | 0 | 0.0% |
| Total | 140 | 100.0% |
Employment Status by Age in Misquamicut
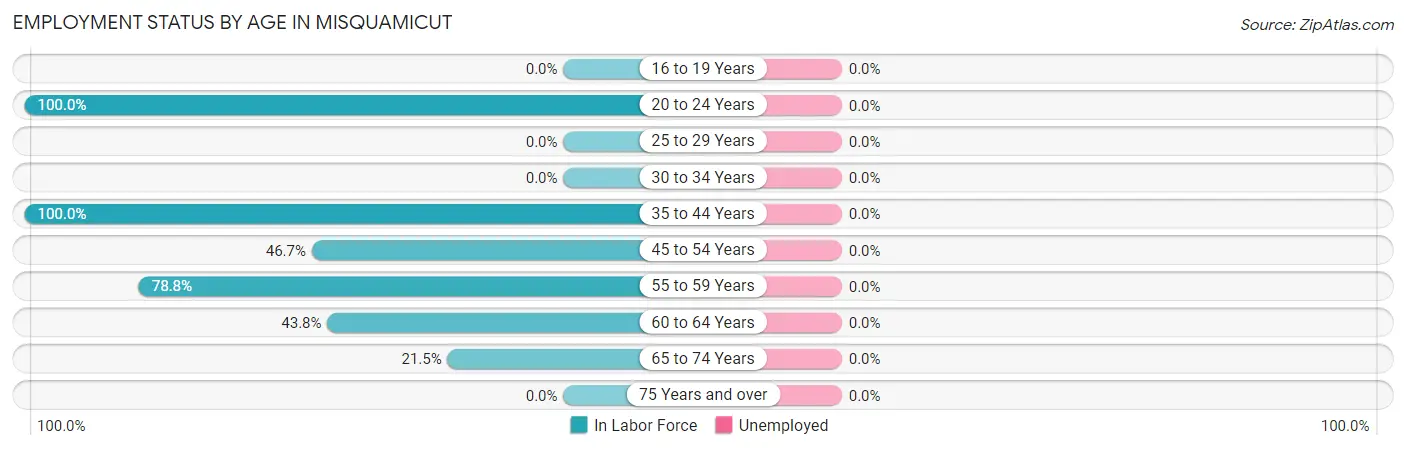
| Age Bracket | In Labor Force | Unemployed |
| 16 to 19 Years | 0 (0.0%) | 0 (0.0%) |
| 20 to 24 Years | 7 (100.0%) | 0 (0.0%) |
| 25 to 29 Years | 0 (0.0%) | 0 (0.0%) |
| 30 to 34 Years | 0 (0.0%) | 0 (0.0%) |
| 35 to 44 Years | 18 (100.0%) | 0 (0.0%) |
| 45 to 54 Years | 21 (46.7%) | 0 (0.0%) |
| 55 to 59 Years | 41 (78.8%) | 0 (0.0%) |
| 60 to 64 Years | 21 (43.8%) | 0 (0.0%) |
| 65 to 74 Years | 32 (21.5%) | 0 (0.0%) |
| 75 Years and over | 0 (0.0%) | 0 (0.0%) |
| Total | 140 (38.9%) | 0 (0.0%) |
Employment Status by Educational Attainment in Misquamicut
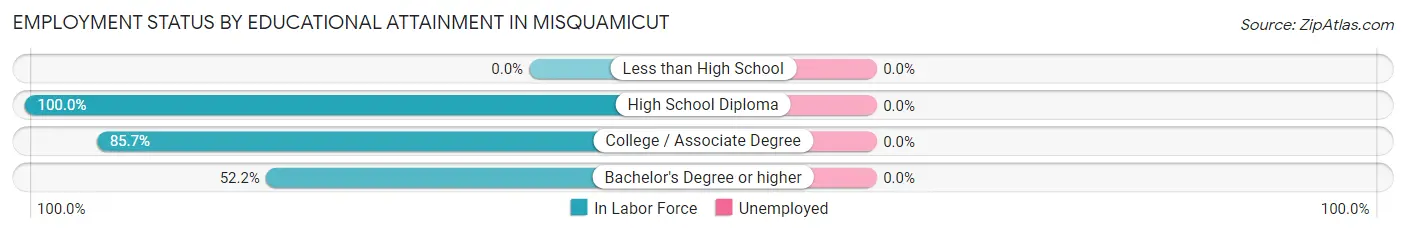
| Educational Attainment | In Labor Force | Unemployed |
| Less than High School | 0 (0.0%) | 0 (0.0%) |
| High School Diploma | 23 (100.0%) | 0 (0.0%) |
| College / Associate Degree | 30 (85.7%) | 0 (0.0%) |
| Bachelor's Degree or higher | 48 (52.2%) | 0 (0.0%) |
| Total | 101 (62.0%) | 0 (0.0%) |
Employment Occupations by Sex in Misquamicut
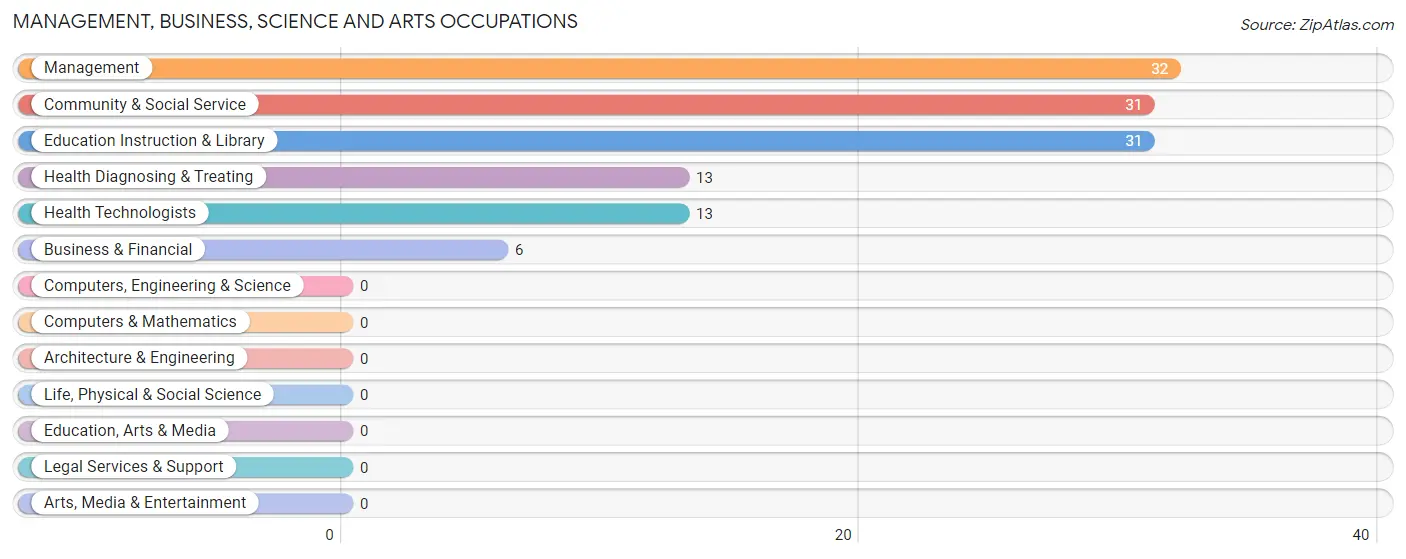
Management, Business, Science and Arts Occupations
The most common Management, Business, Science and Arts occupations in Misquamicut are Management (32 | 22.9%), Community & Social Service (31 | 22.1%), Education Instruction & Library (31 | 22.1%), Health Diagnosing & Treating (13 | 9.3%), and Health Technologists (13 | 9.3%).
Management, Business, Science and Arts Occupations by Sex
Within the Management, Business, Science and Arts occupations in Misquamicut, the most male-oriented occupations are Management (100.0%), Health Diagnosing & Treating (53.8%), and Health Technologists (53.8%), while the most female-oriented occupations are Business & Financial (100.0%), Community & Social Service (87.1%), and Education Instruction & Library (87.1%).
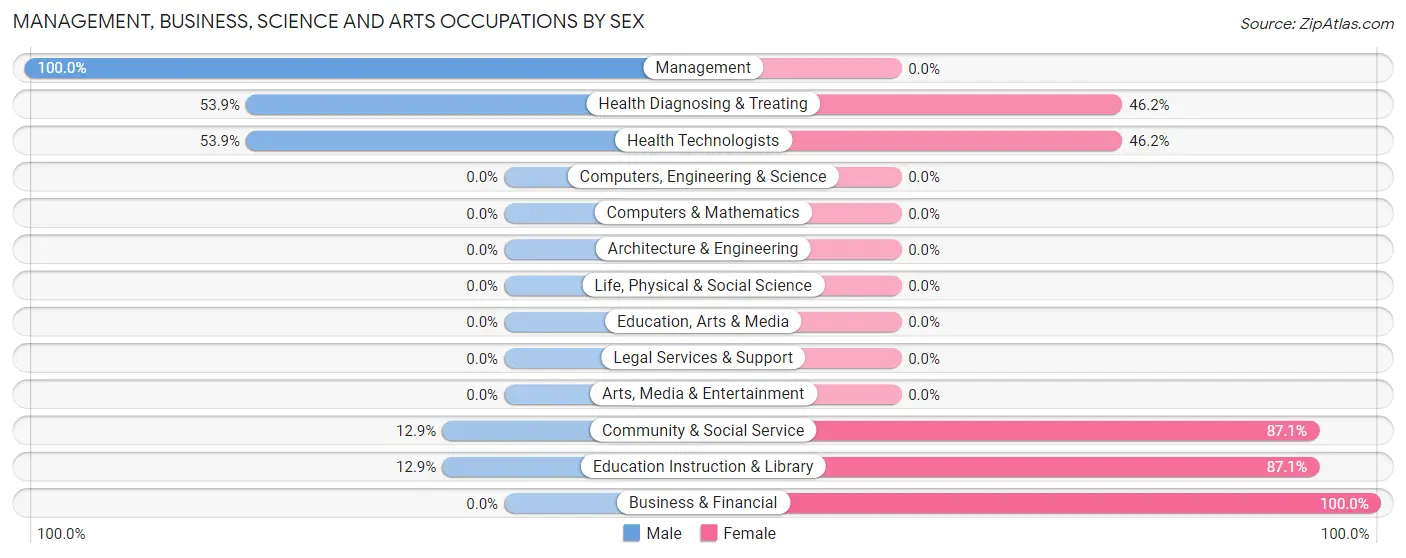
| Occupation | Male | Female |
| Management | 32 (100.0%) | 0 (0.0%) |
| Business & Financial | 0 (0.0%) | 6 (100.0%) |
| Computers, Engineering & Science | 0 (0.0%) | 0 (0.0%) |
| Computers & Mathematics | 0 (0.0%) | 0 (0.0%) |
| Architecture & Engineering | 0 (0.0%) | 0 (0.0%) |
| Life, Physical & Social Science | 0 (0.0%) | 0 (0.0%) |
| Community & Social Service | 4 (12.9%) | 27 (87.1%) |
| Education, Arts & Media | 0 (0.0%) | 0 (0.0%) |
| Legal Services & Support | 0 (0.0%) | 0 (0.0%) |
| Education Instruction & Library | 4 (12.9%) | 27 (87.1%) |
| Arts, Media & Entertainment | 0 (0.0%) | 0 (0.0%) |
| Health Diagnosing & Treating | 7 (53.8%) | 6 (46.2%) |
| Health Technologists | 7 (53.8%) | 6 (46.2%) |
| Total (Category) | 43 (52.4%) | 39 (47.6%) |
| Total (Overall) | 72 (51.4%) | 68 (48.6%) |
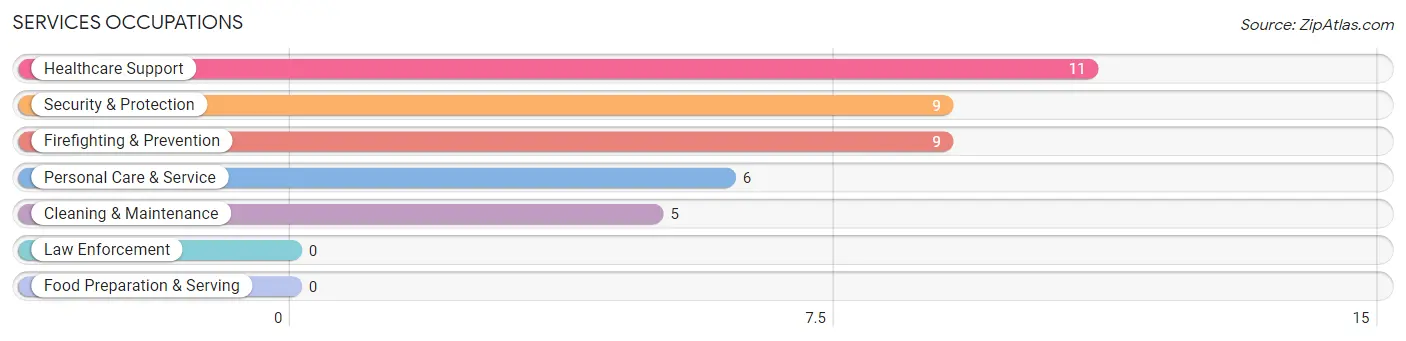
Services Occupations
The most common Services occupations in Misquamicut are Healthcare Support (11 | 7.9%), Security & Protection (9 | 6.4%), Firefighting & Prevention (9 | 6.4%), Personal Care & Service (6 | 4.3%), and Cleaning & Maintenance (5 | 3.6%).
Services Occupations by Sex
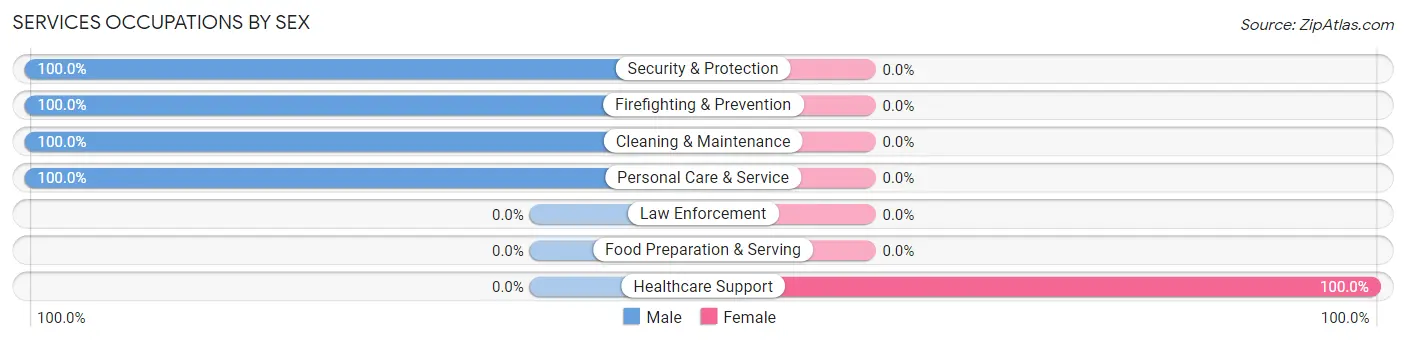
| Occupation | Male | Female |
| Healthcare Support | 0 (0.0%) | 11 (100.0%) |
| Security & Protection | 9 (100.0%) | 0 (0.0%) |
| Firefighting & Prevention | 9 (100.0%) | 0 (0.0%) |
| Law Enforcement | 0 (0.0%) | 0 (0.0%) |
| Food Preparation & Serving | 0 (0.0%) | 0 (0.0%) |
| Cleaning & Maintenance | 5 (100.0%) | 0 (0.0%) |
| Personal Care & Service | 6 (100.0%) | 0 (0.0%) |
| Total (Category) | 20 (64.5%) | 11 (35.5%) |
| Total (Overall) | 72 (51.4%) | 68 (48.6%) |
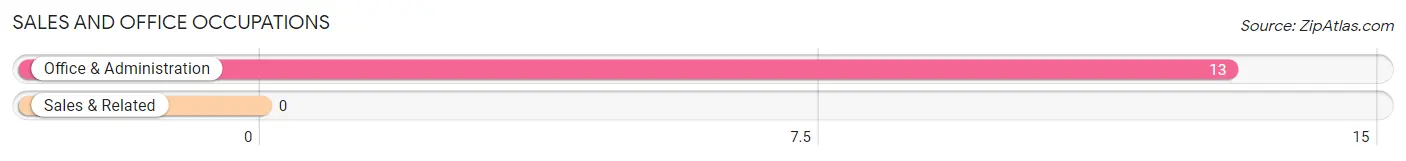
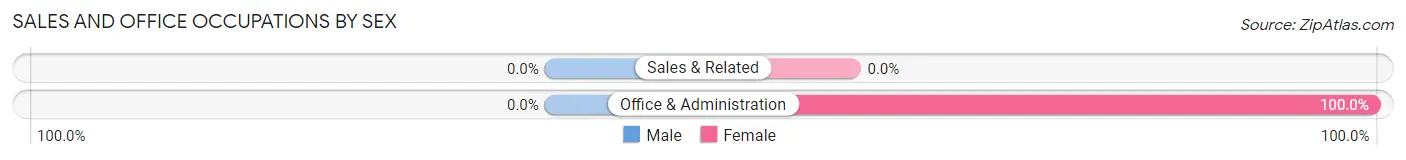
Sales and Office Occupations
The most common Sales and Office occupations in Misquamicut are , and Office & Administration (13 | 9.3%).
Sales and Office Occupations by Sex
| Occupation | Male | Female |
| Sales & Related | 0 (0.0%) | 0 (0.0%) |
| Office & Administration | 0 (0.0%) | 13 (100.0%) |
| Total (Category) | 0 (0.0%) | 13 (100.0%) |
| Total (Overall) | 72 (51.4%) | 68 (48.6%) |
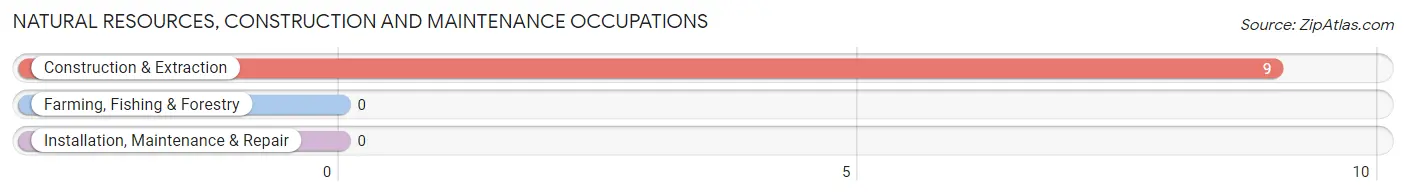
Natural Resources, Construction and Maintenance Occupations
The most common Natural Resources, Construction and Maintenance occupations in Misquamicut are , and Construction & Extraction (9 | 6.4%).
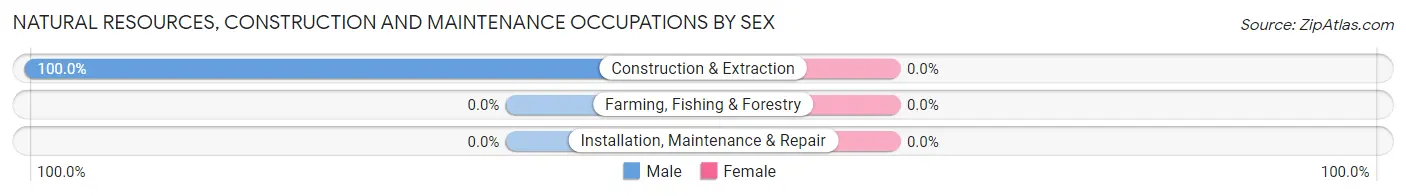
Natural Resources, Construction and Maintenance Occupations by Sex
| Occupation | Male | Female |
| Farming, Fishing & Forestry | 0 (0.0%) | 0 (0.0%) |
| Construction & Extraction | 9 (100.0%) | 0 (0.0%) |
| Installation, Maintenance & Repair | 0 (0.0%) | 0 (0.0%) |
| Total (Category) | 9 (100.0%) | 0 (0.0%) |
| Total (Overall) | 72 (51.4%) | 68 (48.6%) |
Production, Transportation and Moving Occupations
The most common Production, Transportation and Moving occupations in Misquamicut are , and Production (5 | 3.6%).
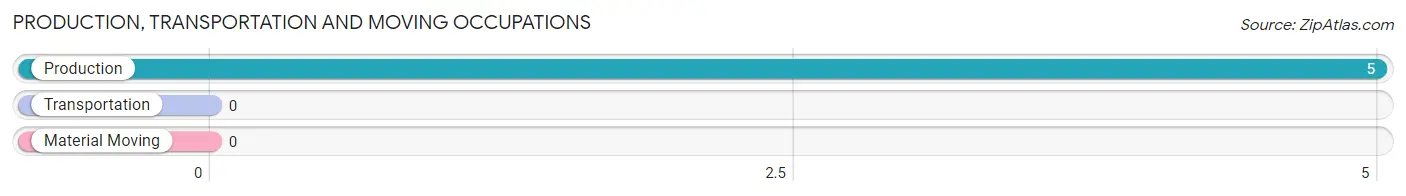
Production, Transportation and Moving Occupations by Sex
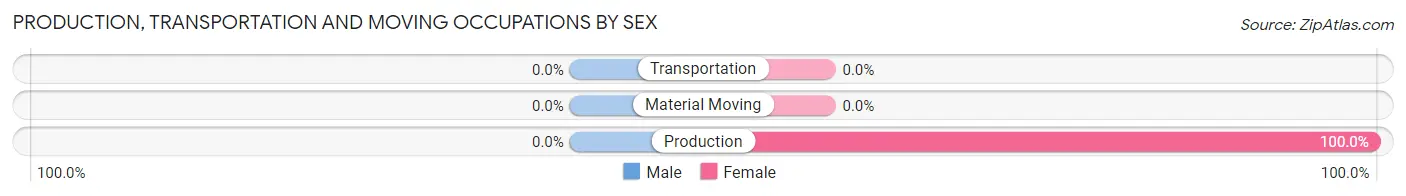
| Occupation | Male | Female |
| Production | 0 (0.0%) | 5 (100.0%) |
| Transportation | 0 (0.0%) | 0 (0.0%) |
| Material Moving | 0 (0.0%) | 0 (0.0%) |
| Total (Category) | 0 (0.0%) | 5 (100.0%) |
| Total (Overall) | 72 (51.4%) | 68 (48.6%) |
Employment Industries by Sex in Misquamicut
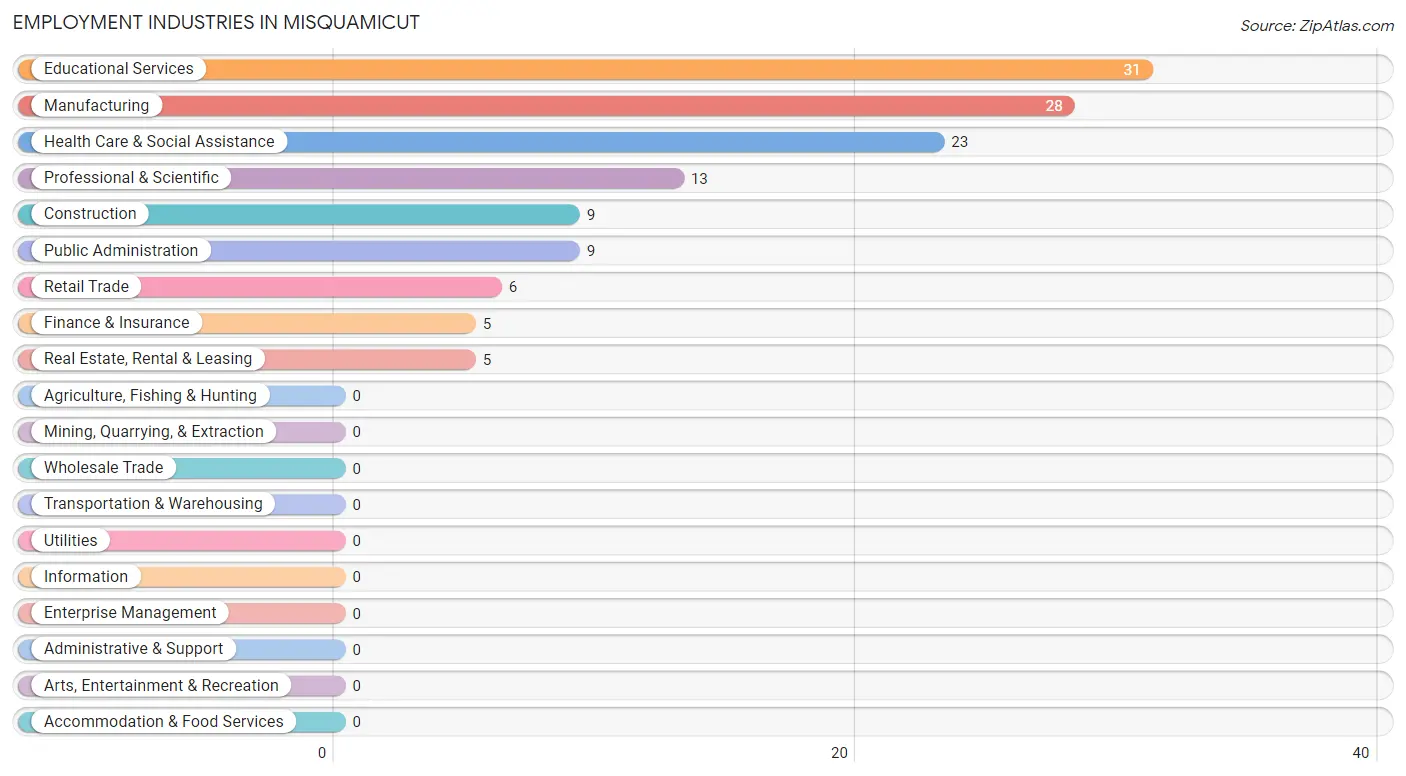
Employment Industries in Misquamicut
The major employment industries in Misquamicut include Educational Services (31 | 22.1%), Manufacturing (28 | 20.0%), Health Care & Social Assistance (23 | 16.4%), Professional & Scientific (13 | 9.3%), and Construction (9 | 6.4%).
Employment Industries by Sex in Misquamicut
The Misquamicut industries that see more men than women are Construction (100.0%), Retail Trade (100.0%), and Finance & Insurance (100.0%), whereas the industries that tend to have a higher number of women are Educational Services (87.1%), Health Care & Social Assistance (56.5%), and Professional & Scientific (46.2%).
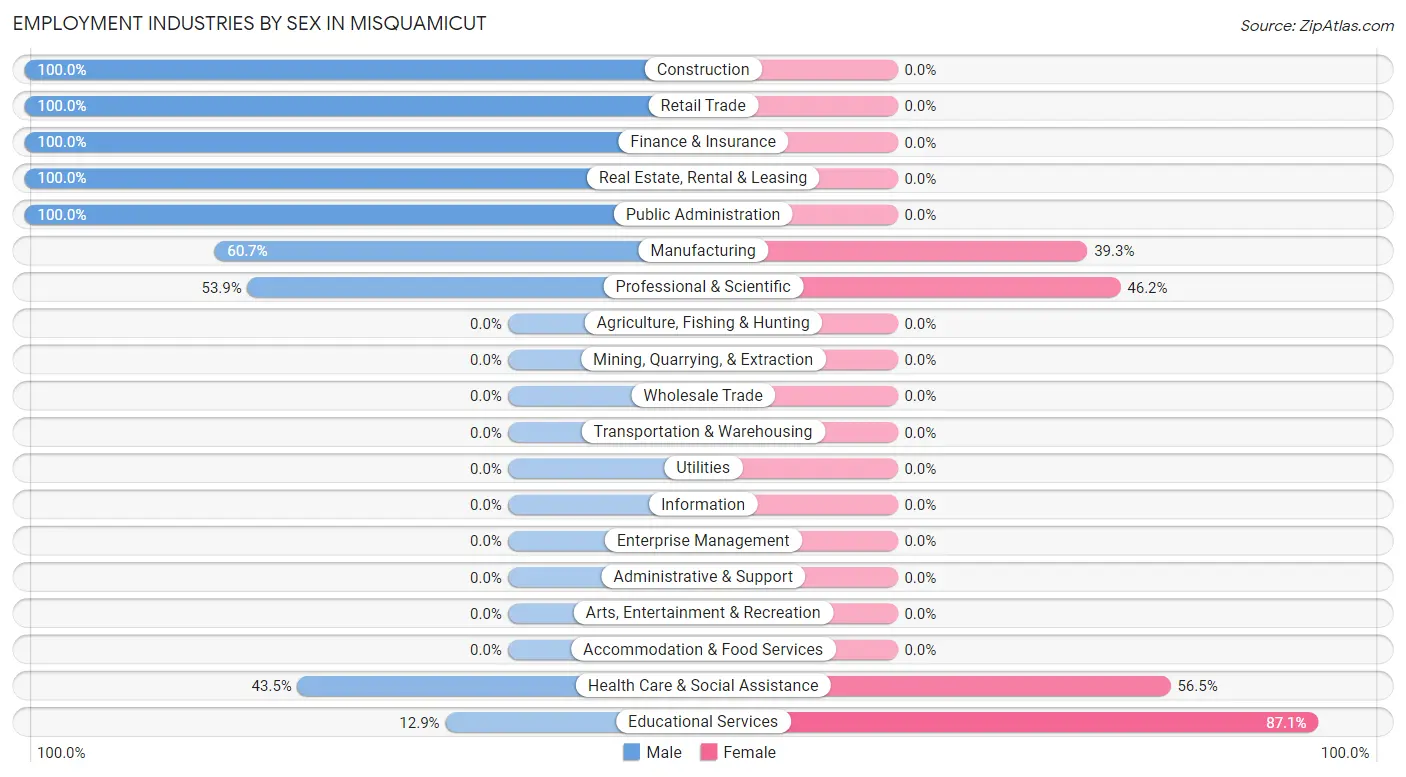
| Industry | Male | Female |
| Agriculture, Fishing & Hunting | 0 (0.0%) | 0 (0.0%) |
| Mining, Quarrying, & Extraction | 0 (0.0%) | 0 (0.0%) |
| Construction | 9 (100.0%) | 0 (0.0%) |
| Manufacturing | 17 (60.7%) | 11 (39.3%) |
| Wholesale Trade | 0 (0.0%) | 0 (0.0%) |
| Retail Trade | 6 (100.0%) | 0 (0.0%) |
| Transportation & Warehousing | 0 (0.0%) | 0 (0.0%) |
| Utilities | 0 (0.0%) | 0 (0.0%) |
| Information | 0 (0.0%) | 0 (0.0%) |
| Finance & Insurance | 5 (100.0%) | 0 (0.0%) |
| Real Estate, Rental & Leasing | 5 (100.0%) | 0 (0.0%) |
| Professional & Scientific | 7 (53.8%) | 6 (46.2%) |
| Enterprise Management | 0 (0.0%) | 0 (0.0%) |
| Administrative & Support | 0 (0.0%) | 0 (0.0%) |
| Educational Services | 4 (12.9%) | 27 (87.1%) |
| Health Care & Social Assistance | 10 (43.5%) | 13 (56.5%) |
| Arts, Entertainment & Recreation | 0 (0.0%) | 0 (0.0%) |
| Accommodation & Food Services | 0 (0.0%) | 0 (0.0%) |
| Public Administration | 9 (100.0%) | 0 (0.0%) |
| Total | 72 (51.4%) | 68 (48.6%) |
Education in Misquamicut
School Enrollment in Misquamicut
The most common levels of schooling among the 36 students in Misquamicut are middle school (10 | 27.8%), college / undergraduate (10 | 27.8%), and elementary school (9 | 25.0%).
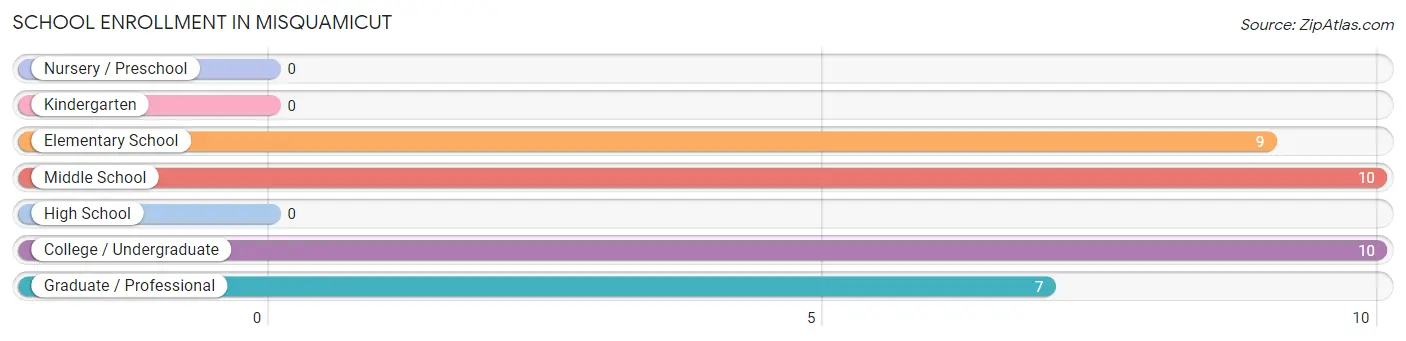
| School Level | # Students | % Students |
| Nursery / Preschool | 0 | 0.0% |
| Kindergarten | 0 | 0.0% |
| Elementary School | 9 | 25.0% |
| Middle School | 10 | 27.8% |
| High School | 0 | 0.0% |
| College / Undergraduate | 10 | 27.8% |
| Graduate / Professional | 7 | 19.4% |
| Total | 36 | 100.0% |
School Enrollment by Age by Funding Source in Misquamicut
Out of a total of 36 students who are enrolled in schools in Misquamicut, 9 (25.0%) attend a private institution, while the remaining 27 (75.0%) are enrolled in public schools. The age group of 10 to 14 year olds has the highest likelihood of being enrolled in private schools, with 9 (47.4% in the age bracket) enrolled. Conversely, the age group of 20 to 24 year olds has the lowest likelihood of being enrolled in a private school, with 7 (100.0% in the age bracket) attending a public institution.
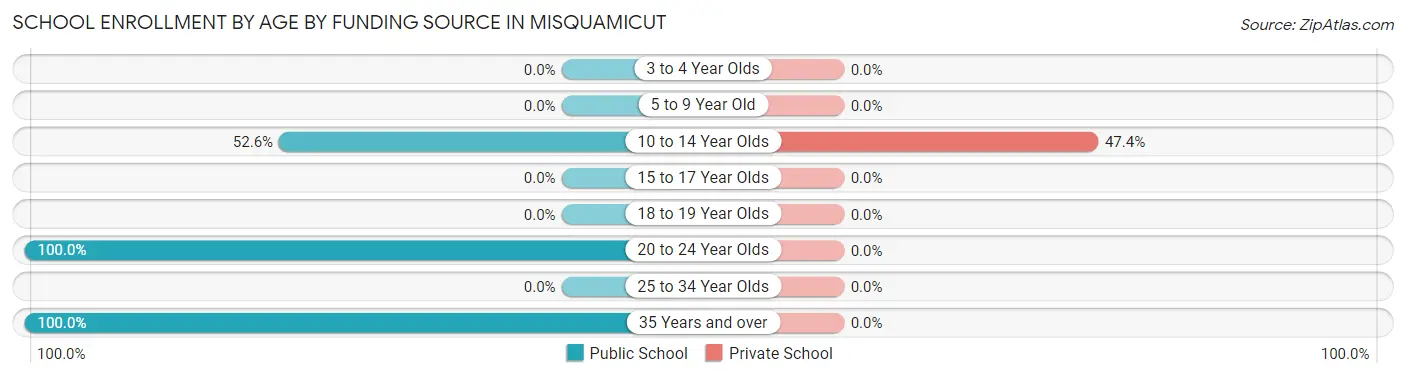
| Age Bracket | Public School | Private School |
| 3 to 4 Year Olds | 0 (0.0%) | 0 (0.0%) |
| 5 to 9 Year Old | 0 (0.0%) | 0 (0.0%) |
| 10 to 14 Year Olds | 10 (52.6%) | 9 (47.4%) |
| 15 to 17 Year Olds | 0 (0.0%) | 0 (0.0%) |
| 18 to 19 Year Olds | 0 (0.0%) | 0 (0.0%) |
| 20 to 24 Year Olds | 7 (100.0%) | 0 (0.0%) |
| 25 to 34 Year Olds | 0 (0.0%) | 0 (0.0%) |
| 35 Years and over | 10 (100.0%) | 0 (0.0%) |
| Total | 27 (75.0%) | 9 (25.0%) |
Educational Attainment by Field of Study in Misquamicut
Engineering (45 | 21.0%), business (37 | 17.3%), science & technology (27 | 12.6%), education (24 | 11.2%), and liberal arts & history (17 | 7.9%) are the most common fields of study among 214 individuals in Misquamicut who have obtained a bachelor's degree or higher.
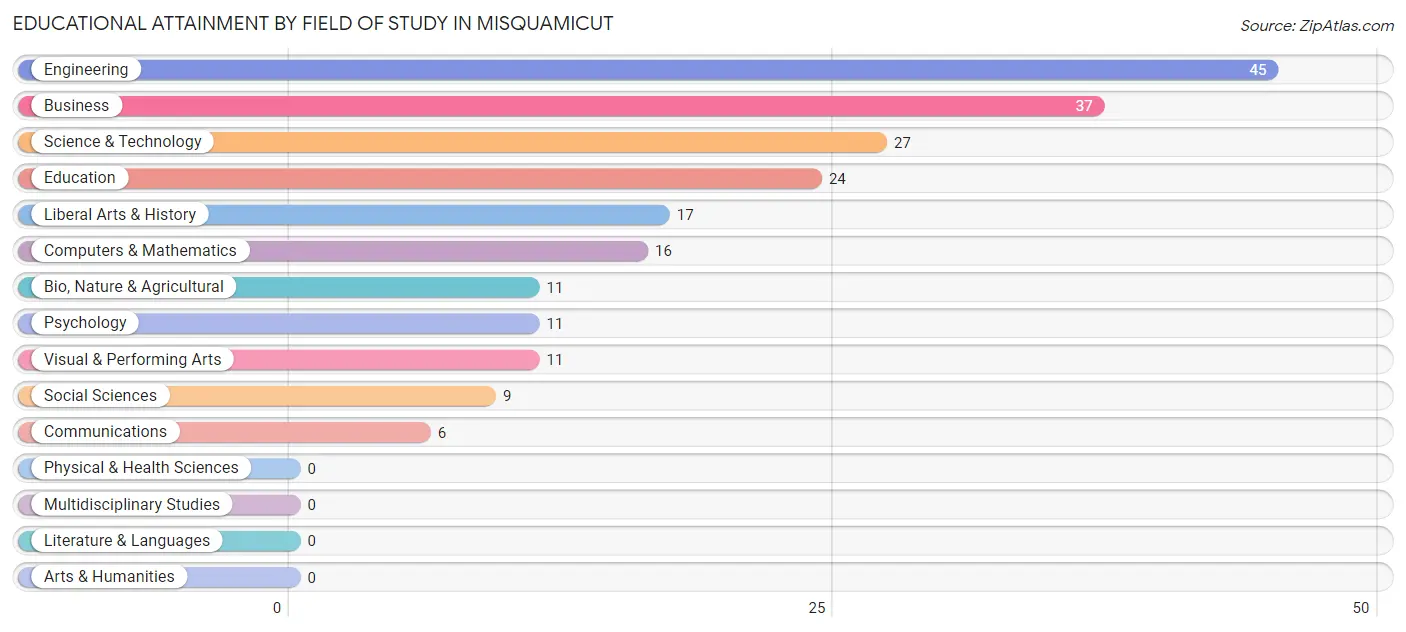
| Field of Study | # Graduates | % Graduates |
| Computers & Mathematics | 16 | 7.5% |
| Bio, Nature & Agricultural | 11 | 5.1% |
| Physical & Health Sciences | 0 | 0.0% |
| Psychology | 11 | 5.1% |
| Social Sciences | 9 | 4.2% |
| Engineering | 45 | 21.0% |
| Multidisciplinary Studies | 0 | 0.0% |
| Science & Technology | 27 | 12.6% |
| Business | 37 | 17.3% |
| Education | 24 | 11.2% |
| Literature & Languages | 0 | 0.0% |
| Liberal Arts & History | 17 | 7.9% |
| Visual & Performing Arts | 11 | 5.1% |
| Communications | 6 | 2.8% |
| Arts & Humanities | 0 | 0.0% |
| Total | 214 | 100.0% |
Transportation & Commute in Misquamicut
Vehicle Availability by Sex in Misquamicut
The most prevalent vehicle ownership categories in Misquamicut are males with 2 vehicles (41, accounting for 56.9%) and females with 2 vehicles (45, making up 60.3%).
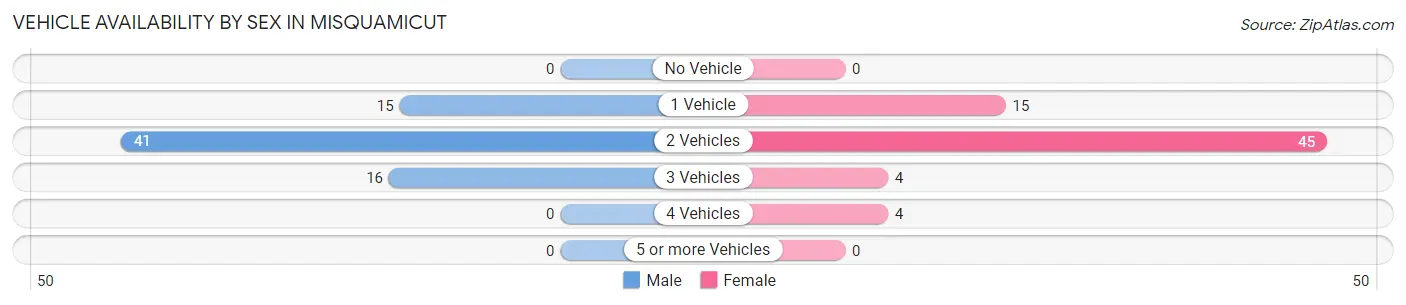
| Vehicles Available | Male | Female |
| No Vehicle | 0 (0.0%) | 0 (0.0%) |
| 1 Vehicle | 15 (20.8%) | 15 (22.1%) |
| 2 Vehicles | 41 (56.9%) | 45 (66.2%) |
| 3 Vehicles | 16 (22.2%) | 4 (5.9%) |
| 4 Vehicles | 0 (0.0%) | 4 (5.9%) |
| 5 or more Vehicles | 0 (0.0%) | 0 (0.0%) |
| Total | 72 (100.0%) | 68 (100.0%) |
Commute Time in Misquamicut
The most frequently occuring commute durations in Misquamicut are 90 or more minutes (35 commuters, 27.1%), 35 to 39 minutes (17 commuters, 13.2%), and 60 to 89 minutes (13 commuters, 10.1%).
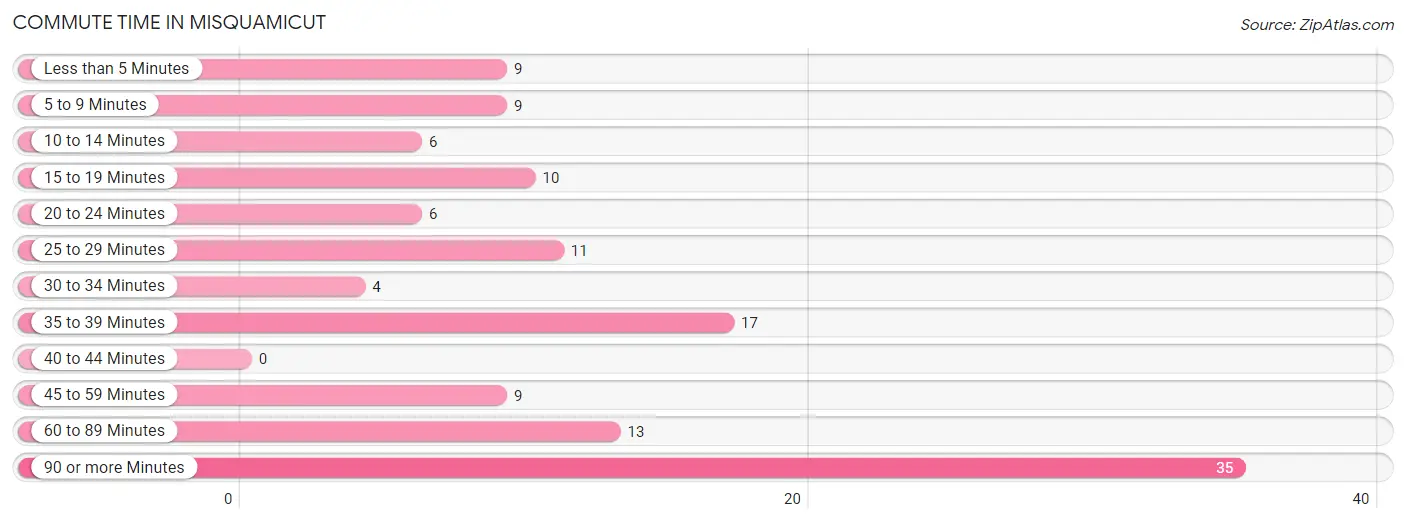
| Commute Time | # Commuters | % Commuters |
| Less than 5 Minutes | 9 | 7.0% |
| 5 to 9 Minutes | 9 | 7.0% |
| 10 to 14 Minutes | 6 | 4.6% |
| 15 to 19 Minutes | 10 | 7.7% |
| 20 to 24 Minutes | 6 | 4.6% |
| 25 to 29 Minutes | 11 | 8.5% |
| 30 to 34 Minutes | 4 | 3.1% |
| 35 to 39 Minutes | 17 | 13.2% |
| 40 to 44 Minutes | 0 | 0.0% |
| 45 to 59 Minutes | 9 | 7.0% |
| 60 to 89 Minutes | 13 | 10.1% |
| 90 or more Minutes | 35 | 27.1% |
Commute Time by Sex in Misquamicut
The most common commute times in Misquamicut are 35 to 39 minutes (17 commuters, 25.4%) for males and 90 or more minutes (26 commuters, 41.9%) for females.
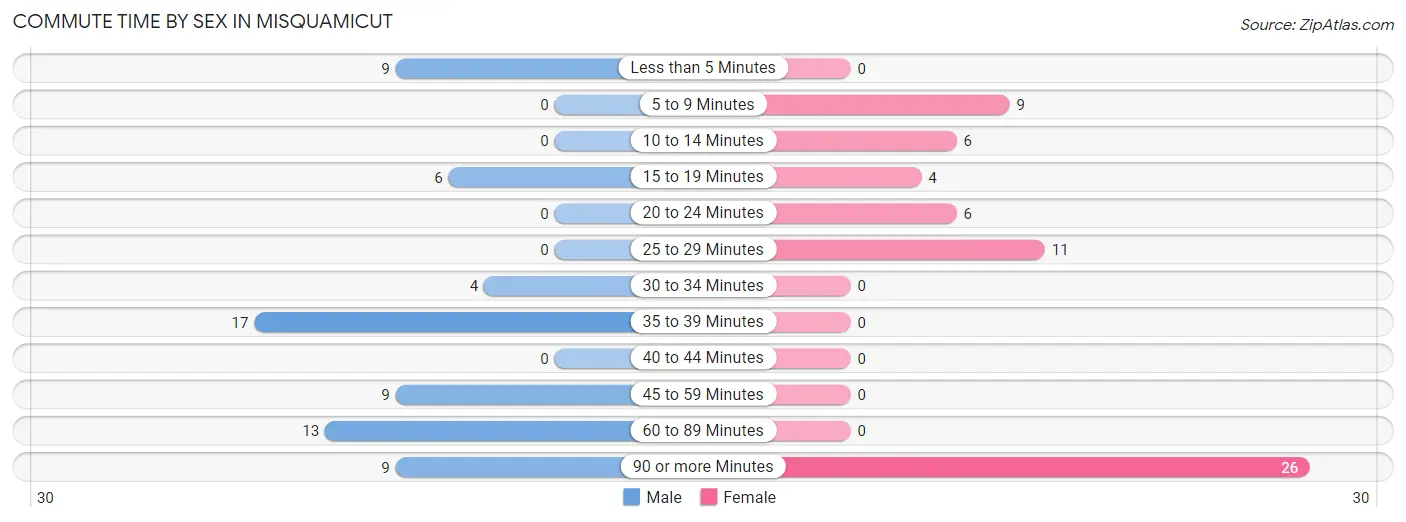
| Commute Time | Male | Female |
| Less than 5 Minutes | 9 (13.4%) | 0 (0.0%) |
| 5 to 9 Minutes | 0 (0.0%) | 9 (14.5%) |
| 10 to 14 Minutes | 0 (0.0%) | 6 (9.7%) |
| 15 to 19 Minutes | 6 (9.0%) | 4 (6.5%) |
| 20 to 24 Minutes | 0 (0.0%) | 6 (9.7%) |
| 25 to 29 Minutes | 0 (0.0%) | 11 (17.7%) |
| 30 to 34 Minutes | 4 (6.0%) | 0 (0.0%) |
| 35 to 39 Minutes | 17 (25.4%) | 0 (0.0%) |
| 40 to 44 Minutes | 0 (0.0%) | 0 (0.0%) |
| 45 to 59 Minutes | 9 (13.4%) | 0 (0.0%) |
| 60 to 89 Minutes | 13 (19.4%) | 0 (0.0%) |
| 90 or more Minutes | 9 (13.4%) | 26 (41.9%) |
Time of Departure to Work by Sex in Misquamicut
The most frequent times of departure to work in Misquamicut are 6:30 AM to 6:59 AM (26, 38.8%) for males and 7:30 AM to 7:59 AM (21, 33.9%) for females.
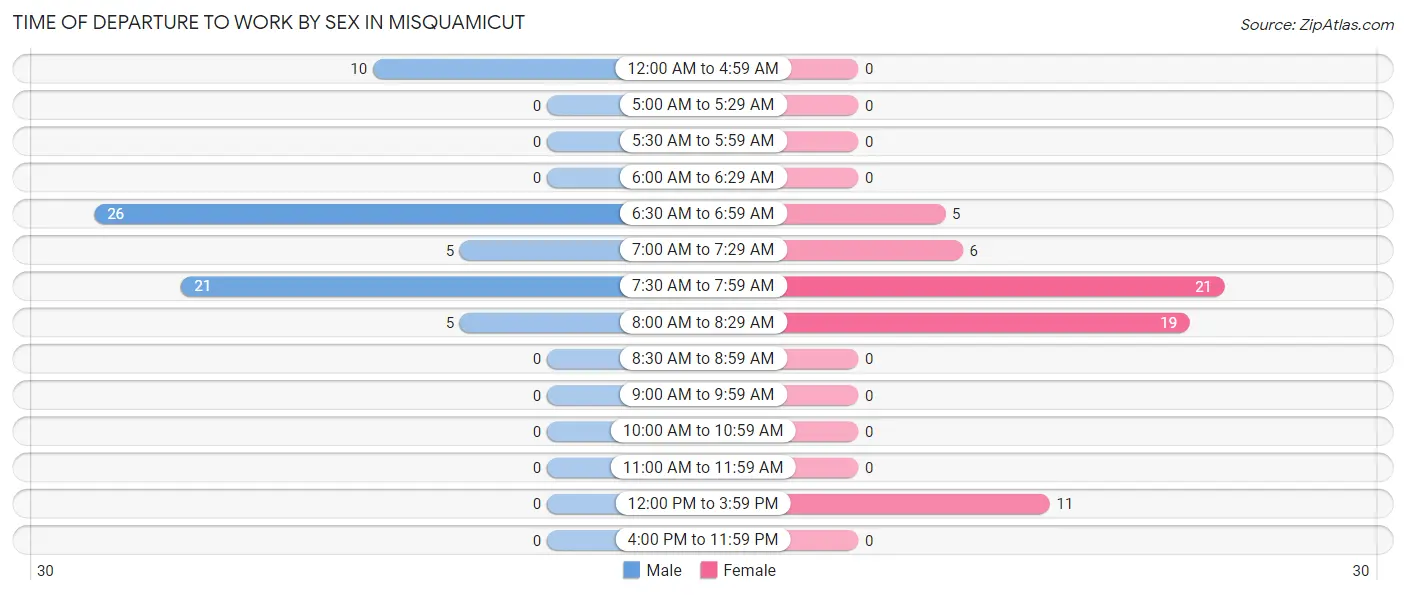
| Time of Departure | Male | Female |
| 12:00 AM to 4:59 AM | 10 (14.9%) | 0 (0.0%) |
| 5:00 AM to 5:29 AM | 0 (0.0%) | 0 (0.0%) |
| 5:30 AM to 5:59 AM | 0 (0.0%) | 0 (0.0%) |
| 6:00 AM to 6:29 AM | 0 (0.0%) | 0 (0.0%) |
| 6:30 AM to 6:59 AM | 26 (38.8%) | 5 (8.1%) |
| 7:00 AM to 7:29 AM | 5 (7.5%) | 6 (9.7%) |
| 7:30 AM to 7:59 AM | 21 (31.3%) | 21 (33.9%) |
| 8:00 AM to 8:29 AM | 5 (7.5%) | 19 (30.6%) |
| 8:30 AM to 8:59 AM | 0 (0.0%) | 0 (0.0%) |
| 9:00 AM to 9:59 AM | 0 (0.0%) | 0 (0.0%) |
| 10:00 AM to 10:59 AM | 0 (0.0%) | 0 (0.0%) |
| 11:00 AM to 11:59 AM | 0 (0.0%) | 0 (0.0%) |
| 12:00 PM to 3:59 PM | 0 (0.0%) | 11 (17.7%) |
| 4:00 PM to 11:59 PM | 0 (0.0%) | 0 (0.0%) |
| Total | 67 (100.0%) | 62 (100.0%) |
Housing Occupancy in Misquamicut
Occupancy by Ownership in Misquamicut
Of the total 217 dwellings in Misquamicut, owner-occupied units account for 184 (84.8%), while renter-occupied units make up 33 (15.2%).
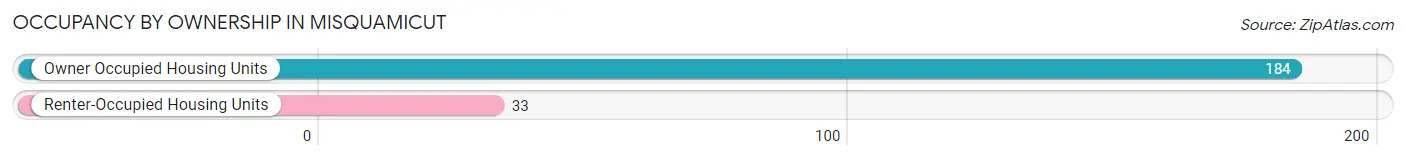
| Occupancy | # Housing Units | % Housing Units |
| Owner Occupied Housing Units | 184 | 84.8% |
| Renter-Occupied Housing Units | 33 | 15.2% |
| Total Occupied Housing Units | 217 | 100.0% |
Occupancy by Household Size in Misquamicut
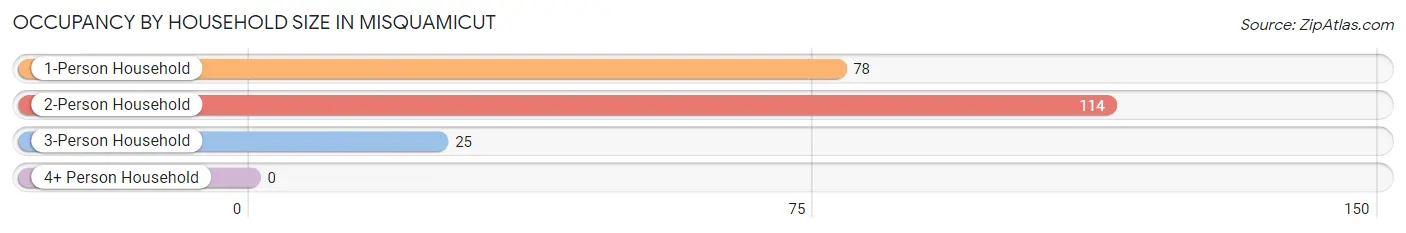
| Household Size | # Housing Units | % Housing Units |
| 1-Person Household | 78 | 35.9% |
| 2-Person Household | 114 | 52.5% |
| 3-Person Household | 25 | 11.5% |
| 4+ Person Household | 0 | 0.0% |
| Total Housing Units | 217 | 100.0% |
Occupancy by Ownership by Household Size in Misquamicut
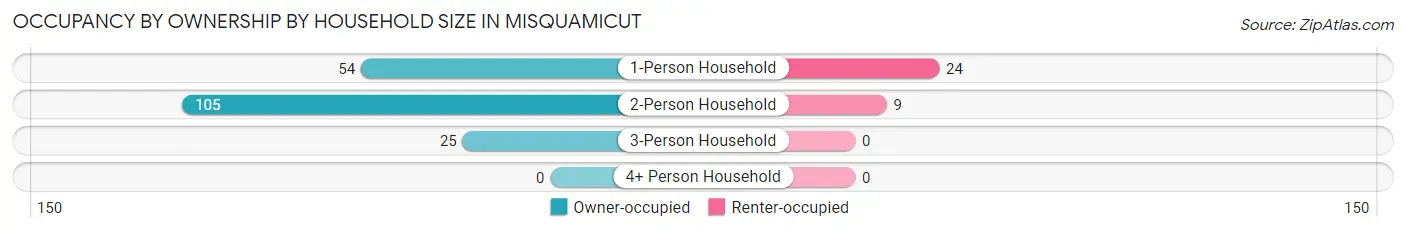
| Household Size | Owner-occupied | Renter-occupied |
| 1-Person Household | 54 (69.2%) | 24 (30.8%) |
| 2-Person Household | 105 (92.1%) | 9 (7.9%) |
| 3-Person Household | 25 (100.0%) | 0 (0.0%) |
| 4+ Person Household | 0 (0.0%) | 0 (0.0%) |
| Total Housing Units | 184 (84.8%) | 33 (15.2%) |
Occupancy by Educational Attainment in Misquamicut
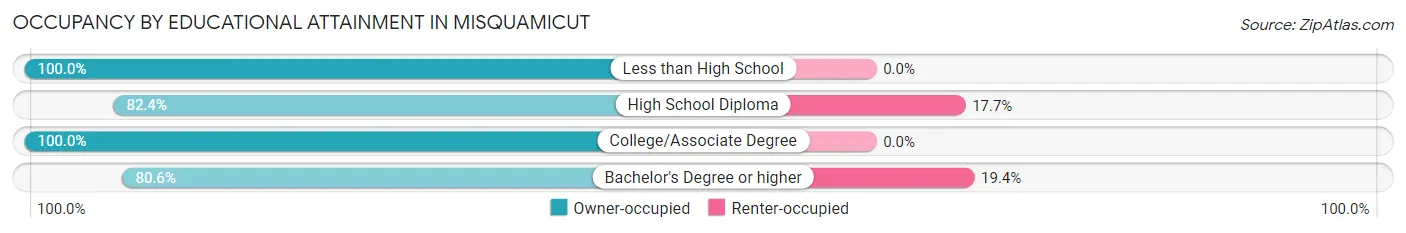
| Household Size | Owner-occupied | Renter-occupied |
| Less than High School | 13 (100.0%) | 0 (0.0%) |
| High School Diploma | 28 (82.4%) | 6 (17.6%) |
| College/Associate Degree | 31 (100.0%) | 0 (0.0%) |
| Bachelor's Degree or higher | 112 (80.6%) | 27 (19.4%) |
Occupancy by Age of Householder in Misquamicut
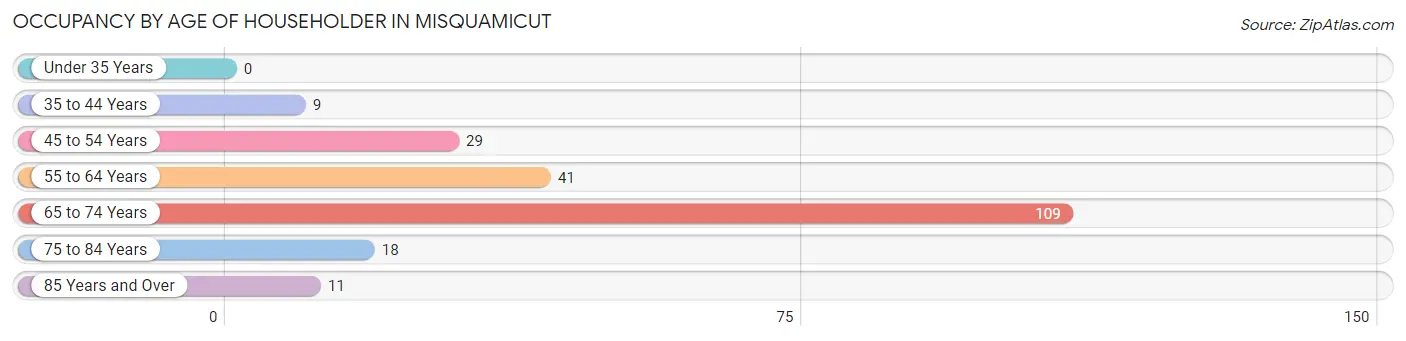
| Age Bracket | # Households | % Households |
| Under 35 Years | 0 | 0.0% |
| 35 to 44 Years | 9 | 4.2% |
| 45 to 54 Years | 29 | 13.4% |
| 55 to 64 Years | 41 | 18.9% |
| 65 to 74 Years | 109 | 50.2% |
| 75 to 84 Years | 18 | 8.3% |
| 85 Years and Over | 11 | 5.1% |
| Total | 217 | 100.0% |
Housing Finances in Misquamicut
Median Income by Occupancy in Misquamicut
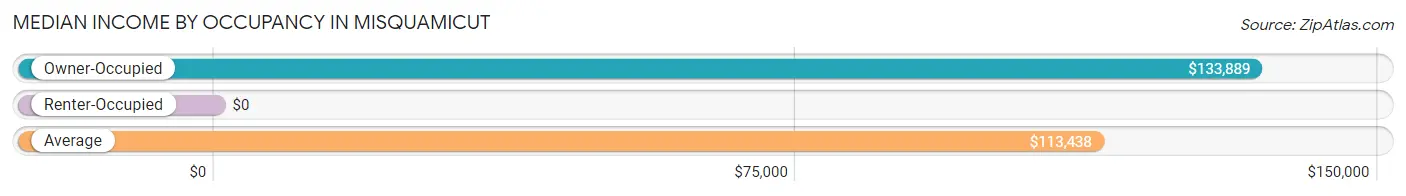
| Occupancy Type | # Households | Median Income |
| Owner-Occupied | 184 (84.8%) | $133,889 |
| Renter-Occupied | 33 (15.2%) | $0 |
| Average | 217 (100.0%) | $113,438 |
Occupancy by Householder Income Bracket in Misquamicut
| Income Bracket | Owner-occupied | Renter-occupied |
| Less than $5,000 | 0 (0.0%) | 0 (0.0%) |
| $5,000 to $9,999 | 11 (6.0%) | 0 (0.0%) |
| $10,000 to $14,999 | 13 (7.1%) | 0 (0.0%) |
| $15,000 to $19,999 | 0 (0.0%) | 0 (0.0%) |
| $20,000 to $24,999 | 6 (3.3%) | 0 (0.0%) |
| $25,000 to $34,999 | 4 (2.2%) | 18 (54.5%) |
| $35,000 to $49,999 | 4 (2.2%) | 6 (18.2%) |
| $50,000 to $74,999 | 21 (11.4%) | 0 (0.0%) |
| $75,000 to $99,999 | 24 (13.0%) | 0 (0.0%) |
| $100,000 to $149,999 | 30 (16.3%) | 0 (0.0%) |
| $150,000 or more | 71 (38.6%) | 9 (27.3%) |
| Total | 184 (100.0%) | 33 (100.0%) |
Monthly Housing Cost Tiers in Misquamicut
| Monthly Cost | Owner-occupied | Renter-occupied |
| Less than $300 | 0 (0.0%) | 0 (0.0%) |
| $300 to $499 | 20 (10.9%) | 0 (0.0%) |
| $500 to $799 | 15 (8.2%) | 0 (0.0%) |
| $800 to $999 | 26 (14.1%) | 0 (0.0%) |
| $1,000 to $1,499 | 37 (20.1%) | 18 (54.5%) |
| $1,500 to $1,999 | 9 (4.9%) | 0 (0.0%) |
| $2,000 to $2,499 | 29 (15.8%) | 4 (12.1%) |
| $2,500 to $2,999 | 10 (5.4%) | 0 (0.0%) |
| $3,000 or more | 38 (20.6%) | 0 (0.0%) |
| Total | 184 (100.0%) | 33 (100.0%) |
Physical Housing Characteristics in Misquamicut
Housing Structures in Misquamicut
| Structure Type | # Housing Units | % Housing Units |
| Single Unit, Detached | 212 | 97.7% |
| Single Unit, Attached | 5 | 2.3% |
| 2 Unit Apartments | 0 | 0.0% |
| 3 or 4 Unit Apartments | 0 | 0.0% |
| 5 to 9 Unit Apartments | 0 | 0.0% |
| 10 or more Apartments | 0 | 0.0% |
| Mobile Home / Other | 0 | 0.0% |
| Total | 217 | 100.0% |
Housing Structures by Occupancy in Misquamicut
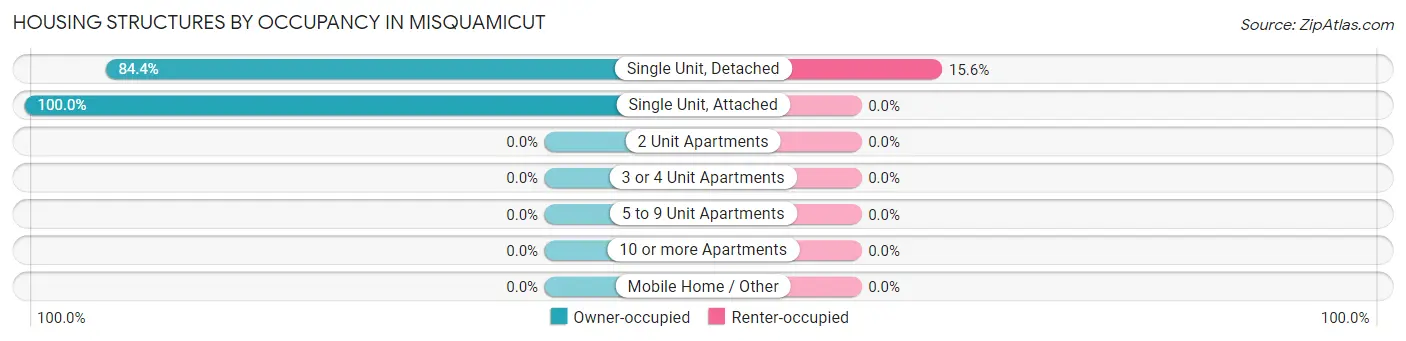
| Structure Type | Owner-occupied | Renter-occupied |
| Single Unit, Detached | 179 (84.4%) | 33 (15.6%) |
| Single Unit, Attached | 5 (100.0%) | 0 (0.0%) |
| 2 Unit Apartments | 0 (0.0%) | 0 (0.0%) |
| 3 or 4 Unit Apartments | 0 (0.0%) | 0 (0.0%) |
| 5 to 9 Unit Apartments | 0 (0.0%) | 0 (0.0%) |
| 10 or more Apartments | 0 (0.0%) | 0 (0.0%) |
| Mobile Home / Other | 0 (0.0%) | 0 (0.0%) |
| Total | 184 (84.8%) | 33 (15.2%) |
Housing Structures by Number of Rooms in Misquamicut
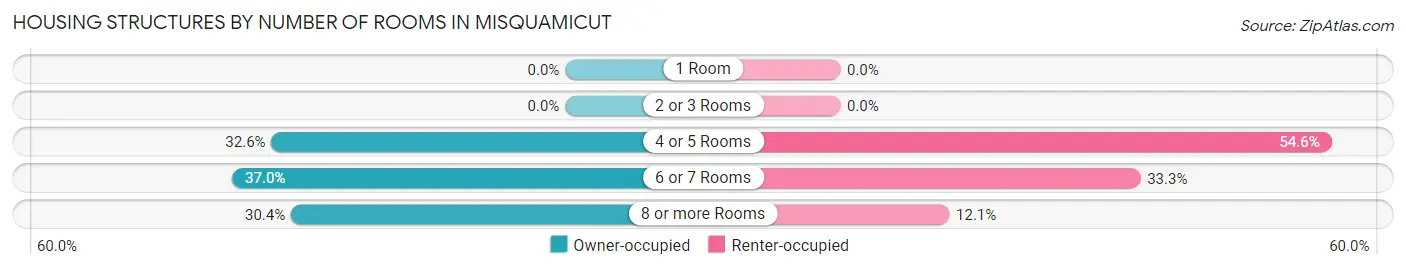
| Number of Rooms | Owner-occupied | Renter-occupied |
| 1 Room | 0 (0.0%) | 0 (0.0%) |
| 2 or 3 Rooms | 0 (0.0%) | 0 (0.0%) |
| 4 or 5 Rooms | 60 (32.6%) | 18 (54.5%) |
| 6 or 7 Rooms | 68 (37.0%) | 11 (33.3%) |
| 8 or more Rooms | 56 (30.4%) | 4 (12.1%) |
| Total | 184 (100.0%) | 33 (100.0%) |
Housing Structure by Heating Type in Misquamicut
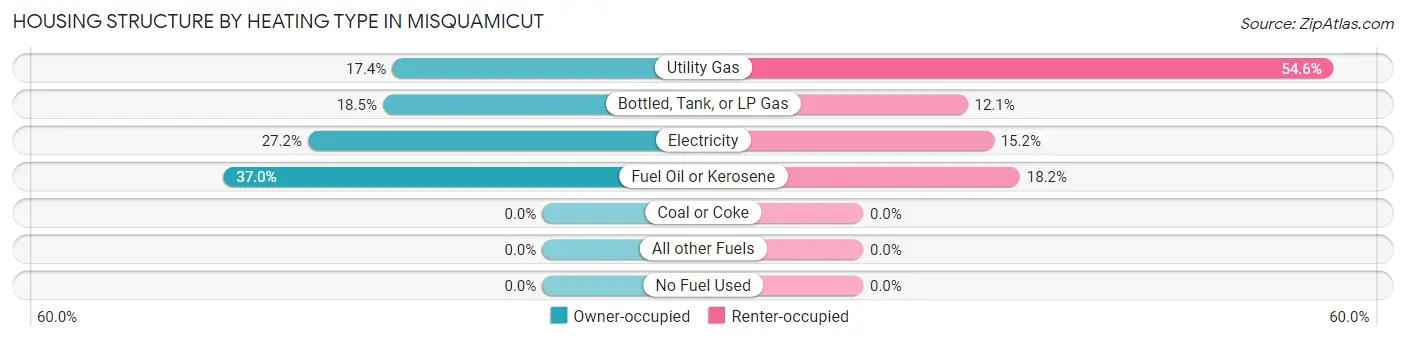
| Heating Type | Owner-occupied | Renter-occupied |
| Utility Gas | 32 (17.4%) | 18 (54.5%) |
| Bottled, Tank, or LP Gas | 34 (18.5%) | 4 (12.1%) |
| Electricity | 50 (27.2%) | 5 (15.1%) |
| Fuel Oil or Kerosene | 68 (37.0%) | 6 (18.2%) |
| Coal or Coke | 0 (0.0%) | 0 (0.0%) |
| All other Fuels | 0 (0.0%) | 0 (0.0%) |
| No Fuel Used | 0 (0.0%) | 0 (0.0%) |
| Total | 184 (100.0%) | 33 (100.0%) |
Household Vehicle Usage in Misquamicut
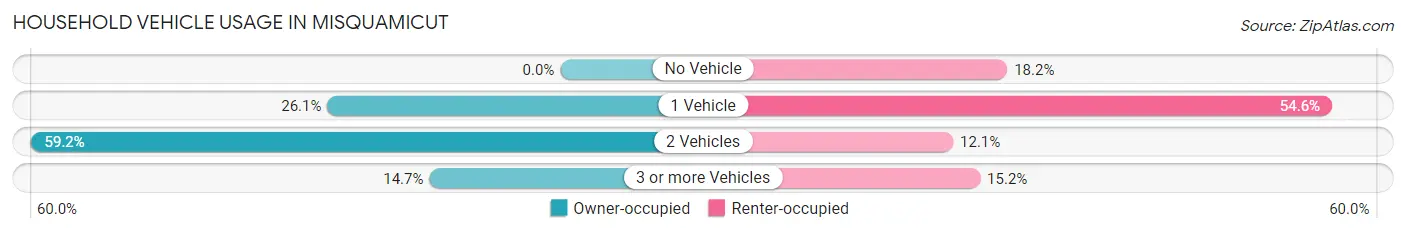
| Vehicles per Household | Owner-occupied | Renter-occupied |
| No Vehicle | 0 (0.0%) | 6 (18.2%) |
| 1 Vehicle | 48 (26.1%) | 18 (54.5%) |
| 2 Vehicles | 109 (59.2%) | 4 (12.1%) |
| 3 or more Vehicles | 27 (14.7%) | 5 (15.1%) |
| Total | 184 (100.0%) | 33 (100.0%) |
Real Estate & Mortgages in Misquamicut
Real Estate and Mortgage Overview in Misquamicut
| Characteristic | Without Mortgage | With Mortgage |
| Housing Units | 121 | 63 |
| Median Property Value | $753,900 | $875,000 |
| Median Household Income | $94,028 | $39 |
| Monthly Housing Costs | $1,045 | $32 |
| Real Estate Taxes | $6,776 | $5 |
Property Value by Mortgage Status in Misquamicut
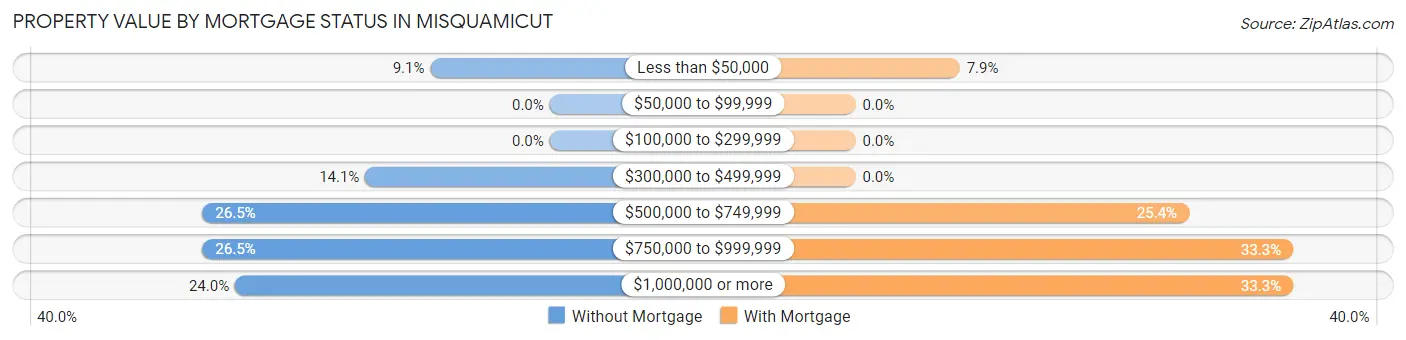
| Property Value | Without Mortgage | With Mortgage |
| Less than $50,000 | 11 (9.1%) | 5 (7.9%) |
| $50,000 to $99,999 | 0 (0.0%) | 0 (0.0%) |
| $100,000 to $299,999 | 0 (0.0%) | 0 (0.0%) |
| $300,000 to $499,999 | 17 (14.1%) | 0 (0.0%) |
| $500,000 to $749,999 | 32 (26.5%) | 16 (25.4%) |
| $750,000 to $999,999 | 32 (26.5%) | 21 (33.3%) |
| $1,000,000 or more | 29 (24.0%) | 21 (33.3%) |
| Total | 121 (100.0%) | 63 (100.0%) |
Household Income by Mortgage Status in Misquamicut
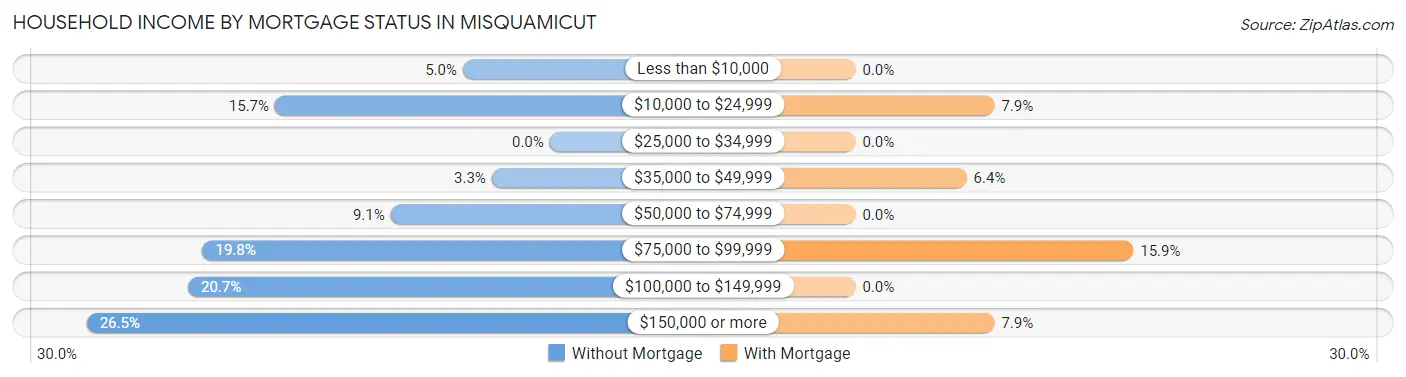
| Household Income | Without Mortgage | With Mortgage |
| Less than $10,000 | 6 (5.0%) | 0 (0.0%) |
| $10,000 to $24,999 | 19 (15.7%) | 5 (7.9%) |
| $25,000 to $34,999 | 0 (0.0%) | 0 (0.0%) |
| $35,000 to $49,999 | 4 (3.3%) | 4 (6.4%) |
| $50,000 to $74,999 | 11 (9.1%) | 0 (0.0%) |
| $75,000 to $99,999 | 24 (19.8%) | 10 (15.9%) |
| $100,000 to $149,999 | 25 (20.7%) | 0 (0.0%) |
| $150,000 or more | 32 (26.5%) | 5 (7.9%) |
| Total | 121 (100.0%) | 63 (100.0%) |
Property Value to Household Income Ratio in Misquamicut
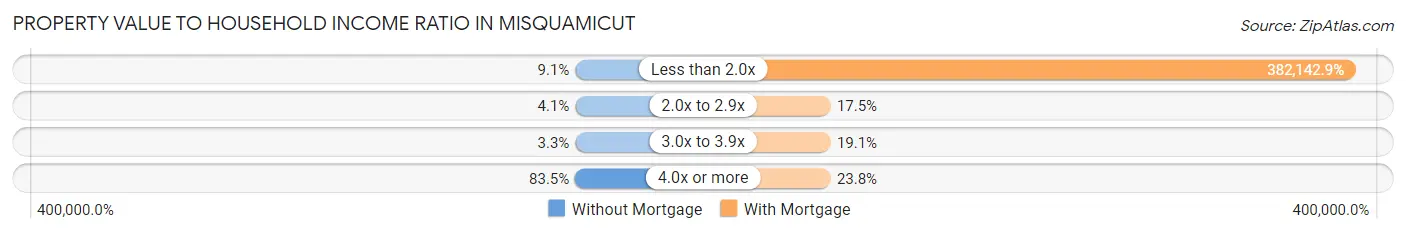
| Value-to-Income Ratio | Without Mortgage | With Mortgage |
| Less than 2.0x | 11 (9.1%) | 240,750 (382,142.9%) |
| 2.0x to 2.9x | 5 (4.1%) | 11 (17.5%) |
| 3.0x to 3.9x | 4 (3.3%) | 12 (19.1%) |
| 4.0x or more | 101 (83.5%) | 15 (23.8%) |
| Total | 121 (100.0%) | 63 (100.0%) |
Real Estate Taxes by Mortgage Status in Misquamicut
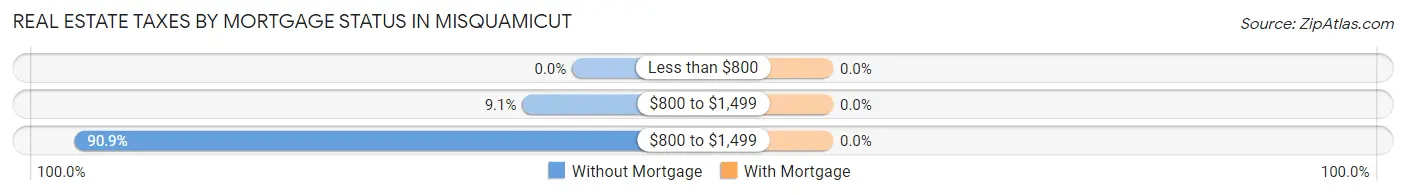
| Property Taxes | Without Mortgage | With Mortgage |
| Less than $800 | 0 (0.0%) | 0 (0.0%) |
| $800 to $1,499 | 11 (9.1%) | 0 (0.0%) |
| $800 to $1,499 | 110 (90.9%) | 0 (0.0%) |
| Total | 121 (100.0%) | 63 (100.0%) |
Health & Disability in Misquamicut
Health Insurance Coverage by Age in Misquamicut
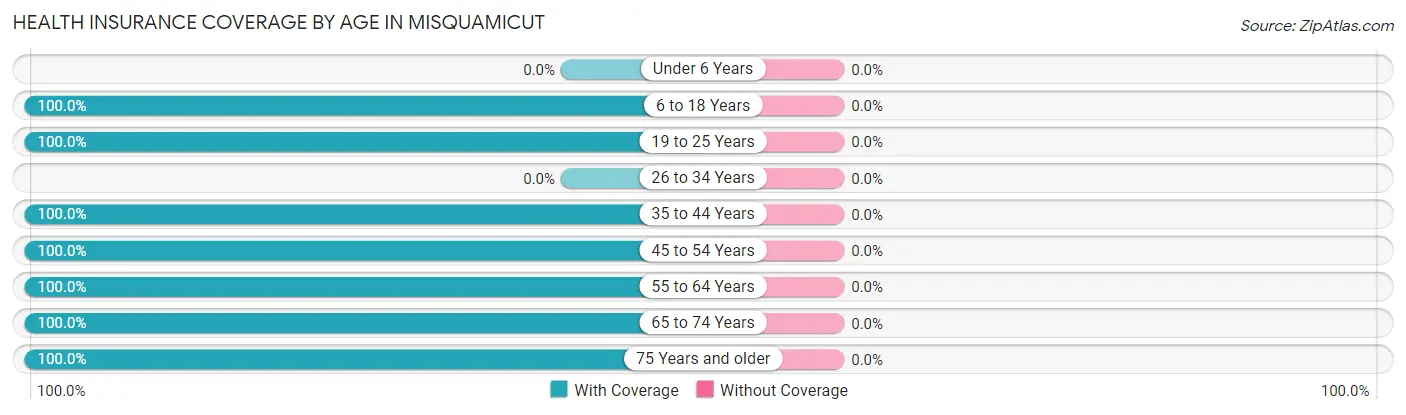
| Age Bracket | With Coverage | Without Coverage |
| Under 6 Years | 0 (0.0%) | 0 (0.0%) |
| 6 to 18 Years | 19 (100.0%) | 0 (0.0%) |
| 19 to 25 Years | 7 (100.0%) | 0 (0.0%) |
| 26 to 34 Years | 0 (0.0%) | 0 (0.0%) |
| 35 to 44 Years | 18 (100.0%) | 0 (0.0%) |
| 45 to 54 Years | 45 (100.0%) | 0 (0.0%) |
| 55 to 64 Years | 100 (100.0%) | 0 (0.0%) |
| 65 to 74 Years | 149 (100.0%) | 0 (0.0%) |
| 75 Years and older | 41 (100.0%) | 0 (0.0%) |
| Total | 379 (100.0%) | 0 (0.0%) |
Health Insurance Coverage by Citizenship Status in Misquamicut
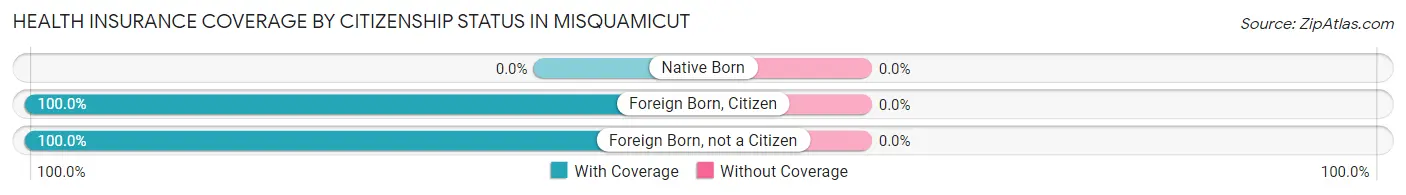
| Citizenship Status | With Coverage | Without Coverage |
| Native Born | 0 (0.0%) | 0 (0.0%) |
| Foreign Born, Citizen | 19 (100.0%) | 0 (0.0%) |
| Foreign Born, not a Citizen | 7 (100.0%) | 0 (0.0%) |
Health Insurance Coverage by Household Income in Misquamicut
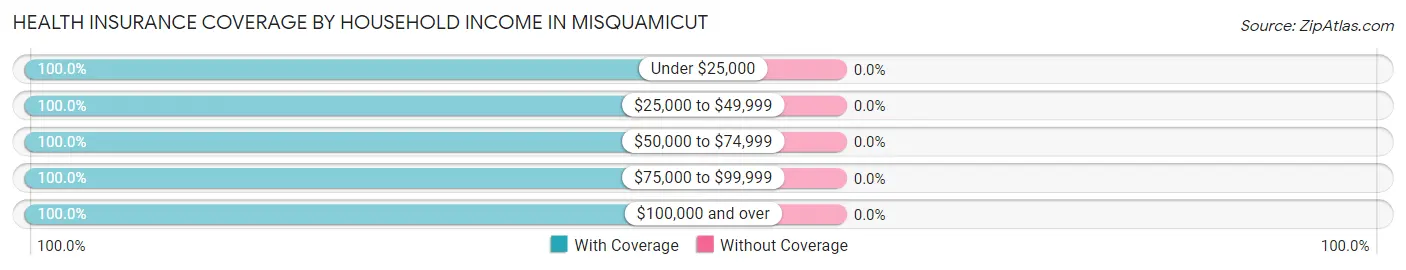
| Household Income | With Coverage | Without Coverage |
| Under $25,000 | 37 (100.0%) | 0 (0.0%) |
| $25,000 to $49,999 | 37 (100.0%) | 0 (0.0%) |
| $50,000 to $74,999 | 25 (100.0%) | 0 (0.0%) |
| $75,000 to $99,999 | 51 (100.0%) | 0 (0.0%) |
| $100,000 and over | 229 (100.0%) | 0 (0.0%) |
Public vs Private Health Insurance Coverage by Age in Misquamicut
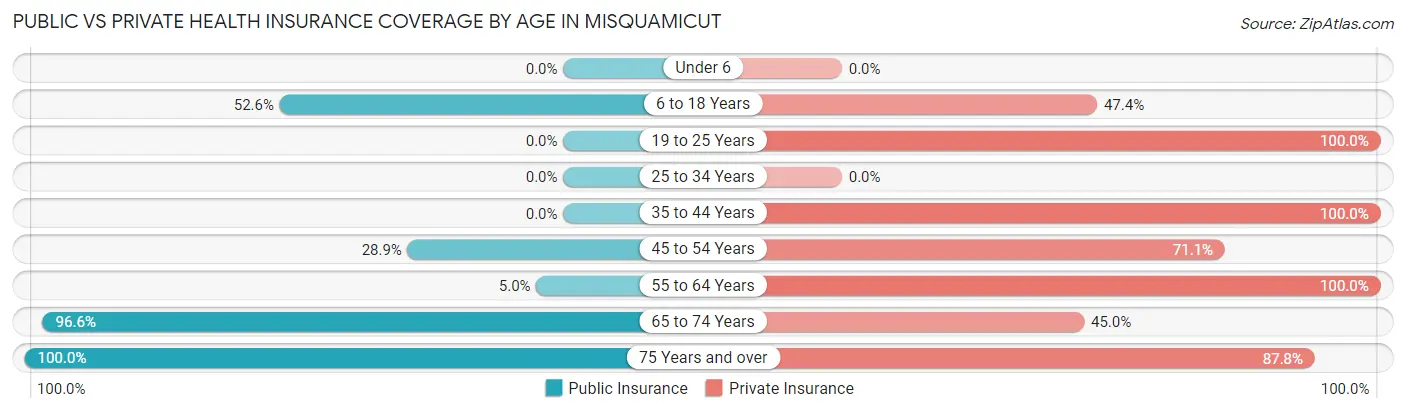
| Age Bracket | Public Insurance | Private Insurance |
| Under 6 | 0 (0.0%) | 0 (0.0%) |
| 6 to 18 Years | 10 (52.6%) | 9 (47.4%) |
| 19 to 25 Years | 0 (0.0%) | 7 (100.0%) |
| 25 to 34 Years | 0 (0.0%) | 0 (0.0%) |
| 35 to 44 Years | 0 (0.0%) | 18 (100.0%) |
| 45 to 54 Years | 13 (28.9%) | 32 (71.1%) |
| 55 to 64 Years | 5 (5.0%) | 100 (100.0%) |
| 65 to 74 Years | 144 (96.6%) | 67 (45.0%) |
| 75 Years and over | 41 (100.0%) | 36 (87.8%) |
| Total | 213 (56.2%) | 269 (71.0%) |
Disability Status by Sex by Age in Misquamicut
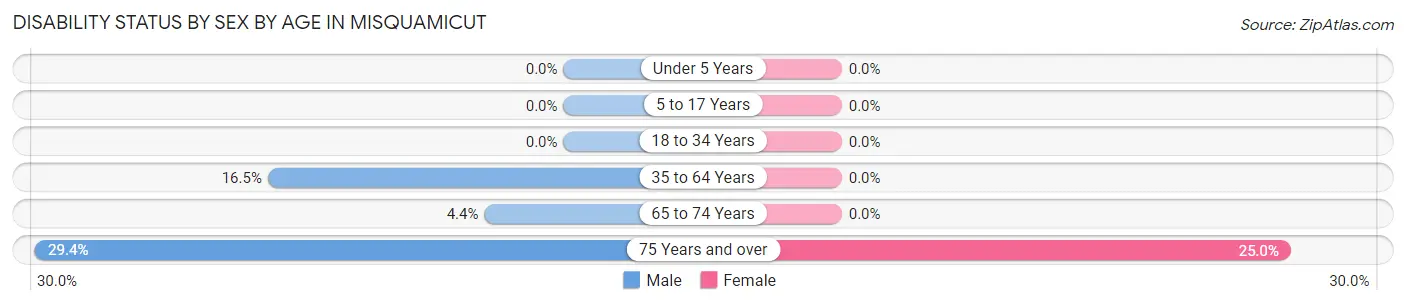
| Age Bracket | Male | Female |
| Under 5 Years | 0 (0.0%) | 0 (0.0%) |
| 5 to 17 Years | 0 (0.0%) | 0 (0.0%) |
| 18 to 34 Years | 0 (0.0%) | 0 (0.0%) |
| 35 to 64 Years | 13 (16.5%) | 0 (0.0%) |
| 65 to 74 Years | 4 (4.4%) | 0 (0.0%) |
| 75 Years and over | 5 (29.4%) | 6 (25.0%) |
Disability Class by Sex by Age in Misquamicut
Disability Class: Hearing Difficulty
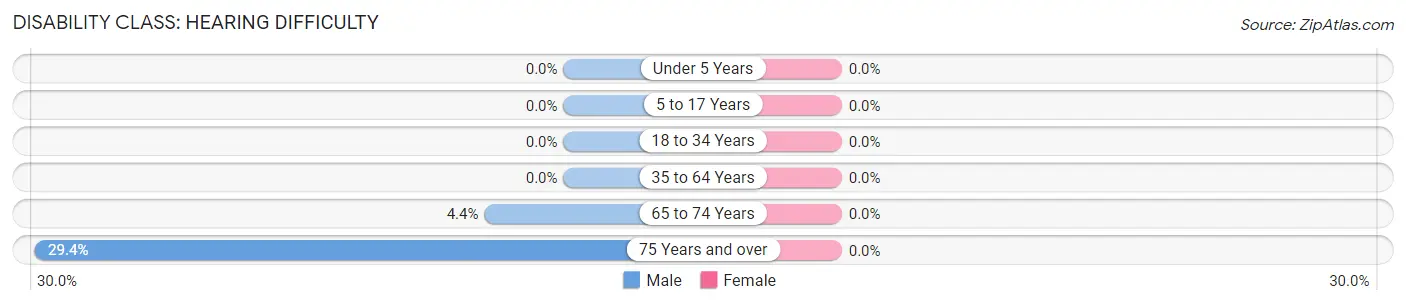
| Age Bracket | Male | Female |
| Under 5 Years | 0 (0.0%) | 0 (0.0%) |
| 5 to 17 Years | 0 (0.0%) | 0 (0.0%) |
| 18 to 34 Years | 0 (0.0%) | 0 (0.0%) |
| 35 to 64 Years | 0 (0.0%) | 0 (0.0%) |
| 65 to 74 Years | 4 (4.4%) | 0 (0.0%) |
| 75 Years and over | 5 (29.4%) | 0 (0.0%) |
Disability Class: Vision Difficulty
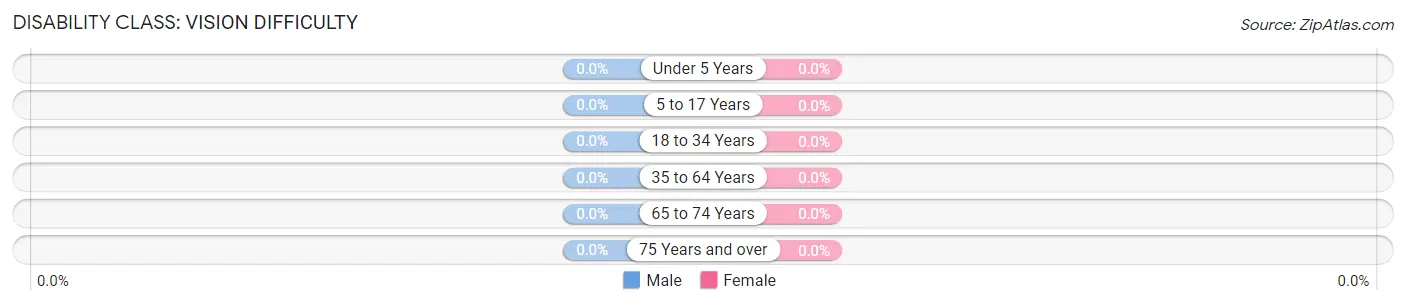
| Age Bracket | Male | Female |
| Under 5 Years | 0 (0.0%) | 0 (0.0%) |
| 5 to 17 Years | 0 (0.0%) | 0 (0.0%) |
| 18 to 34 Years | 0 (0.0%) | 0 (0.0%) |
| 35 to 64 Years | 0 (0.0%) | 0 (0.0%) |
| 65 to 74 Years | 0 (0.0%) | 0 (0.0%) |
| 75 Years and over | 0 (0.0%) | 0 (0.0%) |
Disability Class: Cognitive Difficulty
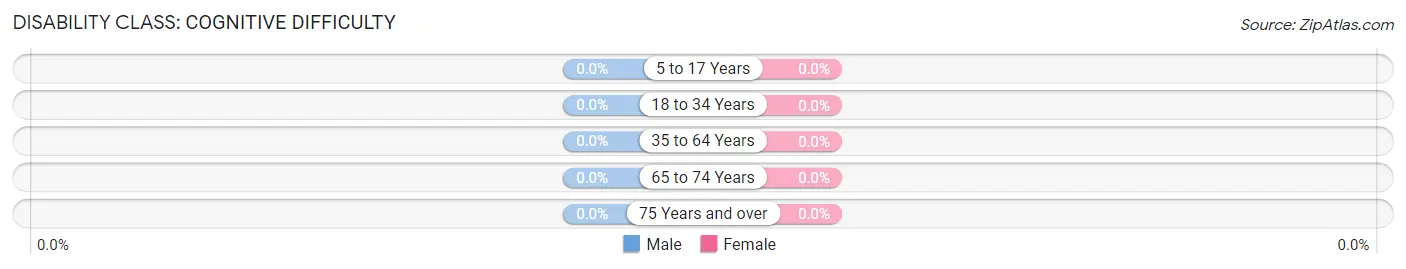
| Age Bracket | Male | Female |
| 5 to 17 Years | 0 (0.0%) | 0 (0.0%) |
| 18 to 34 Years | 0 (0.0%) | 0 (0.0%) |
| 35 to 64 Years | 0 (0.0%) | 0 (0.0%) |
| 65 to 74 Years | 0 (0.0%) | 0 (0.0%) |
| 75 Years and over | 0 (0.0%) | 0 (0.0%) |
Disability Class: Ambulatory Difficulty
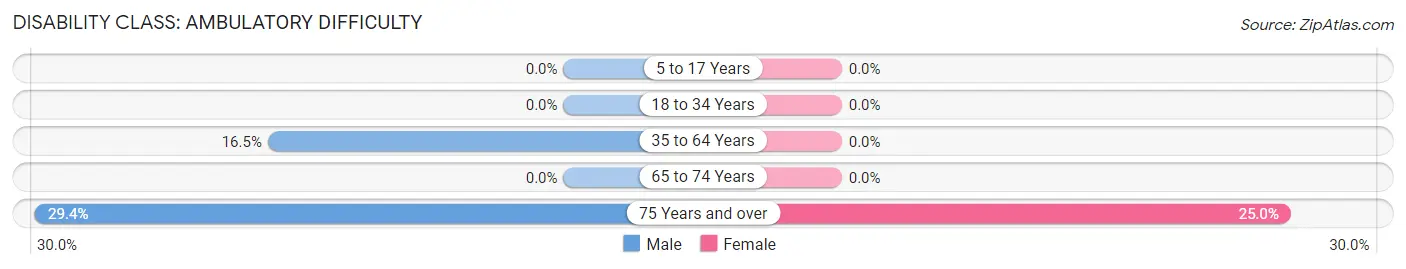
| Age Bracket | Male | Female |
| 5 to 17 Years | 0 (0.0%) | 0 (0.0%) |
| 18 to 34 Years | 0 (0.0%) | 0 (0.0%) |
| 35 to 64 Years | 13 (16.5%) | 0 (0.0%) |
| 65 to 74 Years | 0 (0.0%) | 0 (0.0%) |
| 75 Years and over | 5 (29.4%) | 6 (25.0%) |
Disability Class: Self-Care Difficulty
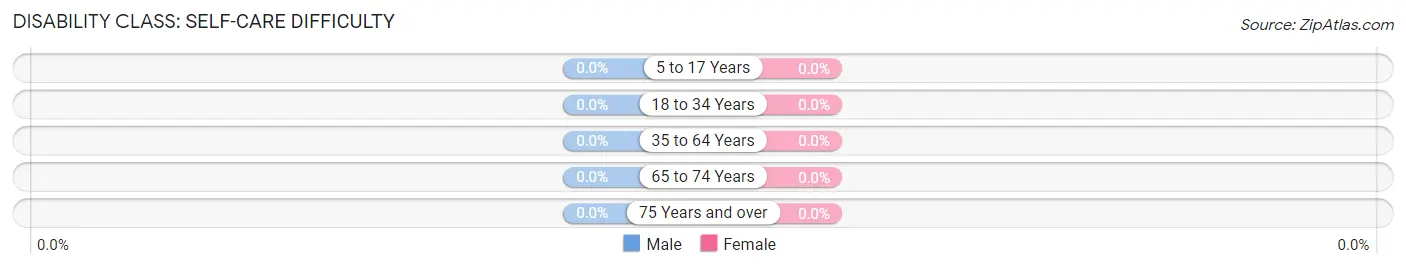
| Age Bracket | Male | Female |
| 5 to 17 Years | 0 (0.0%) | 0 (0.0%) |
| 18 to 34 Years | 0 (0.0%) | 0 (0.0%) |
| 35 to 64 Years | 0 (0.0%) | 0 (0.0%) |
| 65 to 74 Years | 0 (0.0%) | 0 (0.0%) |
| 75 Years and over | 0 (0.0%) | 0 (0.0%) |
Technology Access in Misquamicut
Computing Device Access in Misquamicut
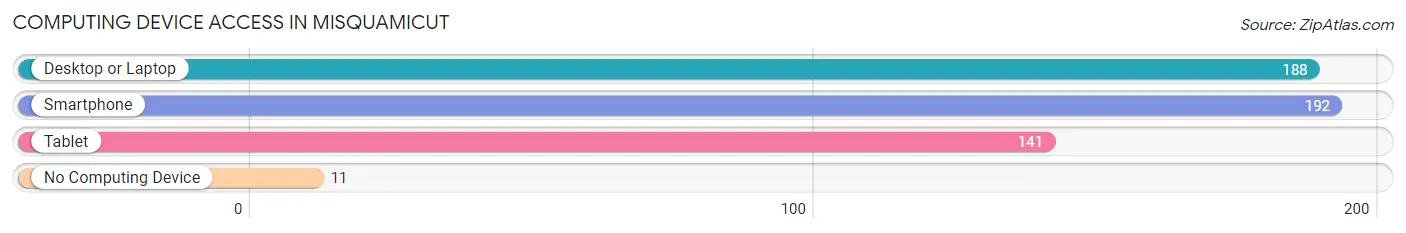
| Device Type | # Households | % Households |
| Desktop or Laptop | 188 | 86.6% |
| Smartphone | 192 | 88.5% |
| Tablet | 141 | 65.0% |
| No Computing Device | 11 | 5.1% |
| Total | 217 | 100.0% |
Internet Access in Misquamicut
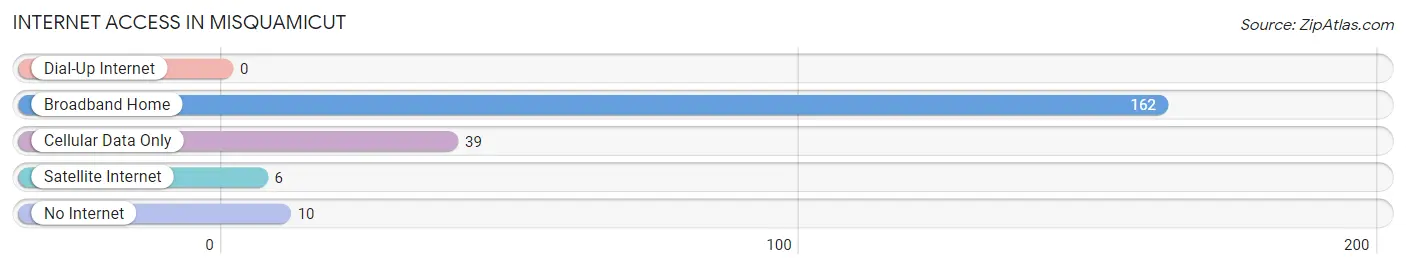
| Internet Type | # Households | % Households |
| Dial-Up Internet | 0 | 0.0% |
| Broadband Home | 162 | 74.7% |
| Cellular Data Only | 39 | 18.0% |
| Satellite Internet | 6 | 2.8% |
| No Internet | 10 | 4.6% |
| Total | 217 | 100.0% |
Misquamicut Summary
Misquamicut is a beachfront community located in the town of Westerly, Rhode Island. It is situated on the western shore of the Pawcatuck River, which separates Rhode Island from Connecticut. The area is known for its beautiful beaches, which attract visitors from all over the region.
History
The area now known as Misquamicut was originally inhabited by the Narragansett Indians. The first European settlers arrived in the area in the 1650s, and the town of Westerly was established in 1669. The area was originally known as “Misquamicut”, which is an Algonquin word meaning “red fish place”.
In the late 19th century, the area began to develop as a popular summer resort destination. The Misquamicut Beach Company was formed in 1895, and the first hotel was built in 1896. The area quickly became a popular destination for vacationers from all over the region.
Geography
Misquamicut is located on the western shore of the Pawcatuck River, which separates Rhode Island from Connecticut. The area is bordered by the Atlantic Ocean to the south and the Pawcatuck River to the north. The area is known for its beautiful beaches, which attract visitors from all over the region.
The area is also home to several parks and recreational areas, including Misquamicut State Beach, Misquamicut Beach Park, and Misquamicut Beach Club. The area is also home to several golf courses, including the Misquamicut Golf Club and the Misquamicut Country Club.
Economy
The economy of Misquamicut is largely driven by tourism. The area is home to several hotels, restaurants, and other businesses that cater to visitors. The area is also home to several marinas, which provide services to boaters and fishermen.
The area is also home to several manufacturing companies, including the Misquamicut Manufacturing Company, which produces a variety of products, including furniture, clothing, and toys.
Demographics
As of the 2010 census, the population of Misquamicut was 2,845. The population is largely white (94.3%), with small percentages of African American (2.2%), Asian (1.2%), and Hispanic (1.3%) residents. The median household income in the area is $50,945, and the median home value is $323,400.
Conclusion
Misquamicut is a beachfront community located in the town of Westerly, Rhode Island. It is situated on the western shore of the Pawcatuck River, which separates Rhode Island from Connecticut. The area is known for its beautiful beaches, which attract visitors from all over the region. The economy of Misquamicut is largely driven by tourism, and the population is largely white. The area is also home to several parks and recreational areas, as well as several manufacturing companies.
Common Questions
What is Per Capita Income in Misquamicut?
Per Capita income in Misquamicut is $109,352.
What is the Median Household income in Misquamicut?
Median Household Income in Misquamicut is $113,438.
What is Inequality or Gini Index in Misquamicut?
Inequality or Gini Index in Misquamicut is 0.56.
What is the Total Population of Misquamicut?
Total Population of Misquamicut is 379.
What is the Total Male Population of Misquamicut?
Total Male Population of Misquamicut is 196.
What is the Total Female Population of Misquamicut?
Total Female Population of Misquamicut is 183.
What is the Ratio of Males per 100 Females in Misquamicut?
There are 107.10 Males per 100 Females in Misquamicut.
What is the Ratio of Females per 100 Males in Misquamicut?
There are 93.37 Females per 100 Males in Misquamicut.
What is the Median Population Age in Misquamicut?
Median Population Age in Misquamicut is 65.0 Years.
What is the Average Family Size in Misquamicut
Average Family Size in Misquamicut is 2.2 People.
What is the Average Household Size in Misquamicut
Average Household Size in Misquamicut is 1.8 People.
How Large is the Labor Force in Misquamicut?
There are 140 People in the Labor Forcein in Misquamicut.
What is the Percentage of People in the Labor Force in Misquamicut?
38.9% of People are in the Labor Force in Misquamicut.