Scandinavian vs Japanese Receiving Food Stamps

COMPARE

Scandinavian
Race
Ancestry
AfghanAfricanAlaska NativeAlaskan AthabascanAlbanianAleutAlsatianAmericanApacheArabArapahoArgentineanArmenianAssyrian/Chaldean/SyriacAustralianAustrianBahamianBangladeshiBarbadianBasqueBelgianBelizeanBermudanBhutaneseBlackfeetBolivianBrazilianBritishBritish West IndianBulgarianBurmeseCajunCambodianCanadianCape VerdeanCarpatho RusynCelticCentral AmericanCentral American IndianCherokeeCheyenneChickasawChileanChineseChippewaChoctawColombianColvilleComancheCosta RicanCreeCreekCroatianCrowCubanCypriotCzechCzechoslovakianDanishDelawareDominicanDutchDutch West IndianEastern EuropeanEcuadorianEgyptianEnglishEstonianEthiopianEuropeanFijianFilipinoFinnishFrenchFrench American IndianFrench CanadianGermanGerman RussianGhanaianGreekGuamanian/ChamorroGuatemalanGuyaneseHaitianHmongHonduranHopiHoumaHungarianIcelanderIndian (Asian)IndonesianInupiatIranianIraqiIrishIroquoisIsraeliItalianJamaicanJordanianKenyanKiowaKoreanLaotianLatvianLebaneseLiberianLithuanianLumbeeLuxembourgerMacedonianMalaysianMalteseMarshalleseMenomineeMexicanMexican American IndianMongolianMoroccanNative HawaiianNavajoNepaleseNew ZealanderNicaraguanNigerianNorthern EuropeanNorwegianOkinawanOsageOttawaPaiutePakistaniPalestinianPanamanianParaguayanPennsylvania GermanPeruvianPimaPolishPortuguesePotawatomiPuebloPuerto RicanPuget Sound SalishRomanianRussianSalvadoranSamoanScandinavianScotch-IrishScottishSeminoleSenegaleseSerbianShoshoneSierra LeoneanSiouxSlavicSlovakSloveneSomaliSouth AfricanSouth AmericanSouth American IndianSoviet UnionSpaniardSpanishSpanish AmericanSpanish American IndianSri LankanSubsaharan AfricanSudaneseSwedishSwissSyrianTaiwaneseThaiTlingit-HaidaTohono O'OdhamTonganTrinidadian and TobagonianTsimshianTurkishU.S. Virgin IslanderUgandanUkrainianUruguayanUteVenezuelanVietnameseWelshWest IndianYakamaYaquiYugoslavianYumanYup'ikZimbabwean
Immigration
NonimmigrantsImmigrantsAfghanistanAfricaAlbaniaArgentinaArmeniaAsiaAustraliaAustriaBahamasBangladeshBarbadosBelarusBelgiumBelizeBoliviaBosnia and HerzegovinaBrazilBulgariaBurma/MyanmarCabo VerdeCambodiaCameroonCanadaCaribbeanCentral AmericaChileChinaColombiaCongoCosta RicaCroatiaCubaCzechoslovakiaDenmarkDominicaDominican RepublicEastern AfricaEastern AsiaEastern EuropeEcuadorEgyptEl SalvadorEnglandEritreaEthiopiaEuropeFijiFranceGermanyGhanaGreeceGrenadaGuatemalaGuyanaHaitiHondurasHong KongHungaryIndiaIndonesiaIranIraqIrelandIsraelItalyJamaicaJapanJordanKazakhstanKenyaKoreaKuwaitLaosLatin AmericaLatviaLebanonLiberiaLithuaniaMalaysiaMexicoMicronesiaMiddle AfricaMoldovaMoroccoNepalNetherlandsNicaraguaNigeriaNorth AmericaNorth MacedoniaNorthern AfricaNorthern EuropeNorwayOceaniaPakistanPanamaPeruPhilippinesPolandPortugalRomaniaRussiaSaudi ArabiaScotlandSenegalSerbiaSierra LeoneSingaporeSomaliaSouth AfricaSouth AmericaSouth Central AsiaSouth Eastern AsiaSouthern EuropeSpainSri LankaSt. Vincent and the GrenadinesSudanSwedenSwitzerlandSyriaTaiwanThailandTrinidad and TobagoTurkeyUgandaUkraineUruguayUzbekistanVenezuelaVietnamWest IndiesWestern AfricaWestern AsiaWestern EuropeYemenZaireZimbabweAzores
Japanese
Race
Ancestry
AfghanAfricanAlaska NativeAlaskan AthabascanAlbanianAleutAlsatianAmericanApacheArabArapahoArgentineanArmenianAssyrian/Chaldean/SyriacAustralianAustrianBahamianBangladeshiBarbadianBasqueBelgianBelizeanBermudanBhutaneseBlackfeetBolivianBrazilianBritishBritish West IndianBulgarianBurmeseCajunCambodianCanadianCape VerdeanCarpatho RusynCelticCentral AmericanCentral American IndianCherokeeCheyenneChickasawChileanChineseChippewaChoctawColombianColvilleComancheCosta RicanCreeCreekCroatianCrowCubanCypriotCzechCzechoslovakianDanishDelawareDominicanDutchDutch West IndianEastern EuropeanEcuadorianEgyptianEnglishEstonianEthiopianEuropeanFijianFilipinoFinnishFrenchFrench American IndianFrench CanadianGermanGerman RussianGhanaianGreekGuamanian/ChamorroGuatemalanGuyaneseHaitianHmongHonduranHopiHoumaHungarianIcelanderIndian (Asian)IndonesianInupiatIranianIraqiIrishIroquoisIsraeliItalianJamaicanJapaneseJordanianKenyanKiowaKoreanLaotianLatvianLebaneseLiberianLithuanianLumbeeLuxembourgerMacedonianMalaysianMalteseMarshalleseMenomineeMexicanMexican American IndianMongolianMoroccanNative HawaiianNavajoNepaleseNew ZealanderNicaraguanNigerianNorthern EuropeanNorwegianOkinawanOsageOttawaPaiutePakistaniPalestinianPanamanianParaguayanPennsylvania GermanPeruvianPimaPolishPortuguesePotawatomiPuebloPuerto RicanPuget Sound SalishRomanianRussianSalvadoranSamoanScotch-IrishScottishSeminoleSenegaleseSerbianShoshoneSierra LeoneanSiouxSlavicSlovakSloveneSomaliSouth AfricanSouth AmericanSouth American IndianSoviet UnionSpaniardSpanishSpanish AmericanSpanish American IndianSri LankanSubsaharan AfricanSudaneseSwedishSwissSyrianTaiwaneseThaiTlingit-HaidaTohono O'OdhamTonganTrinidadian and TobagonianTsimshianTurkishU.S. Virgin IslanderUgandanUkrainianUruguayanUteVenezuelanVietnameseWelshWest IndianYakamaYaquiYugoslavianYumanYup'ikZimbabwean
Immigration
NonimmigrantsImmigrantsAfghanistanAfricaAlbaniaArgentinaArmeniaAsiaAustraliaAustriaBahamasBangladeshBarbadosBelarusBelgiumBelizeBoliviaBosnia and HerzegovinaBrazilBulgariaBurma/MyanmarCabo VerdeCambodiaCameroonCanadaCaribbeanCentral AmericaChileChinaColombiaCongoCosta RicaCroatiaCubaCzechoslovakiaDenmarkDominicaDominican RepublicEastern AfricaEastern AsiaEastern EuropeEcuadorEgyptEl SalvadorEnglandEritreaEthiopiaEuropeFijiFranceGermanyGhanaGreeceGrenadaGuatemalaGuyanaHaitiHondurasHong KongHungaryIndiaIndonesiaIranIraqIrelandIsraelItalyJamaicaJapanJordanKazakhstanKenyaKoreaKuwaitLaosLatin AmericaLatviaLebanonLiberiaLithuaniaMalaysiaMexicoMicronesiaMiddle AfricaMoldovaMoroccoNepalNetherlandsNicaraguaNigeriaNorth AmericaNorth MacedoniaNorthern AfricaNorthern EuropeNorwayOceaniaPakistanPanamaPeruPhilippinesPolandPortugalRomaniaRussiaSaudi ArabiaScotlandSenegalSerbiaSierra LeoneSingaporeSomaliaSouth AfricaSouth AmericaSouth Central AsiaSouth Eastern AsiaSouthern EuropeSpainSri LankaSt. Vincent and the GrenadinesSudanSwedenSwitzerlandSyriaTaiwanThailandTrinidad and TobagoTurkeyUgandaUkraineUruguayUzbekistanVenezuelaVietnamWest IndiesWestern AfricaWestern AsiaWestern EuropeYemenZaireZimbabweAzores
Receiving Food Stamps
Income
Poverty
Unemployment
Labor Participation
Family Structure
Vehicle Availability
Education Level
Disability

Receiving Food Stamps Comparison

Scandinavians

Japanese

Exceptional
Tragic
9.7%
RECEIVING FOOD STAMPS
99.2/ 100
METRIC RATING
58th/ 347
METRIC RANK
14.1%
RECEIVING FOOD STAMPS
0.3/ 100
METRIC RATING
256th/ 347
METRIC RANK

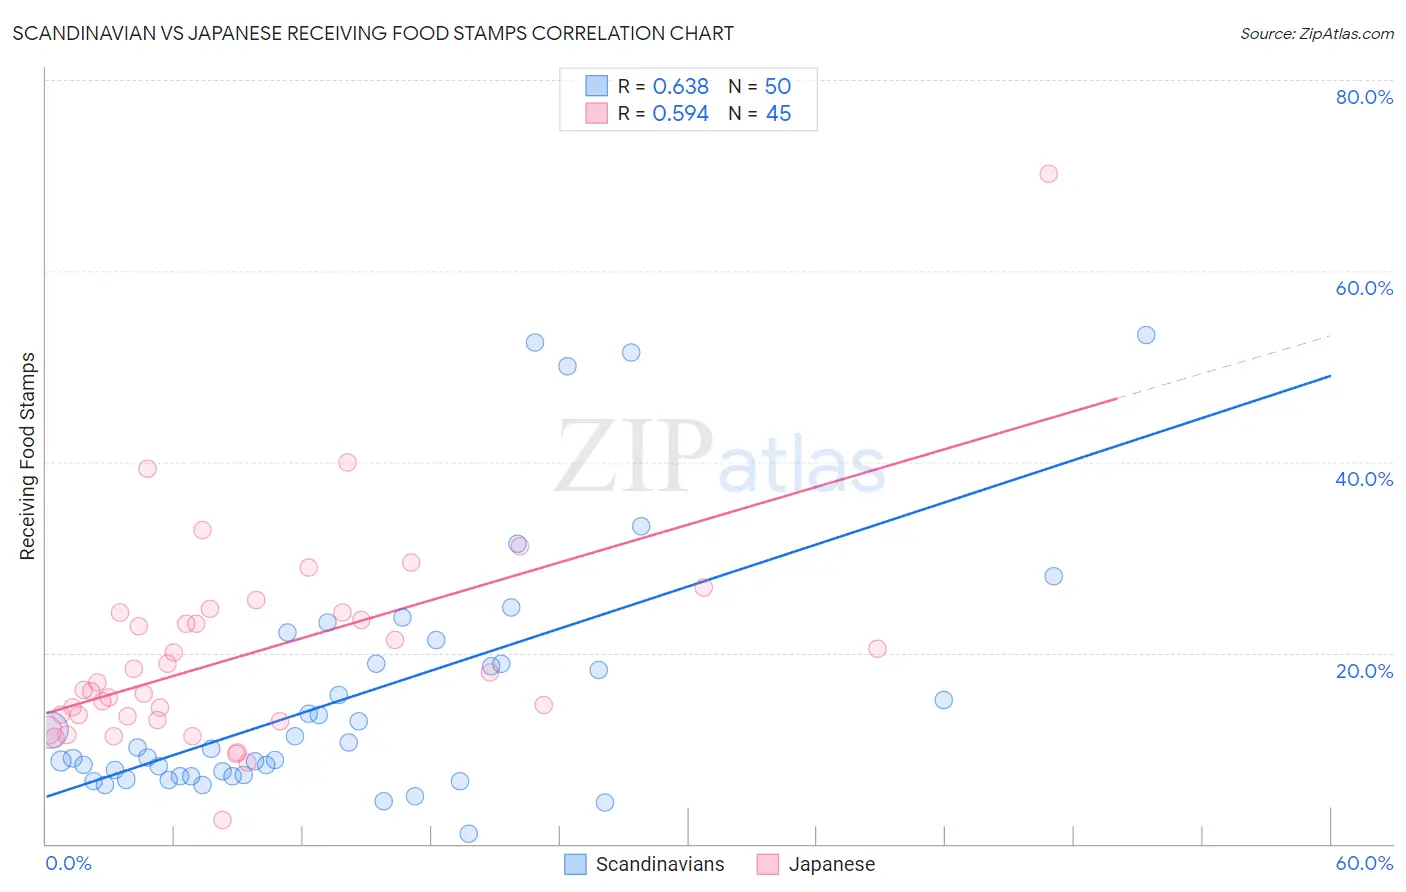
Scandinavian vs Japanese Receiving Food Stamps Correlation Chart

The statistical analysis conducted on geographies consisting of 470,816,598 people shows a significant positive correlation between the proportion of Scandinavians and percentage of population receiving government assistance and/or food stamps in the United States with a correlation coefficient (R) of 0.638 and weighted average of 9.7%. Similarly, the statistical analysis conducted on geographies consisting of 248,870,971 people shows a substantial positive correlation between the proportion of Japanese and percentage of population receiving government assistance and/or food stamps in the United States with a correlation coefficient (R) of 0.594 and weighted average of 14.1%, a difference of 44.8%.
Scandinavian vs Japanese Receiving Food Stamps

Receiving Food Stamps Correlation Summary

MeasurementScandinavianJapanese
Minimum1.1%2.5%
Maximum53.3%70.2%
Range52.2%67.7%
Mean15.6%19.9%
Median10.0%16.8%
Interquartile 25% (IQ1)7.1%13.1%
Interquartile 75% (IQ3)18.9%24.2%
Interquartile Range (IQR)11.8%11.1%
Standard Deviation (Sample)13.0%11.1%
Standard Deviation (Population)12.9%10.9%

Similar Demographics by Receiving Food Stamps

Demographics Similar to Scandinavians by Receiving Food Stamps

In terms of receiving food stamps, the demographic groups most similar to Scandinavians are British (9.7%, a difference of 0.030%), Greek (9.7%, a difference of 0.060%), German (9.7%, a difference of 0.13%), Immigrants from Canada (9.7%, a difference of 0.17%), and English (9.8%, a difference of 0.27%).
DemographicsRating | RankReceiving Food Stamps
Asians
99.3
/100
|
#51
Exceptional
9.7%
Immigrants | South Africa
99.3
/100
|
#52
Exceptional
9.7%
Tongans
99.3
/100
|
#53
Exceptional
9.7%
Swiss
99.3
/100
|
#54
Exceptional
9.7%
Immigrants | Switzerland
99.3
/100
|
#55
Exceptional
9.7%
Immigrants | Canada
99.3
/100
|
#56
Exceptional
9.7%
Greeks
99.3
/100
|
#57
Exceptional
9.7%
Scandinavians
99.2
/100
|
#58
Exceptional
9.7%
British
99.2
/100
|
#59
Exceptional
9.7%
Germans
99.2
/100
|
#60
Exceptional
9.7%
English
99.2
/100
|
#61
Exceptional
9.8%
Immigrants | Bulgaria
99.2
/100
|
#62
Exceptional
9.8%
Chinese
99.2
/100
|
#63
Exceptional
9.8%
Immigrants | North America
99.2
/100
|
#64
Exceptional
9.8%
Immigrants | Turkey
99.1
/100
|
#65
Exceptional
9.8%

Demographics Similar to Japanese by Receiving Food Stamps

In terms of receiving food stamps, the demographic groups most similar to Japanese are Subsaharan African (14.1%, a difference of 0.020%), Marshallese (14.1%, a difference of 0.030%), Arapaho (14.1%, a difference of 0.10%), Immigrants from Ghana (14.1%, a difference of 0.18%), and Creek (14.1%, a difference of 0.30%).
DemographicsRating | RankReceiving Food Stamps
Indonesians
0.6
/100
|
#249
Tragic
13.9%
Immigrants | Cambodia
0.5
/100
|
#250
Tragic
13.9%
Yaqui
0.5
/100
|
#251
Tragic
13.9%
Ghanaians
0.5
/100
|
#252
Tragic
14.0%
Spanish Americans
0.4
/100
|
#253
Tragic
14.0%
Marshallese
0.3
/100
|
#254
Tragic
14.1%
Sub-Saharan Africans
0.3
/100
|
#255
Tragic
14.1%
Japanese
0.3
/100
|
#256
Tragic
14.1%
Arapaho
0.3
/100
|
#257
Tragic
14.1%
Immigrants | Ghana
0.3
/100
|
#258
Tragic
14.1%
Creek
0.3
/100
|
#259
Tragic
14.1%
Central Americans
0.3
/100
|
#260
Tragic
14.1%
Immigrants | Congo
0.3
/100
|
#261
Tragic
14.1%
Paiute
0.2
/100
|
#262
Tragic
14.3%
Immigrants | Portugal
0.2
/100
|
#263
Tragic
14.3%