Scandinavian vs Bermudan Receiving Food Stamps
COMPARE
Scandinavian
Bermudan
Receiving Food Stamps
Receiving Food Stamps Comparison
Scandinavians
Bermudans
9.7%
RECEIVING FOOD STAMPS
99.2/ 100
METRIC RATING
58th/ 347
METRIC RANK
13.0%
RECEIVING FOOD STAMPS
4.8/ 100
METRIC RATING
221st/ 347
METRIC RANK
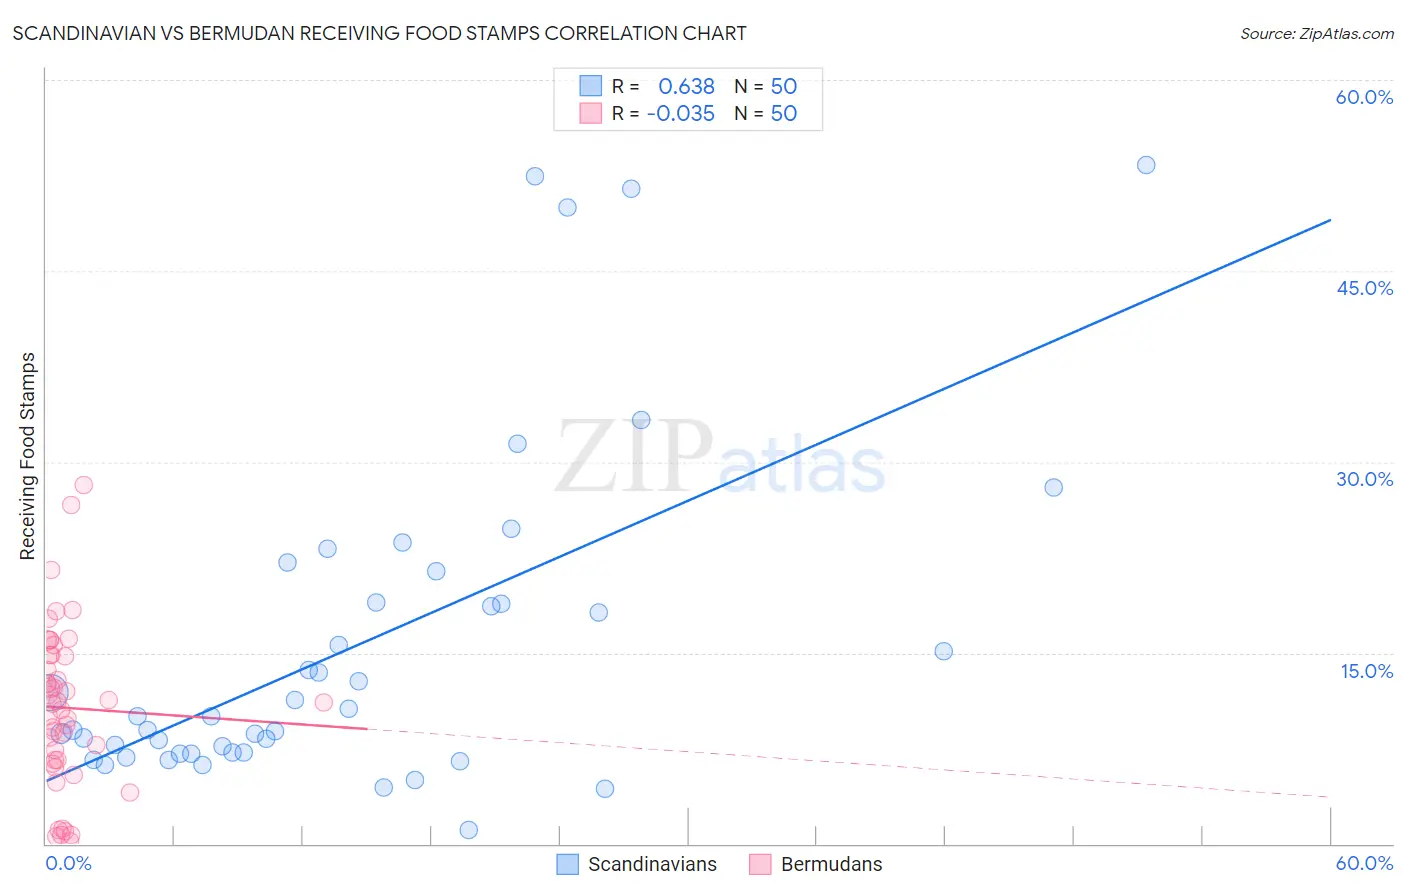
Scandinavian vs Bermudan Receiving Food Stamps Correlation Chart
The statistical analysis conducted on geographies consisting of 470,816,598 people shows a significant positive correlation between the proportion of Scandinavians and percentage of population receiving government assistance and/or food stamps in the United States with a correlation coefficient (R) of 0.638 and weighted average of 9.7%. Similarly, the statistical analysis conducted on geographies consisting of 55,651,694 people shows no correlation between the proportion of Bermudans and percentage of population receiving government assistance and/or food stamps in the United States with a correlation coefficient (R) of -0.035 and weighted average of 13.0%, a difference of 33.2%.
Receiving Food Stamps Correlation Summary
| Measurement | Scandinavian | Bermudan |
| Minimum | 1.1% | 0.20% |
| Maximum | 53.3% | 28.2% |
| Range | 52.2% | 28.0% |
| Mean | 15.6% | 10.7% |
| Median | 10.0% | 11.1% |
| Interquartile 25% (IQ1) | 7.1% | 6.6% |
| Interquartile 75% (IQ3) | 18.9% | 14.8% |
| Interquartile Range (IQR) | 11.8% | 8.2% |
| Standard Deviation (Sample) | 13.0% | 6.3% |
| Standard Deviation (Population) | 12.9% | 6.3% |
Similar Demographics by Receiving Food Stamps
Demographics Similar to Scandinavians by Receiving Food Stamps
In terms of receiving food stamps, the demographic groups most similar to Scandinavians are British (9.7%, a difference of 0.030%), Greek (9.7%, a difference of 0.060%), German (9.7%, a difference of 0.13%), Immigrants from Canada (9.7%, a difference of 0.17%), and English (9.8%, a difference of 0.27%).
| Demographics | Rating | Rank | Receiving Food Stamps |
| Asians | 99.3 /100 | #51 | Exceptional 9.7% |
| Immigrants | South Africa | 99.3 /100 | #52 | Exceptional 9.7% |
| Tongans | 99.3 /100 | #53 | Exceptional 9.7% |
| Swiss | 99.3 /100 | #54 | Exceptional 9.7% |
| Immigrants | Switzerland | 99.3 /100 | #55 | Exceptional 9.7% |
| Immigrants | Canada | 99.3 /100 | #56 | Exceptional 9.7% |
| Greeks | 99.3 /100 | #57 | Exceptional 9.7% |
| Scandinavians | 99.2 /100 | #58 | Exceptional 9.7% |
| British | 99.2 /100 | #59 | Exceptional 9.7% |
| Germans | 99.2 /100 | #60 | Exceptional 9.7% |
| English | 99.2 /100 | #61 | Exceptional 9.8% |
| Immigrants | Bulgaria | 99.2 /100 | #62 | Exceptional 9.8% |
| Chinese | 99.2 /100 | #63 | Exceptional 9.8% |
| Immigrants | North America | 99.2 /100 | #64 | Exceptional 9.8% |
| Immigrants | Turkey | 99.1 /100 | #65 | Exceptional 9.8% |
Demographics Similar to Bermudans by Receiving Food Stamps
In terms of receiving food stamps, the demographic groups most similar to Bermudans are Immigrants (13.0%, a difference of 0.26%), Immigrants from Albania (13.0%, a difference of 0.30%), Immigrants from Colombia (12.9%, a difference of 0.32%), Immigrants from Middle Africa (12.9%, a difference of 0.36%), and Hawaiian (12.9%, a difference of 0.37%).
| Demographics | Rating | Rank | Receiving Food Stamps |
| Immigrants | Africa | 7.6 /100 | #214 | Tragic 12.8% |
| Native Hawaiians | 6.7 /100 | #215 | Tragic 12.8% |
| Immigrants | South America | 6.5 /100 | #216 | Tragic 12.8% |
| Immigrants | Burma/Myanmar | 6.0 /100 | #217 | Tragic 12.9% |
| Hawaiians | 5.4 /100 | #218 | Tragic 12.9% |
| Immigrants | Middle Africa | 5.4 /100 | #219 | Tragic 12.9% |
| Immigrants | Colombia | 5.3 /100 | #220 | Tragic 12.9% |
| Bermudans | 4.8 /100 | #221 | Tragic 13.0% |
| Immigrants | Immigrants | 4.4 /100 | #222 | Tragic 13.0% |
| Immigrants | Albania | 4.4 /100 | #223 | Tragic 13.0% |
| Immigrants | Armenia | 4.3 /100 | #224 | Tragic 13.0% |
| Fijians | 4.3 /100 | #225 | Tragic 13.0% |
| Chickasaw | 3.6 /100 | #226 | Tragic 13.1% |
| Nigerians | 3.5 /100 | #227 | Tragic 13.1% |
| Panamanians | 3.5 /100 | #228 | Tragic 13.1% |