Scandinavian vs Yuman Receiving Food Stamps
COMPARE
Scandinavian
Yuman
Receiving Food Stamps
Receiving Food Stamps Comparison
Scandinavians
Yuman
9.7%
RECEIVING FOOD STAMPS
99.2/ 100
METRIC RATING
58th/ 347
METRIC RANK
20.2%
RECEIVING FOOD STAMPS
0.0/ 100
METRIC RATING
334th/ 347
METRIC RANK
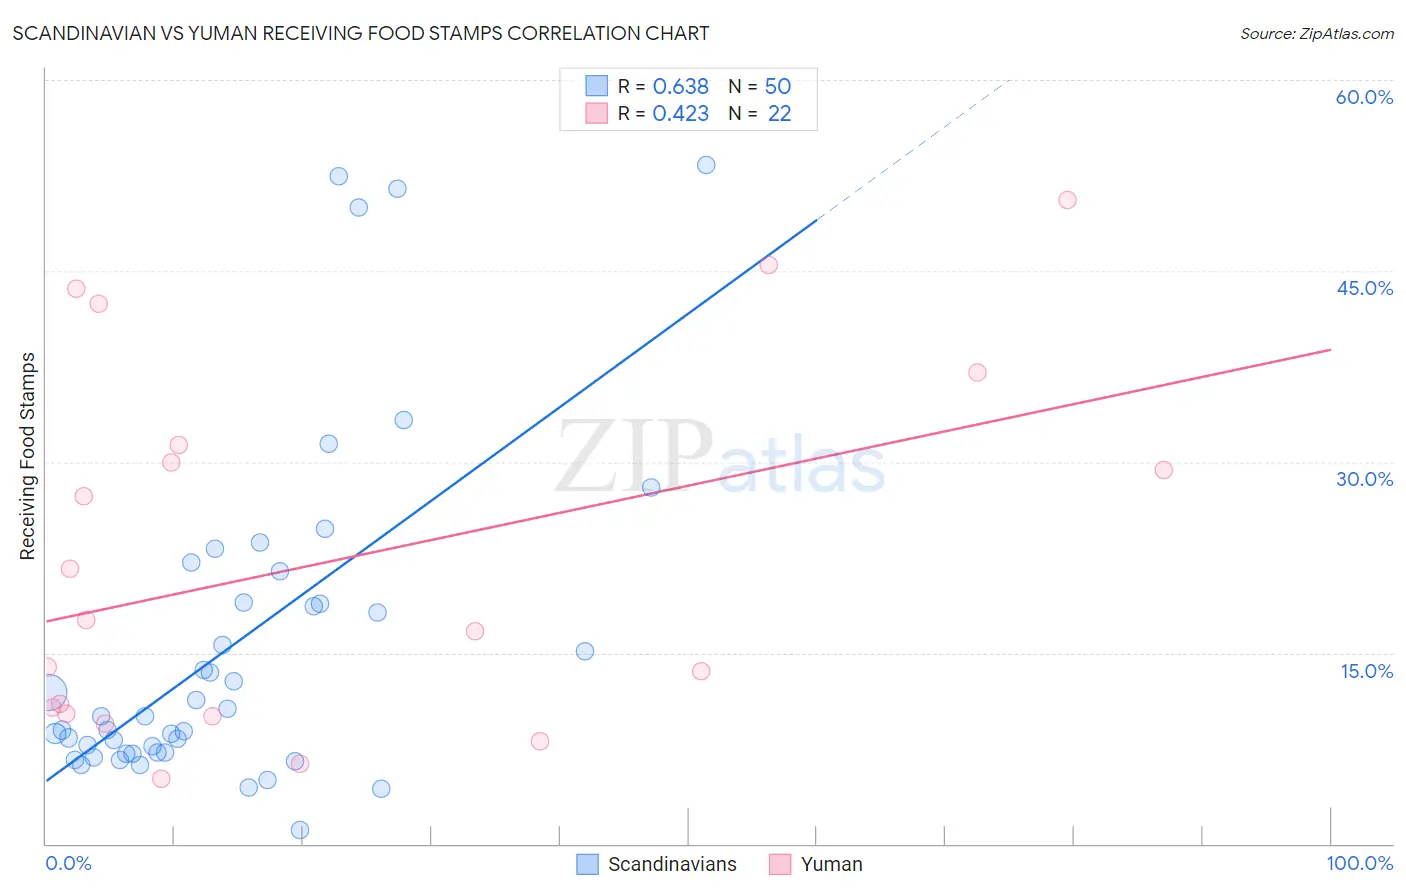
Scandinavian vs Yuman Receiving Food Stamps Correlation Chart
The statistical analysis conducted on geographies consisting of 470,816,598 people shows a significant positive correlation between the proportion of Scandinavians and percentage of population receiving government assistance and/or food stamps in the United States with a correlation coefficient (R) of 0.638 and weighted average of 9.7%. Similarly, the statistical analysis conducted on geographies consisting of 40,663,437 people shows a moderate positive correlation between the proportion of Yuman and percentage of population receiving government assistance and/or food stamps in the United States with a correlation coefficient (R) of 0.423 and weighted average of 20.2%, a difference of 107.8%.
Receiving Food Stamps Correlation Summary
| Measurement | Scandinavian | Yuman |
| Minimum | 1.1% | 5.1% |
| Maximum | 53.3% | 50.6% |
| Range | 52.2% | 45.5% |
| Mean | 15.6% | 22.3% |
| Median | 10.0% | 17.1% |
| Interquartile 25% (IQ1) | 7.1% | 10.2% |
| Interquartile 75% (IQ3) | 18.9% | 31.3% |
| Interquartile Range (IQR) | 11.8% | 21.1% |
| Standard Deviation (Sample) | 13.0% | 14.3% |
| Standard Deviation (Population) | 12.9% | 14.0% |
Similar Demographics by Receiving Food Stamps
Demographics Similar to Scandinavians by Receiving Food Stamps
In terms of receiving food stamps, the demographic groups most similar to Scandinavians are British (9.7%, a difference of 0.030%), Greek (9.7%, a difference of 0.060%), German (9.7%, a difference of 0.13%), Immigrants from Canada (9.7%, a difference of 0.17%), and English (9.8%, a difference of 0.27%).
| Demographics | Rating | Rank | Receiving Food Stamps |
| Asians | 99.3 /100 | #51 | Exceptional 9.7% |
| Immigrants | South Africa | 99.3 /100 | #52 | Exceptional 9.7% |
| Tongans | 99.3 /100 | #53 | Exceptional 9.7% |
| Swiss | 99.3 /100 | #54 | Exceptional 9.7% |
| Immigrants | Switzerland | 99.3 /100 | #55 | Exceptional 9.7% |
| Immigrants | Canada | 99.3 /100 | #56 | Exceptional 9.7% |
| Greeks | 99.3 /100 | #57 | Exceptional 9.7% |
| Scandinavians | 99.2 /100 | #58 | Exceptional 9.7% |
| British | 99.2 /100 | #59 | Exceptional 9.7% |
| Germans | 99.2 /100 | #60 | Exceptional 9.7% |
| English | 99.2 /100 | #61 | Exceptional 9.8% |
| Immigrants | Bulgaria | 99.2 /100 | #62 | Exceptional 9.8% |
| Chinese | 99.2 /100 | #63 | Exceptional 9.8% |
| Immigrants | North America | 99.2 /100 | #64 | Exceptional 9.8% |
| Immigrants | Turkey | 99.1 /100 | #65 | Exceptional 9.8% |
Demographics Similar to Yuman by Receiving Food Stamps
In terms of receiving food stamps, the demographic groups most similar to Yuman are Inupiat (20.1%, a difference of 0.86%), Pueblo (19.9%, a difference of 1.6%), Immigrants from Cuba (20.8%, a difference of 2.9%), Immigrants from Caribbean (19.6%, a difference of 3.1%), and Navajo (21.1%, a difference of 4.1%).
| Demographics | Rating | Rank | Receiving Food Stamps |
| Apache | 0.0 /100 | #327 | Tragic 18.3% |
| Colville | 0.0 /100 | #328 | Tragic 18.3% |
| Immigrants | Dominica | 0.0 /100 | #329 | Tragic 18.4% |
| Pima | 0.0 /100 | #330 | Tragic 19.0% |
| Immigrants | Caribbean | 0.0 /100 | #331 | Tragic 19.6% |
| Pueblo | 0.0 /100 | #332 | Tragic 19.9% |
| Inupiat | 0.0 /100 | #333 | Tragic 20.1% |
| Yuman | 0.0 /100 | #334 | Tragic 20.2% |
| Immigrants | Cuba | 0.0 /100 | #335 | Tragic 20.8% |
| Navajo | 0.0 /100 | #336 | Tragic 21.1% |
| Cape Verdeans | 0.0 /100 | #337 | Tragic 21.1% |
| Dominicans | 0.0 /100 | #338 | Tragic 21.4% |
| Yakama | 0.0 /100 | #339 | Tragic 21.4% |
| Tohono O'odham | 0.0 /100 | #340 | Tragic 21.5% |
| Hopi | 0.0 /100 | #341 | Tragic 21.6% |