Zip Codes with the Highest Percentage of Households with Income Below $10,000 in Pahrump, NV
RELATED REPORTS & OPTIONS
Household Income | $0-10k
Pahrump
Compare Zip Codes
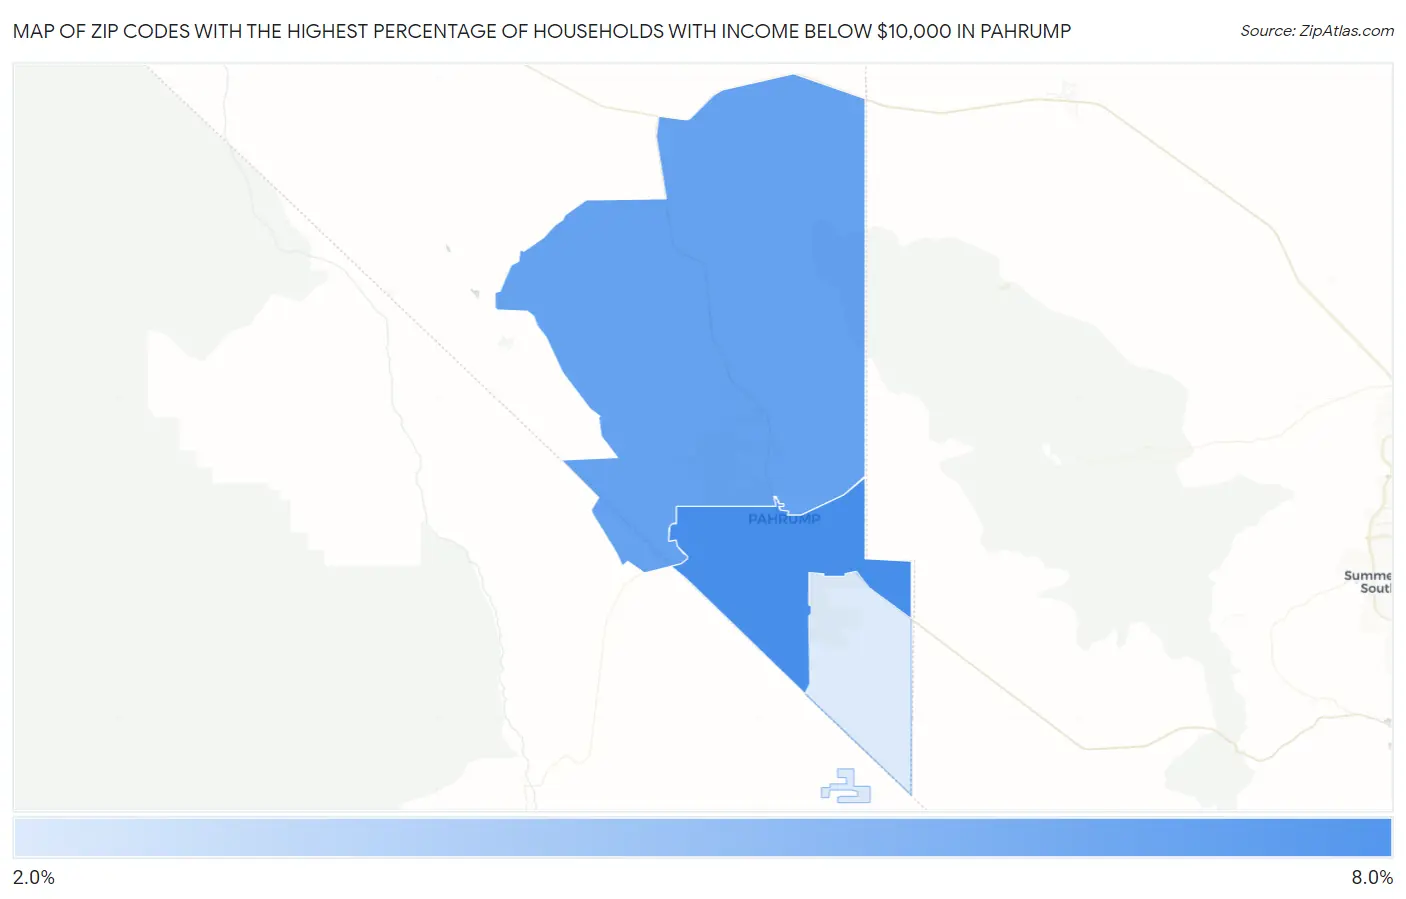
Map of Zip Codes with the Highest Percentage of Households with Income Below $10,000 in Pahrump
2.7%
7.7%
Zip Codes with the Highest Percentage of Households with Income Below $10,000 in Pahrump, NV
| Zip Code | Households with Income < $10k | vs State | vs National | |
| 1. | 89048 | 7.7% | 5.4%(+2.30)#35 | 4.9%(+2.80)#5,942 |
| 2. | 89060 | 6.7% | 5.4%(+1.30)#45 | 4.9%(+1.80)#7,566 |
| 3. | 89061 | 2.7% | 5.4%(-2.70)#120 | 4.9%(-2.20)#20,821 |
1
Common Questions
What are the Top Zip Codes with the Highest Percentage of Households with Income Below $10,000 in Pahrump, NV?
Top Zip Codes with the Highest Percentage of Households with Income Below $10,000 in Pahrump, NV are:
What zip code has the Highest Percentage of Households with Income Below $10,000 in Pahrump, NV?
89048 has the Highest Percentage of Households with Income Below $10,000 in Pahrump, NV with 7.7%.
What is the Percentage of Households with Income Below $10,000 in Pahrump, NV?
Percentage of Households with Income Below $10,000 in Pahrump is 6.5%.
What is the Percentage of Households with Income Below $10,000 in Nevada?
Percentage of Households with Income Below $10,000 in Nevada is 5.4%.
What is the Percentage of Households with Income Below $10,000 in the United States?
Percentage of Households with Income Below $10,000 in the United States is 4.9%.