Zip Codes with the Highest Percentage of Population Employed in Legal Services & Support in Pahrump, NV
RELATED REPORTS & OPTIONS
Legal Services & Support
Pahrump
Compare Zip Codes
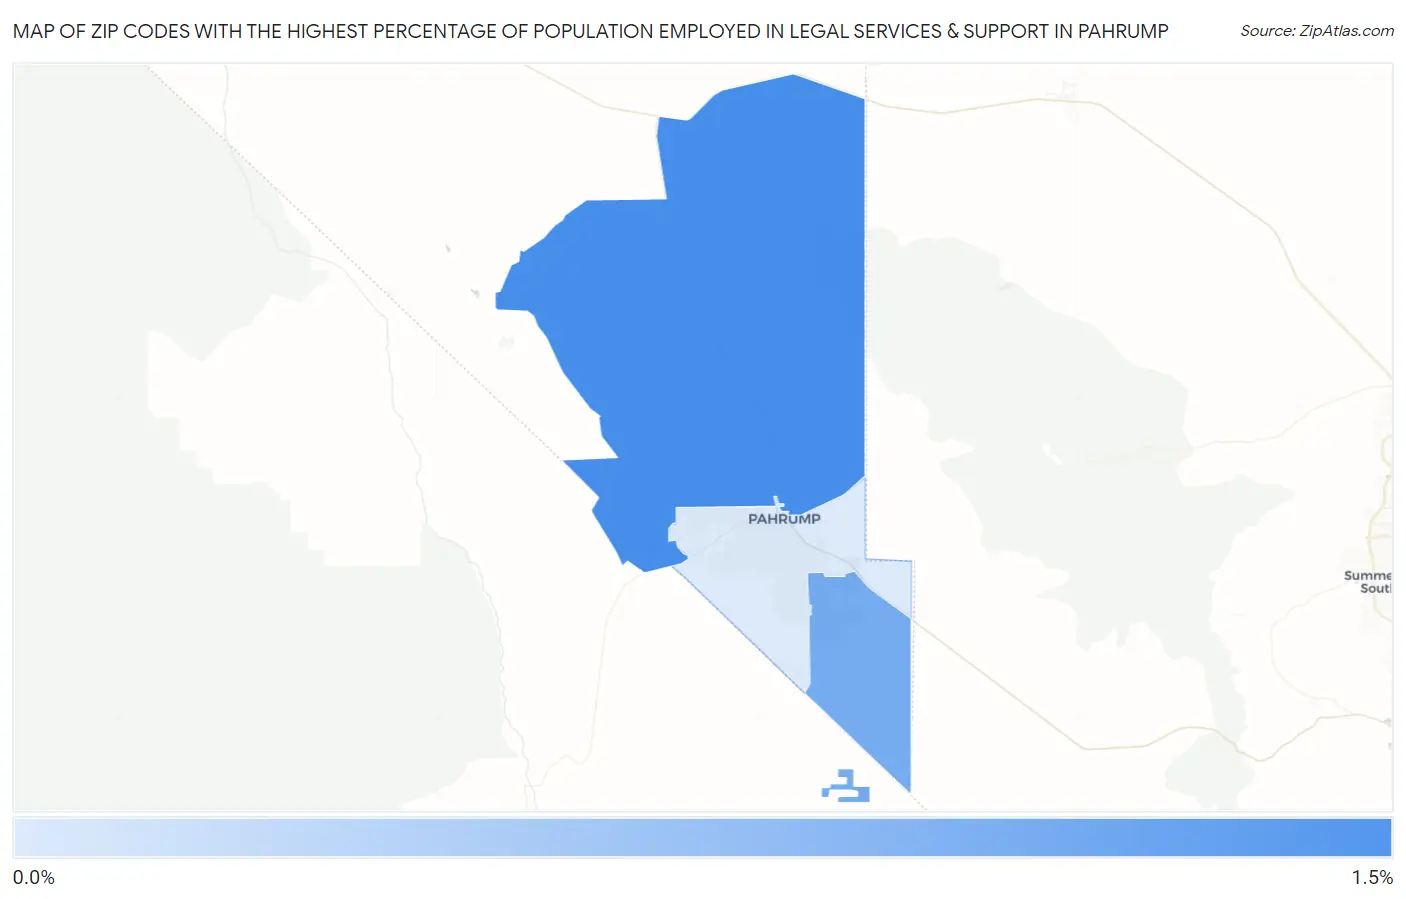
Map of Zip Codes with the Highest Percentage of Population Employed in Legal Services & Support in Pahrump
0.30%
1.3%
Zip Codes with the Highest Percentage of Population Employed in Legal Services & Support in Pahrump, NV
| Zip Code | % Employed | vs State | vs National | |
| 1. | 89060 | 1.3% | 0.99%(+0.331)#36 | 1.2%(+0.133)#5,853 |
| 2. | 89061 | 1.0% | 0.99%(+0.013)#50 | 1.2%(-0.184)#7,822 |
| 3. | 89048 | 0.30% | 0.99%(-0.689)#96 | 1.2%(-0.886)#15,074 |
1
Common Questions
What are the Top Zip Codes with the Highest Percentage of Population Employed in Legal Services & Support in Pahrump, NV?
Top Zip Codes with the Highest Percentage of Population Employed in Legal Services & Support in Pahrump, NV are:
What zip code has the Highest Percentage of Population Employed in Legal Services & Support in Pahrump, NV?
89060 has the Highest Percentage of Population Employed in Legal Services & Support in Pahrump, NV with 1.3%.
What is the Percentage of Population Employed in Legal Services & Support in Pahrump, NV?
Percentage of Population Employed in Legal Services & Support in Pahrump is 0.70%.
What is the Percentage of Population Employed in Legal Services & Support in Nevada?
Percentage of Population Employed in Legal Services & Support in Nevada is 0.99%.
What is the Percentage of Population Employed in Legal Services & Support in the United States?
Percentage of Population Employed in Legal Services & Support in the United States is 1.2%.