Zip Codes with the Highest Percentage of Population Employed in Office & Administration in Pahrump, NV
RELATED REPORTS & OPTIONS
Office & Administration
Pahrump
Compare Zip Codes
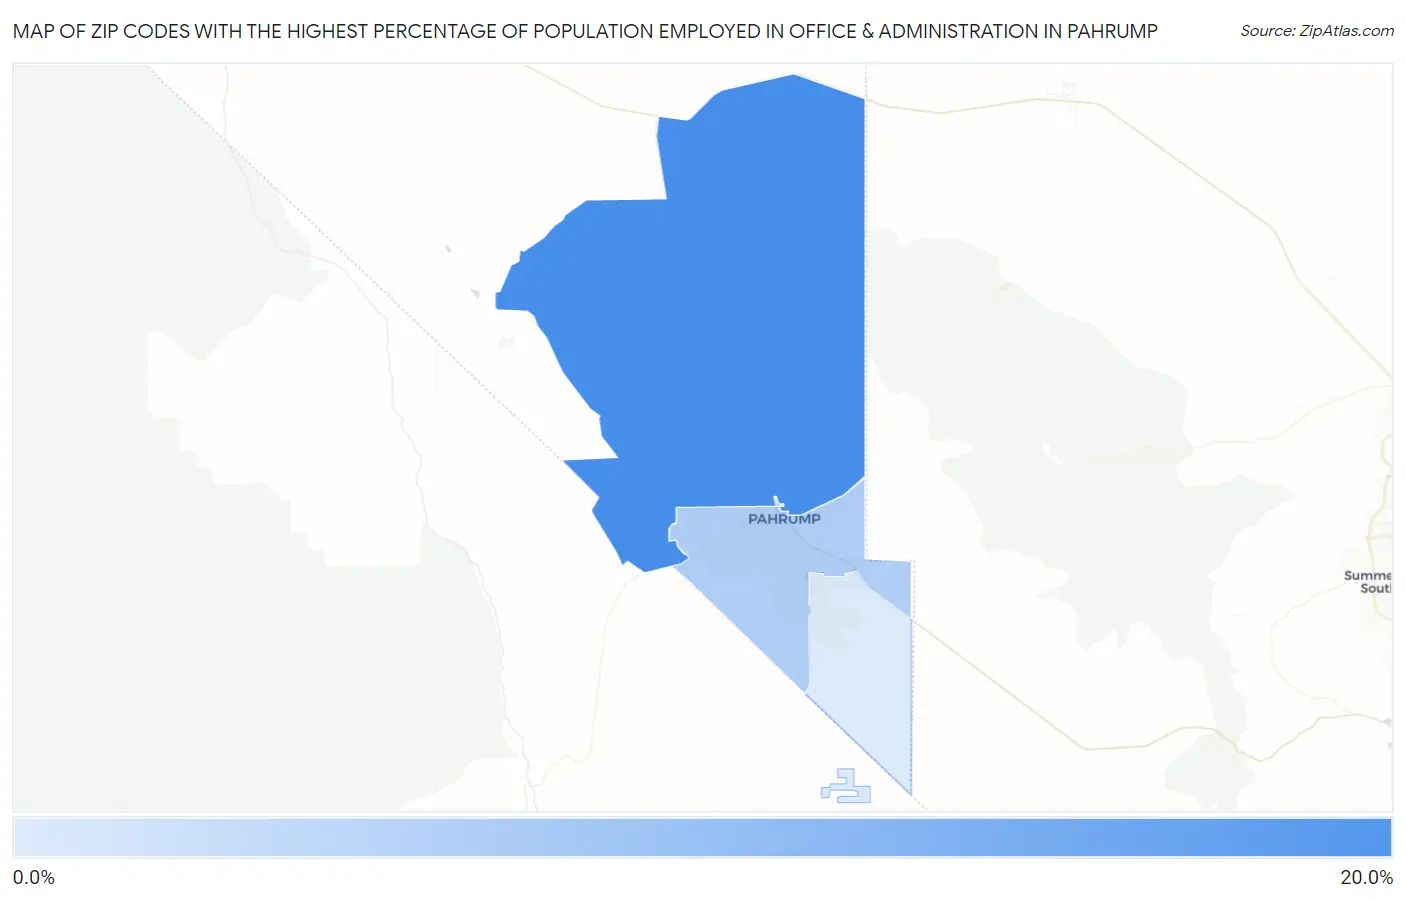
Map of Zip Codes with the Highest Percentage of Population Employed in Office & Administration in Pahrump
9.9%
16.3%
Zip Codes with the Highest Percentage of Population Employed in Office & Administration in Pahrump, NV
| Zip Code | % Employed | vs State | vs National | |
| 1. | 89060 | 16.3% | 11.8%(+4.50)#9 | 10.9%(+5.48)#3,302 |
| 2. | 89048 | 11.8% | 11.8%(-0.028)#67 | 10.9%(+0.949)#11,327 |
| 3. | 89061 | 9.9% | 11.8%(-1.98)#103 | 10.9%(-0.999)#17,590 |
1
Common Questions
What are the Top Zip Codes with the Highest Percentage of Population Employed in Office & Administration in Pahrump, NV?
Top Zip Codes with the Highest Percentage of Population Employed in Office & Administration in Pahrump, NV are:
What zip code has the Highest Percentage of Population Employed in Office & Administration in Pahrump, NV?
89060 has the Highest Percentage of Population Employed in Office & Administration in Pahrump, NV with 16.3%.
What is the Percentage of Population Employed in Office & Administration in Pahrump, NV?
Percentage of Population Employed in Office & Administration in Pahrump is 12.8%.
What is the Percentage of Population Employed in Office & Administration in Nevada?
Percentage of Population Employed in Office & Administration in Nevada is 11.8%.
What is the Percentage of Population Employed in Office & Administration in the United States?
Percentage of Population Employed in Office & Administration in the United States is 10.9%.