Petroleum County, MT Map & Demographics
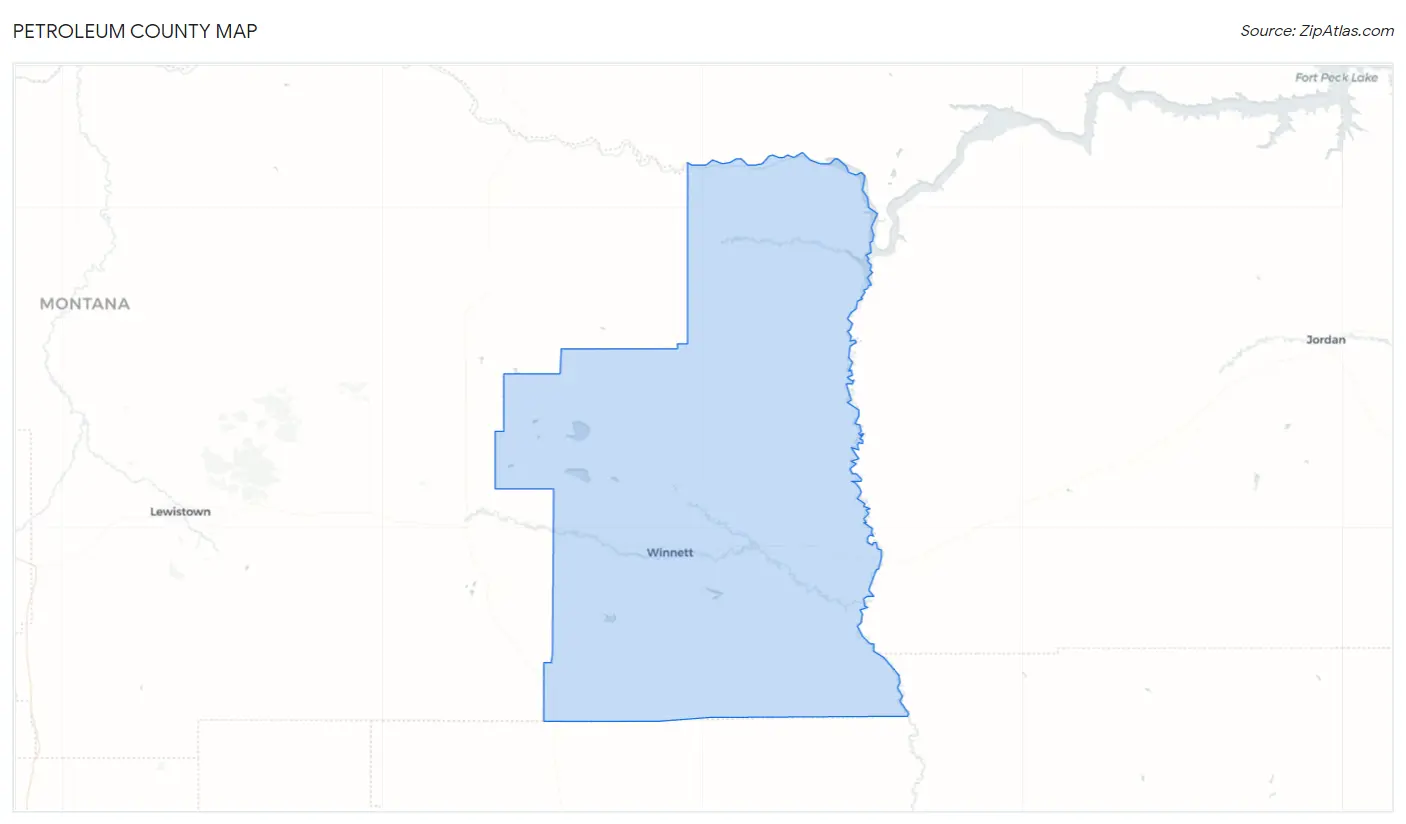
Petroleum County Map
Petroleum County Overview
$32,590
PER CAPITA INCOME
$77,500
AVG FAMILY INCOME
$57,981
AVG HOUSEHOLD INCOME
13.6%
WAGE / INCOME GAP [ % ]
86.4¢/ $1
WAGE / INCOME GAP [ $ ]
0.38
INEQUALITY / GINI INDEX
416
TOTAL POPULATION
226
MALE POPULATION
190
FEMALE POPULATION
118.95
MALES / 100 FEMALES
84.07
FEMALES / 100 MALES
49.6
MEDIAN AGE
2.6
AVG FAMILY SIZE
2.2
AVG HOUSEHOLD SIZE
239
LABOR FORCE [ PEOPLE ]
69.3%
PERCENT IN LABOR FORCE
0.8%
UNEMPLOYMENT RATE
Petroleum County Area Codes
Income in Petroleum County
Income Overview in Petroleum County
Per Capita Income in Petroleum County is $32,590, while median incomes of families and households are $77,500 and $57,981 respectively.
| Characteristic | Number | Measure |
| Per Capita Income | 416 | $32,590 |
| Median Family Income | 132 | $77,500 |
| Mean Family Income | 132 | $85,177 |
| Median Household Income | 189 | $57,981 |
| Mean Household Income | 189 | $69,949 |
| Income Deficit | 132 | $0 |
| Wage / Income Gap (%) | 416 | 13.65% |
| Wage / Income Gap ($) | 416 | 86.35¢ per $1 |
| Gini / Inequality Index | 416 | 0.38 |
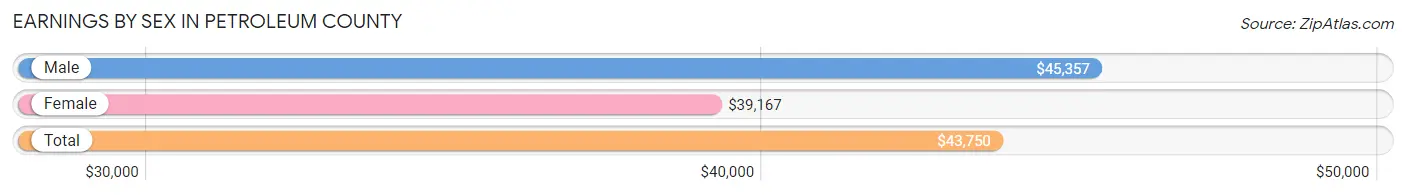
Earnings by Sex in Petroleum County
Average Earnings in Petroleum County are $43,750, $45,357 for men and $39,167 for women, a difference of 13.7%.
| Sex | Number | Average Earnings |
| Male | 130 (52.4%) | $45,357 |
| Female | 118 (47.6%) | $39,167 |
| Total | 248 (100.0%) | $43,750 |
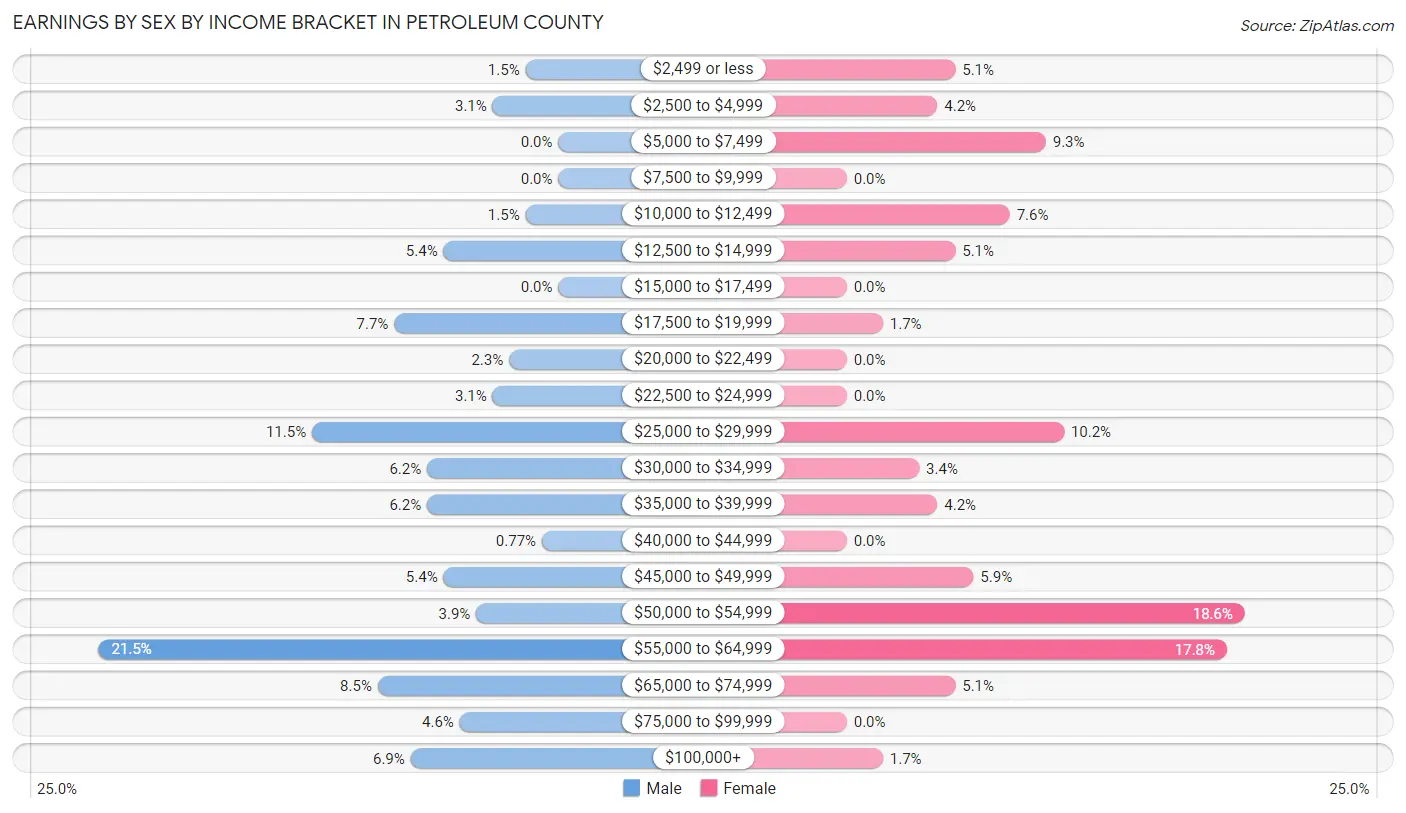
Earnings by Sex by Income Bracket in Petroleum County
The most common earnings brackets in Petroleum County are $55,000 to $64,999 for men (28 | 21.5%) and $50,000 to $54,999 for women (22 | 18.6%).
| Income | Male | Female |
| $2,499 or less | 2 (1.5%) | 6 (5.1%) |
| $2,500 to $4,999 | 4 (3.1%) | 5 (4.2%) |
| $5,000 to $7,499 | 0 (0.0%) | 11 (9.3%) |
| $7,500 to $9,999 | 0 (0.0%) | 0 (0.0%) |
| $10,000 to $12,499 | 2 (1.5%) | 9 (7.6%) |
| $12,500 to $14,999 | 7 (5.4%) | 6 (5.1%) |
| $15,000 to $17,499 | 0 (0.0%) | 0 (0.0%) |
| $17,500 to $19,999 | 10 (7.7%) | 2 (1.7%) |
| $20,000 to $22,499 | 3 (2.3%) | 0 (0.0%) |
| $22,500 to $24,999 | 4 (3.1%) | 0 (0.0%) |
| $25,000 to $29,999 | 15 (11.5%) | 12 (10.2%) |
| $30,000 to $34,999 | 8 (6.1%) | 4 (3.4%) |
| $35,000 to $39,999 | 8 (6.1%) | 5 (4.2%) |
| $40,000 to $44,999 | 1 (0.8%) | 0 (0.0%) |
| $45,000 to $49,999 | 7 (5.4%) | 7 (5.9%) |
| $50,000 to $54,999 | 5 (3.8%) | 22 (18.6%) |
| $55,000 to $64,999 | 28 (21.5%) | 21 (17.8%) |
| $65,000 to $74,999 | 11 (8.5%) | 6 (5.1%) |
| $75,000 to $99,999 | 6 (4.6%) | 0 (0.0%) |
| $100,000+ | 9 (6.9%) | 2 (1.7%) |
| Total | 130 (100.0%) | 118 (100.0%) |
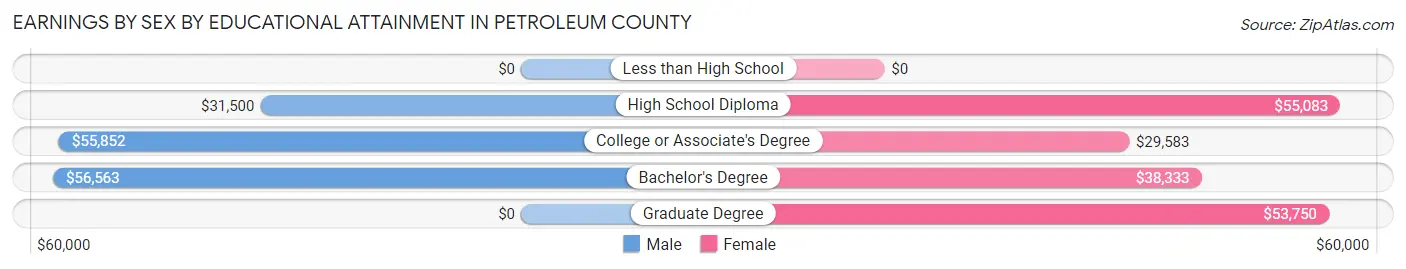
Earnings by Sex by Educational Attainment in Petroleum County
Average earnings in Petroleum County are $46,964 for men and $45,893 for women, a difference of 2.3%. Men with an educational attainment of bachelor's degree enjoy the highest average annual earnings of $56,563, while those with high school diploma education earn the least with $31,500. Women with an educational attainment of high school diploma earn the most with the average annual earnings of $55,083, while those with college or associate's degree education have the smallest earnings of $29,583.
| Educational Attainment | Male Income | Female Income |
| Less than High School | - | - |
| High School Diploma | $31,500 | $55,083 |
| College or Associate's Degree | $55,852 | $29,583 |
| Bachelor's Degree | $56,563 | $38,333 |
| Graduate Degree | - | - |
| Total | $46,964 | $45,893 |
Family Income in Petroleum County
Family Income Brackets in Petroleum County
According to the Petroleum County family income data, there are 33 families falling into the $100,000 to $149,999 income range, which is the most common income bracket and makes up 25.0% of all families.
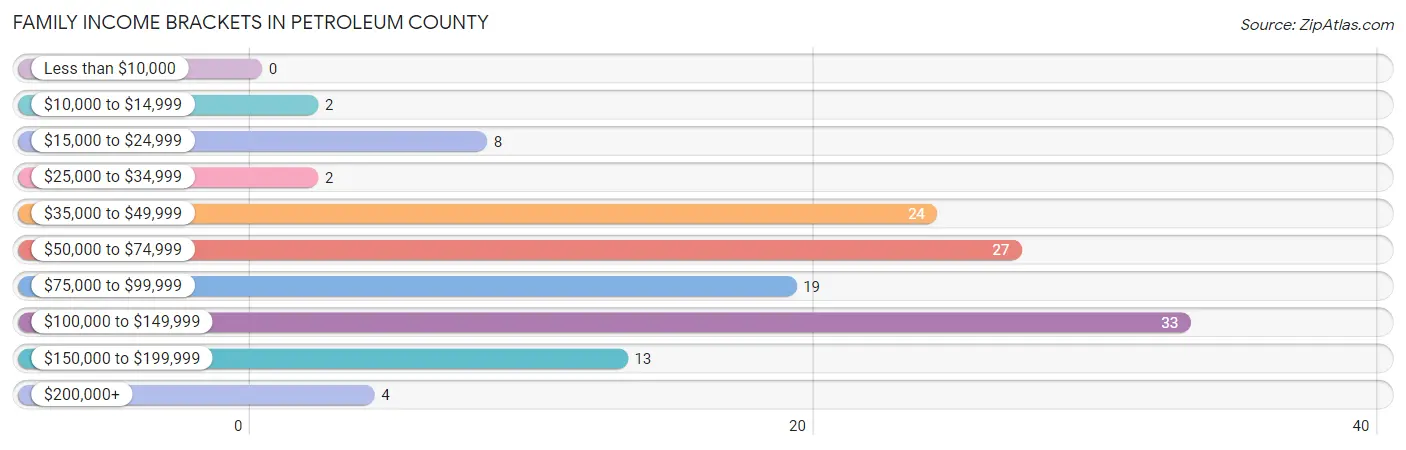
| Income Bracket | # Families | % Families |
| Less than $10,000 | 0 | 0.0% |
| $10,000 to $14,999 | 2 | 1.5% |
| $15,000 to $24,999 | 8 | 6.1% |
| $25,000 to $34,999 | 2 | 1.5% |
| $35,000 to $49,999 | 24 | 18.2% |
| $50,000 to $74,999 | 27 | 20.5% |
| $75,000 to $99,999 | 19 | 14.4% |
| $100,000 to $149,999 | 33 | 25.0% |
| $150,000 to $199,999 | 13 | 9.8% |
| $200,000+ | 4 | 3.0% |
Family Income by Famaliy Size in Petroleum County
3-person families (25 | 18.9%) account for the highest median family income in Petroleum County with $79,792 per family, while 2-person families (90 | 68.2%) have the highest median income of $32,916 per family member.
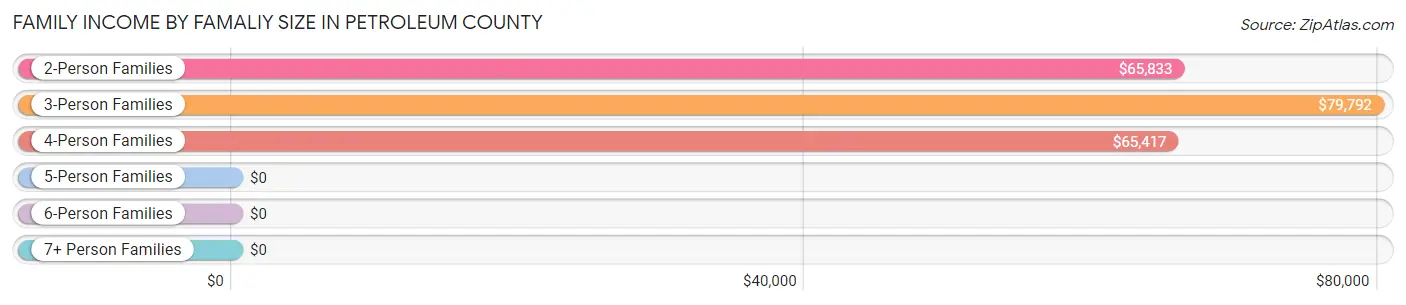
| Income Bracket | # Families | Median Income |
| 2-Person Families | 90 (68.2%) | $65,833 |
| 3-Person Families | 25 (18.9%) | $79,792 |
| 4-Person Families | 11 (8.3%) | $65,417 |
| 5-Person Families | 6 (4.5%) | $0 |
| 6-Person Families | 0 (0.0%) | $0 |
| 7+ Person Families | 0 (0.0%) | $0 |
| Total | 132 (100.0%) | $77,500 |
Family Income by Number of Earners in Petroleum County
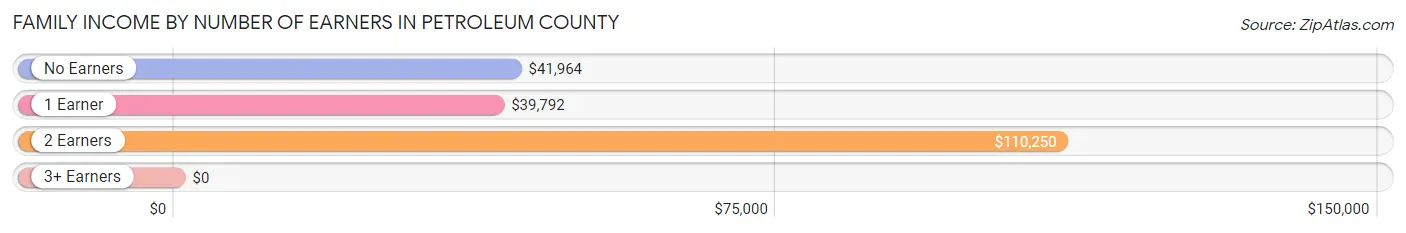
| Number of Earners | # Families | Median Income |
| No Earners | 27 (20.4%) | $41,964 |
| 1 Earner | 15 (11.4%) | $39,792 |
| 2 Earners | 89 (67.4%) | $110,250 |
| 3+ Earners | 1 (0.8%) | $0 |
| Total | 132 (100.0%) | $77,500 |
Household Income in Petroleum County
Household Income Brackets in Petroleum County
With 37 households falling in the category, the $35,000 to $49,999 income range is the most frequent in Petroleum County, accounting for 19.6% of all households. In contrast, only 1 households (0.5%) fall into the less than $10,000 income bracket, making it the least populous group.
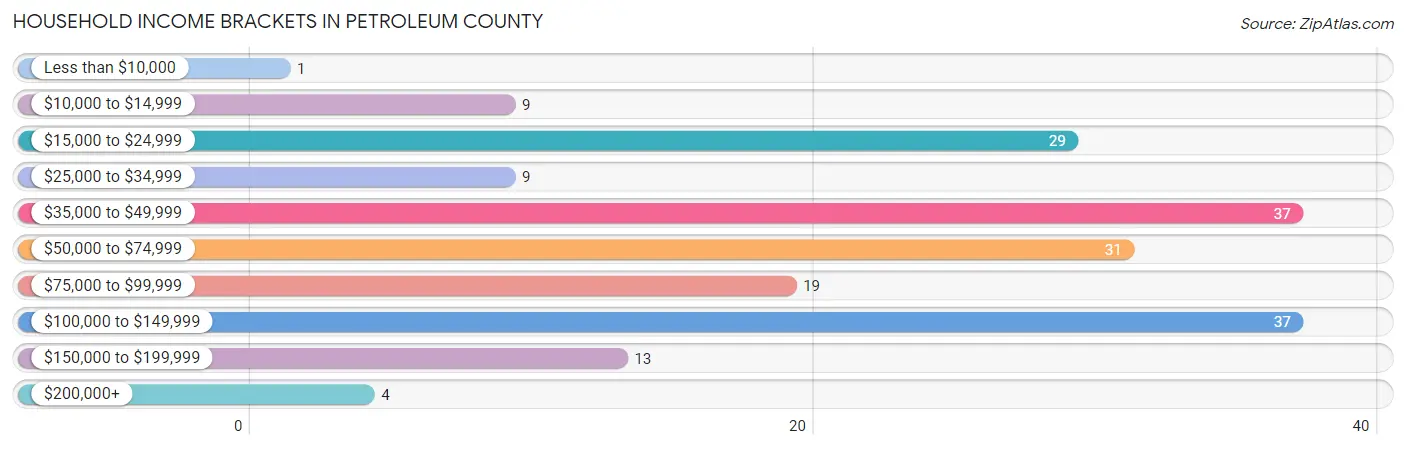
| Income Bracket | # Households | % Households |
| Less than $10,000 | 1 | 0.5% |
| $10,000 to $14,999 | 9 | 4.8% |
| $15,000 to $24,999 | 29 | 15.3% |
| $25,000 to $34,999 | 9 | 4.8% |
| $35,000 to $49,999 | 37 | 19.6% |
| $50,000 to $74,999 | 31 | 16.4% |
| $75,000 to $99,999 | 19 | 10.1% |
| $100,000 to $149,999 | 37 | 19.6% |
| $150,000 to $199,999 | 13 | 6.9% |
| $200,000+ | 4 | 2.1% |
Household Income by Householder Age in Petroleum County
The median household income in Petroleum County is $57,981, with the highest median household income of $108,750 found in the 45 to 64 years age bracket for the primary householder. A total of 82 households (43.4%) fall into this category. Meanwhile, the 15 to 24 years age bracket for the primary householder has the lowest median household income of $0, with 7 households (3.7%) in this group.
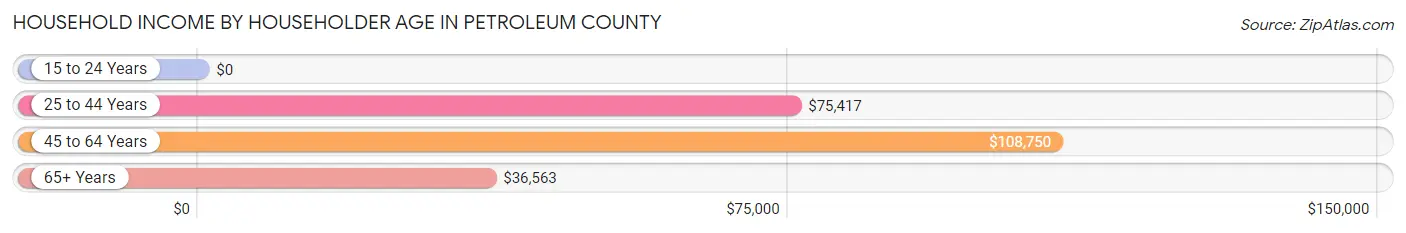
| Income Bracket | # Households | Median Income |
| 15 to 24 Years | 7 (3.7%) | $0 |
| 25 to 44 Years | 39 (20.6%) | $75,417 |
| 45 to 64 Years | 82 (43.4%) | $108,750 |
| 65+ Years | 61 (32.3%) | $36,563 |
| Total | 189 (100.0%) | $57,981 |
Poverty in Petroleum County
Income Below Poverty by Sex and Age in Petroleum County
With 5.3% poverty level for males and 7.4% for females among the residents of Petroleum County, 25 to 34 year old males and 18 to 24 year old females are the most vulnerable to poverty, with 2 males (15.4%) and 7 females (100.0%) in their respective age groups living below the poverty level.
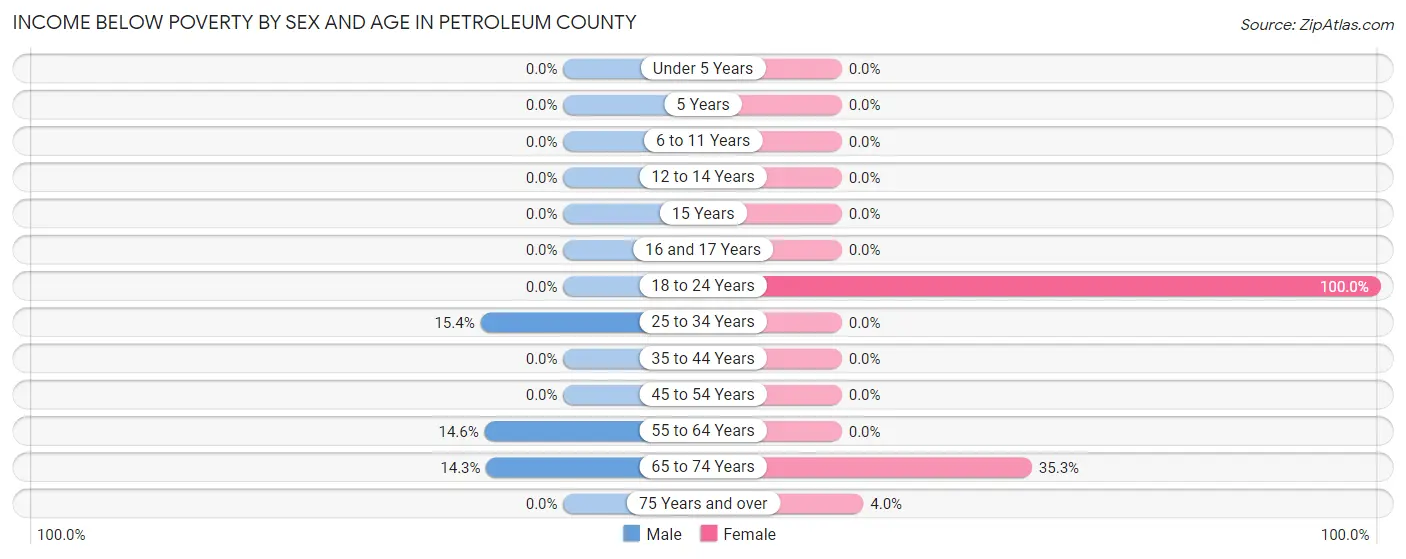
| Age Bracket | Male | Female |
| Under 5 Years | 0 (0.0%) | 0 (0.0%) |
| 5 Years | 0 (0.0%) | 0 (0.0%) |
| 6 to 11 Years | 0 (0.0%) | 0 (0.0%) |
| 12 to 14 Years | 0 (0.0%) | 0 (0.0%) |
| 15 Years | 0 (0.0%) | 0 (0.0%) |
| 16 and 17 Years | 0 (0.0%) | 0 (0.0%) |
| 18 to 24 Years | 0 (0.0%) | 7 (100.0%) |
| 25 to 34 Years | 2 (15.4%) | 0 (0.0%) |
| 35 to 44 Years | 0 (0.0%) | 0 (0.0%) |
| 45 to 54 Years | 0 (0.0%) | 0 (0.0%) |
| 55 to 64 Years | 6 (14.6%) | 0 (0.0%) |
| 65 to 74 Years | 4 (14.3%) | 6 (35.3%) |
| 75 Years and over | 0 (0.0%) | 1 (4.0%) |
| Total | 12 (5.3%) | 14 (7.4%) |
Income Above Poverty by Sex and Age in Petroleum County
According to the poverty statistics in Petroleum County, males aged under 5 years and females aged under 5 years are the age groups that are most secure financially, with 100.0% of males and 100.0% of females in these age groups living above the poverty line.
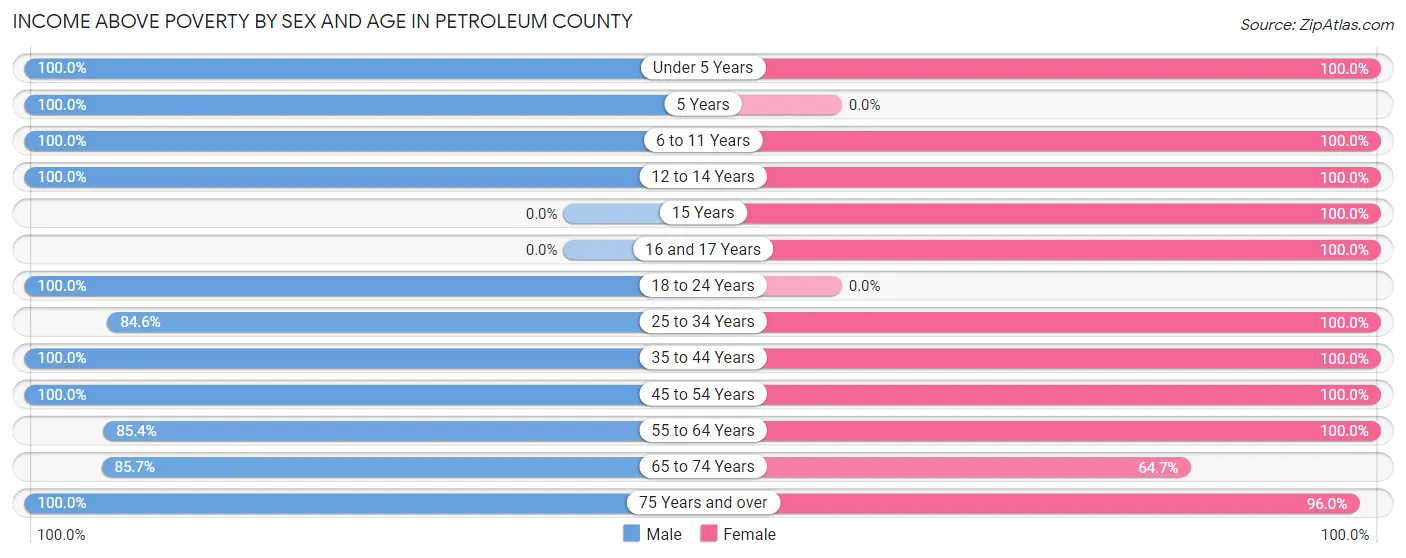
| Age Bracket | Male | Female |
| Under 5 Years | 24 (100.0%) | 13 (100.0%) |
| 5 Years | 6 (100.0%) | 0 (0.0%) |
| 6 to 11 Years | 11 (100.0%) | 8 (100.0%) |
| 12 to 14 Years | 6 (100.0%) | 1 (100.0%) |
| 15 Years | 0 (0.0%) | 2 (100.0%) |
| 16 and 17 Years | 0 (0.0%) | 1 (100.0%) |
| 18 to 24 Years | 14 (100.0%) | 0 (0.0%) |
| 25 to 34 Years | 11 (84.6%) | 26 (100.0%) |
| 35 to 44 Years | 18 (100.0%) | 28 (100.0%) |
| 45 to 54 Years | 44 (100.0%) | 25 (100.0%) |
| 55 to 64 Years | 35 (85.4%) | 37 (100.0%) |
| 65 to 74 Years | 24 (85.7%) | 11 (64.7%) |
| 75 Years and over | 21 (100.0%) | 24 (96.0%) |
| Total | 214 (94.7%) | 176 (92.6%) |
Income Below Poverty Among Married-Couple Families in Petroleum County
The poverty statistics for married-couple families in Petroleum County show that 3.2% or 4 of the total 126 families live below the poverty line. Families with no children have the highest poverty rate of 4.5%, comprising of 4 families. On the other hand, families with 1 or 2 children have the lowest poverty rate of 0.0%, which includes 0 families.
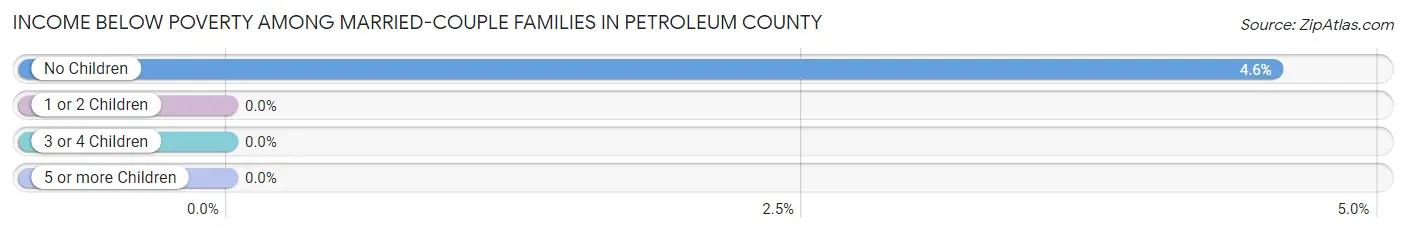
| Children | Above Poverty | Below Poverty |
| No Children | 84 (95.5%) | 4 (4.5%) |
| 1 or 2 Children | 32 (100.0%) | 0 (0.0%) |
| 3 or 4 Children | 6 (100.0%) | 0 (0.0%) |
| 5 or more Children | 0 (0.0%) | 0 (0.0%) |
| Total | 122 (96.8%) | 4 (3.2%) |
Income Below Poverty Among Single-Parent Households in Petroleum County
| Children | Single Father | Single Mother |
| No Children | 0 (0.0%) | 0 (0.0%) |
| 1 or 2 Children | 0 (0.0%) | 0 (0.0%) |
| 3 or 4 Children | 0 (0.0%) | 0 (0.0%) |
| 5 or more Children | 0 (0.0%) | 0 (0.0%) |
| Total | 0 (0.0%) | 0 (0.0%) |
Income Below Poverty Among Married-Couple vs Single-Parent Households in Petroleum County
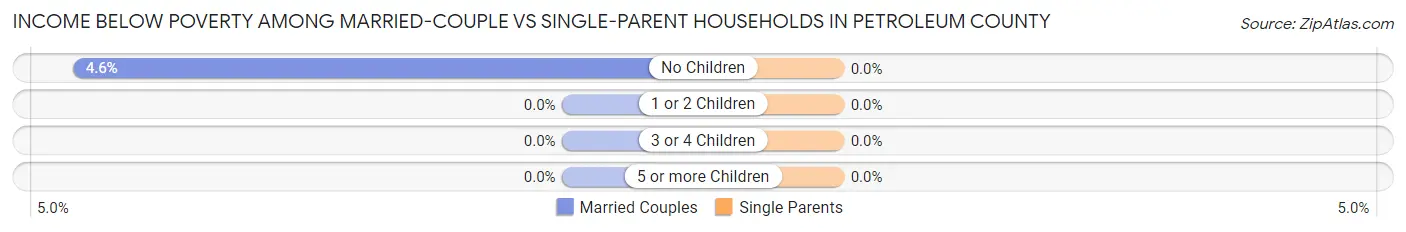
| Children | Married-Couple Families | Single-Parent Households |
| No Children | 4 (4.5%) | 0 (0.0%) |
| 1 or 2 Children | 0 (0.0%) | 0 (0.0%) |
| 3 or 4 Children | 0 (0.0%) | 0 (0.0%) |
| 5 or more Children | 0 (0.0%) | 0 (0.0%) |
| Total | 4 (3.2%) | 0 (0.0%) |
Race in Petroleum County
The most populous races in Petroleum County are White / Caucasian (408 | 98.1%), and Asian (8 | 1.9%).
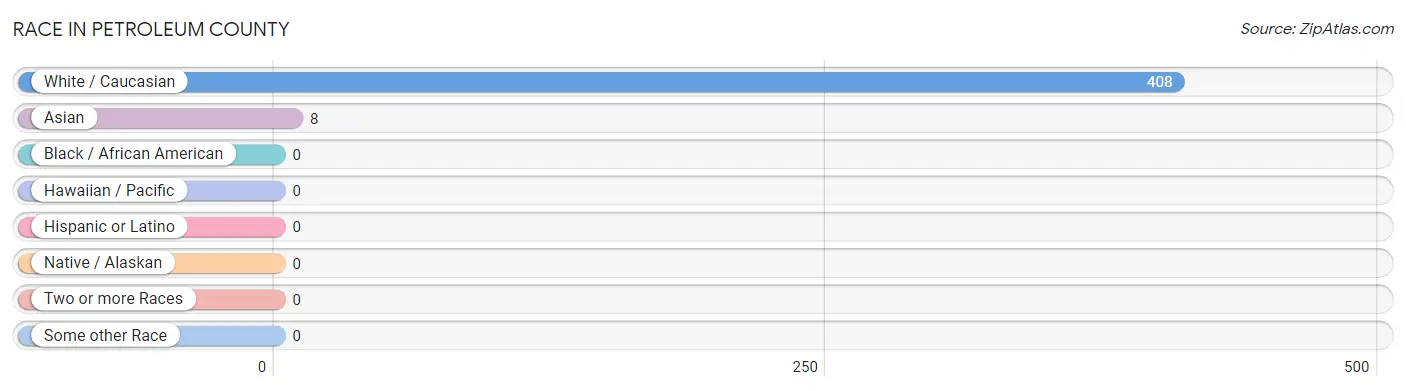
| Race | # Population | % Population |
| Asian | 8 | 1.9% |
| Black / African American | 0 | 0.0% |
| Hawaiian / Pacific | 0 | 0.0% |
| Hispanic or Latino | 0 | 0.0% |
| Native / Alaskan | 0 | 0.0% |
| White / Caucasian | 408 | 98.1% |
| Two or more Races | 0 | 0.0% |
| Some other Race | 0 | 0.0% |
| Total | 416 | 100.0% |
Ancestry in Petroleum County
The most populous ancestries reported in Petroleum County are German (140 | 33.7%), American (109 | 26.2%), English (53 | 12.7%), Norwegian (42 | 10.1%), and Irish (27 | 6.5%), together accounting for 89.2% of all Petroleum County residents.
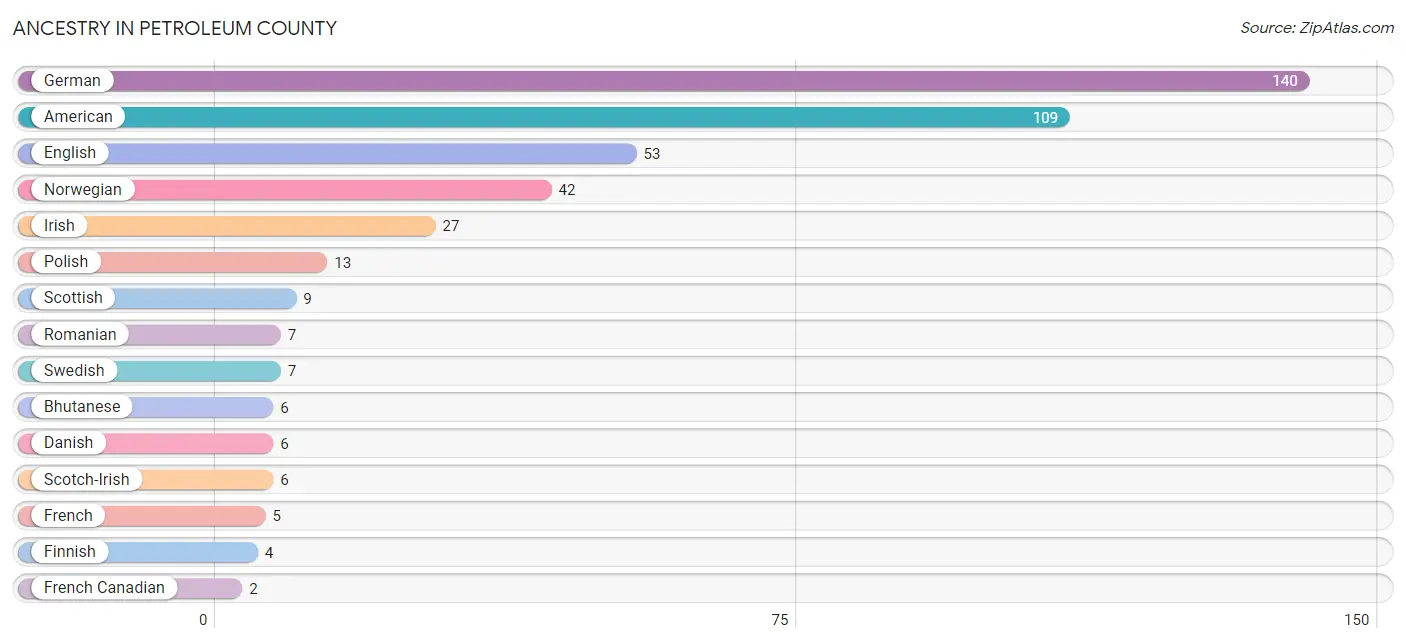
| Ancestry | # Population | % Population |
| American | 109 | 26.2% |
| Bhutanese | 6 | 1.4% |
| Danish | 6 | 1.4% |
| English | 53 | 12.7% |
| Finnish | 4 | 1.0% |
| French | 5 | 1.2% |
| French Canadian | 2 | 0.5% |
| German | 140 | 33.7% |
| Indian (Asian) | 2 | 0.5% |
| Irish | 27 | 6.5% |
| Italian | 1 | 0.2% |
| Norwegian | 42 | 10.1% |
| Polish | 13 | 3.1% |
| Romanian | 7 | 1.7% |
| Scandinavian | 1 | 0.2% |
| Scotch-Irish | 6 | 1.4% |
| Scottish | 9 | 2.2% |
| Swedish | 7 | 1.7% |
| Yugoslavian | 2 | 0.5% | View All 19 Rows |
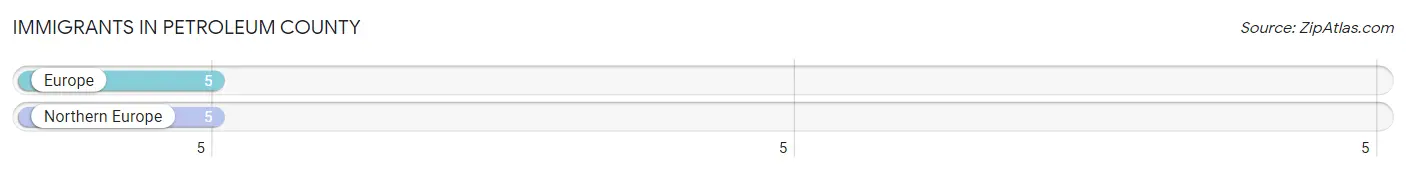
Immigrants in Petroleum County
The most numerous immigrant groups reported in Petroleum County came from Europe (5 | 1.2%), and Northern Europe (5 | 1.2%), together accounting for 2.4% of all Petroleum County residents.
| Immigration Origin | # Population | % Population |
| Europe | 5 | 1.2% |
| Northern Europe | 5 | 1.2% | View All 2 Rows |
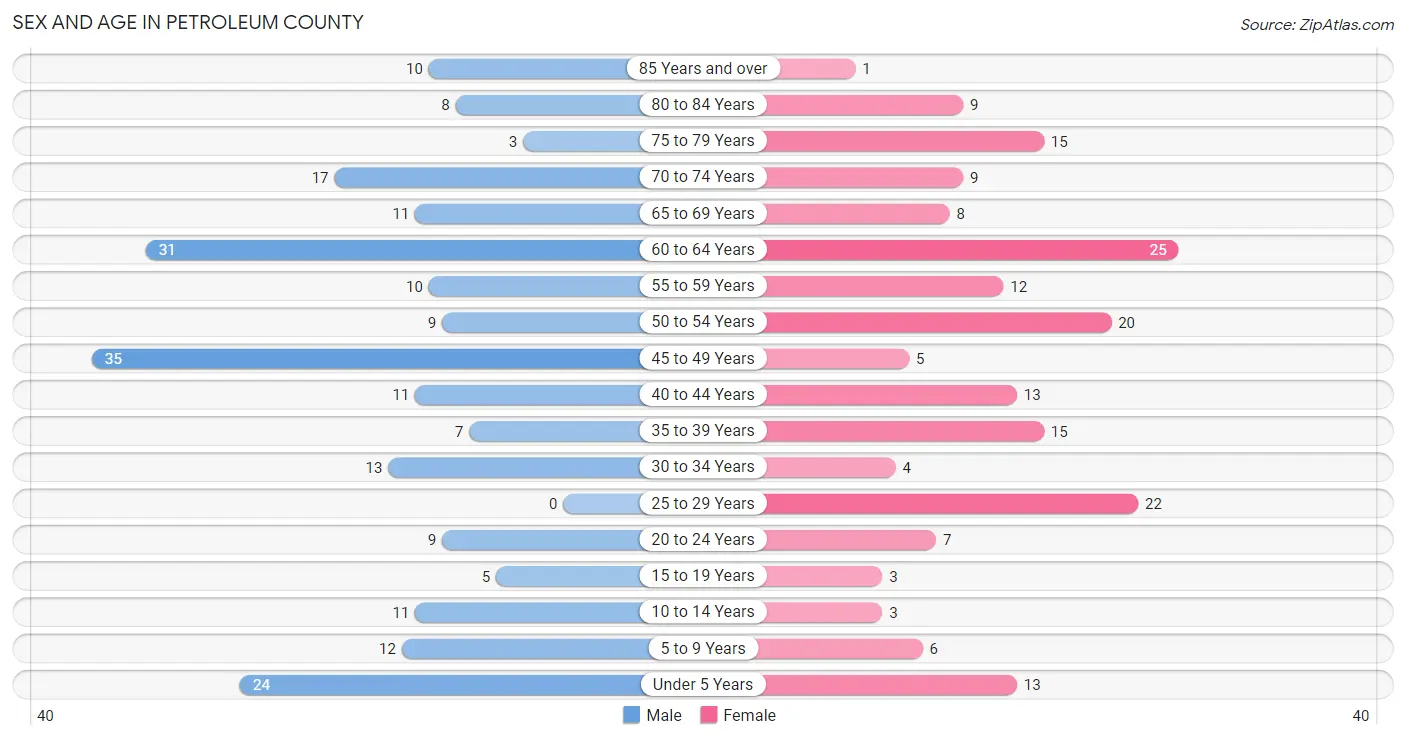
Sex and Age in Petroleum County
Sex and Age in Petroleum County
The most populous age groups in Petroleum County are 45 to 49 Years (35 | 15.5%) for men and 60 to 64 Years (25 | 13.2%) for women.
| Age Bracket | Male | Female |
| Under 5 Years | 24 (10.6%) | 13 (6.8%) |
| 5 to 9 Years | 12 (5.3%) | 6 (3.2%) |
| 10 to 14 Years | 11 (4.9%) | 3 (1.6%) |
| 15 to 19 Years | 5 (2.2%) | 3 (1.6%) |
| 20 to 24 Years | 9 (4.0%) | 7 (3.7%) |
| 25 to 29 Years | 0 (0.0%) | 22 (11.6%) |
| 30 to 34 Years | 13 (5.8%) | 4 (2.1%) |
| 35 to 39 Years | 7 (3.1%) | 15 (7.9%) |
| 40 to 44 Years | 11 (4.9%) | 13 (6.8%) |
| 45 to 49 Years | 35 (15.5%) | 5 (2.6%) |
| 50 to 54 Years | 9 (4.0%) | 20 (10.5%) |
| 55 to 59 Years | 10 (4.4%) | 12 (6.3%) |
| 60 to 64 Years | 31 (13.7%) | 25 (13.2%) |
| 65 to 69 Years | 11 (4.9%) | 8 (4.2%) |
| 70 to 74 Years | 17 (7.5%) | 9 (4.7%) |
| 75 to 79 Years | 3 (1.3%) | 15 (7.9%) |
| 80 to 84 Years | 8 (3.5%) | 9 (4.7%) |
| 85 Years and over | 10 (4.4%) | 1 (0.5%) |
| Total | 226 (100.0%) | 190 (100.0%) |
Families and Households in Petroleum County
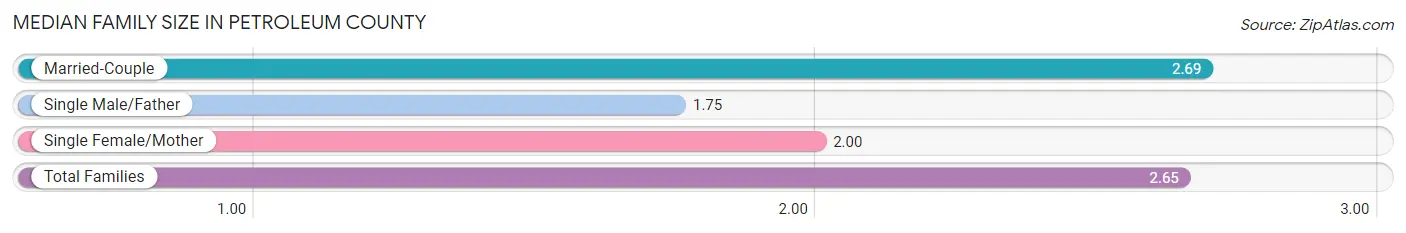
Median Family Size in Petroleum County
The median family size in Petroleum County is 2.65 persons per family, with married-couple families (126 | 95.5%) accounting for the largest median family size of 2.69 persons per family. On the other hand, single male/father families (4 | 3.0%) represent the smallest median family size with 1.75 persons per family.
| Family Type | # Families | Family Size |
| Married-Couple | 126 (95.5%) | 2.69 |
| Single Male/Father | 4 (3.0%) | 1.75 |
| Single Female/Mother | 2 (1.5%) | 2.00 |
| Total Families | 132 (100.0%) | 2.65 |
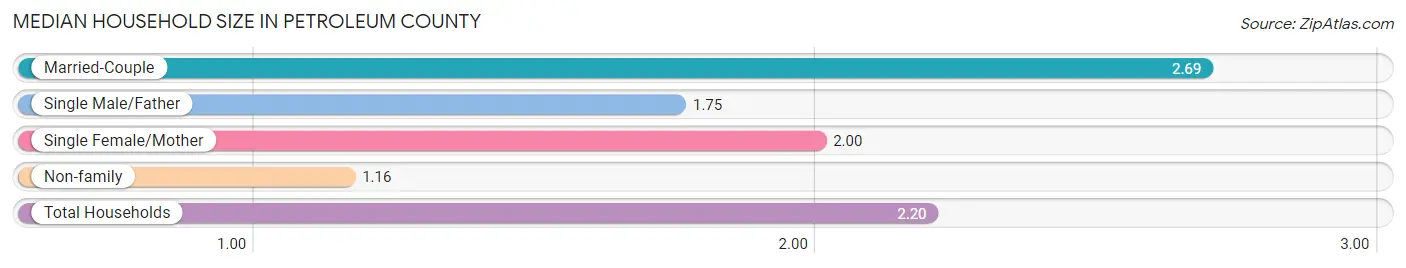
Median Household Size in Petroleum County
The median household size in Petroleum County is 2.20 persons per household, with married-couple households (126 | 66.7%) accounting for the largest median household size of 2.69 persons per household. non-family households (57 | 30.2%) represent the smallest median household size with 1.16 persons per household.
| Household Type | # Households | Household Size |
| Married-Couple | 126 (66.7%) | 2.69 |
| Single Male/Father | 4 (2.1%) | 1.75 |
| Single Female/Mother | 2 (1.1%) | 2.00 |
| Non-family | 57 (30.2%) | 1.16 |
| Total Households | 189 (100.0%) | 2.20 |
Household Size by Marriage Status in Petroleum County
Out of a total of 189 households in Petroleum County, 132 (69.8%) are family households, while 57 (30.2%) are nonfamily households. The most numerous type of family households are 2-person households, comprising 90, and the most common type of nonfamily households are 1-person households, comprising 46.
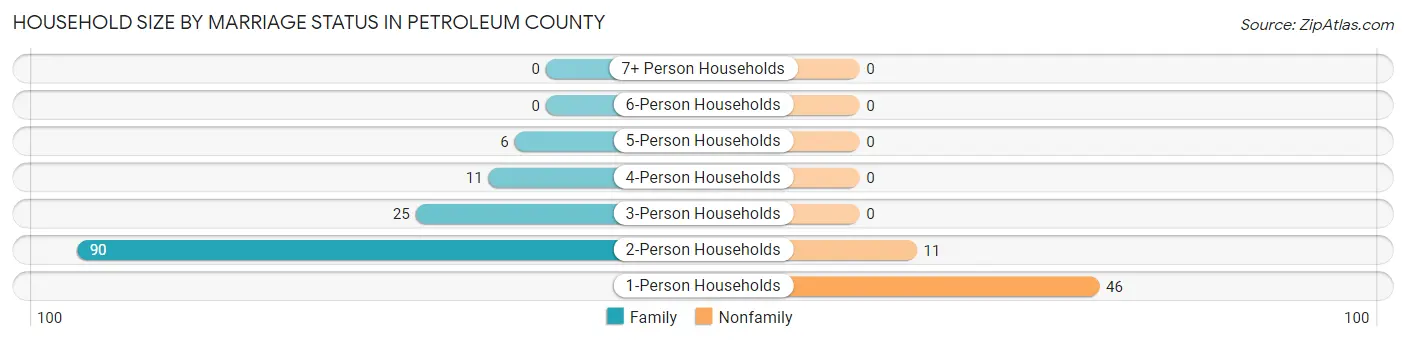
| Household Size | Family Households | Nonfamily Households |
| 1-Person Households | - | 46 (24.3%) |
| 2-Person Households | 90 (47.6%) | 11 (5.8%) |
| 3-Person Households | 25 (13.2%) | 0 (0.0%) |
| 4-Person Households | 11 (5.8%) | 0 (0.0%) |
| 5-Person Households | 6 (3.2%) | 0 (0.0%) |
| 6-Person Households | 0 (0.0%) | 0 (0.0%) |
| 7+ Person Households | 0 (0.0%) | 0 (0.0%) |
| Total | 132 (69.8%) | 57 (30.2%) |
Female Fertility in Petroleum County
Fertility by Age in Petroleum County
Average fertility rate in Petroleum County is 87.0 births per 1,000 women. Women in the age bracket of 35 to 50 years have the highest fertility rate with 182.0 births per 1,000 women. Women in the age bracket of 35 to 50 years acount for 100.0% of all women with births.
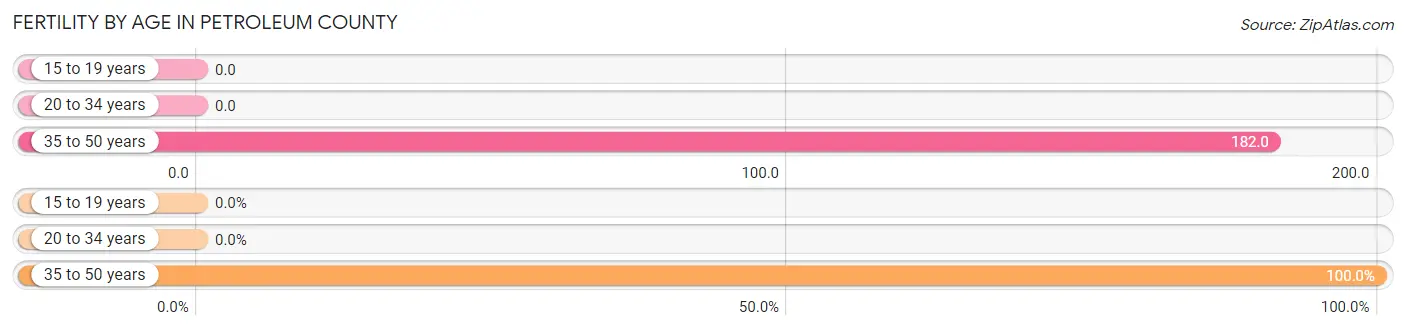
| Age Bracket | Women with Births | Births / 1,000 Women |
| 15 to 19 years | 0 (0.0%) | 0.0 |
| 20 to 34 years | 0 (0.0%) | 0.0 |
| 35 to 50 years | 6 (100.0%) | 182.0 |
| Total | 6 (100.0%) | 87.0 |
Fertility by Age by Marriage Status in Petroleum County
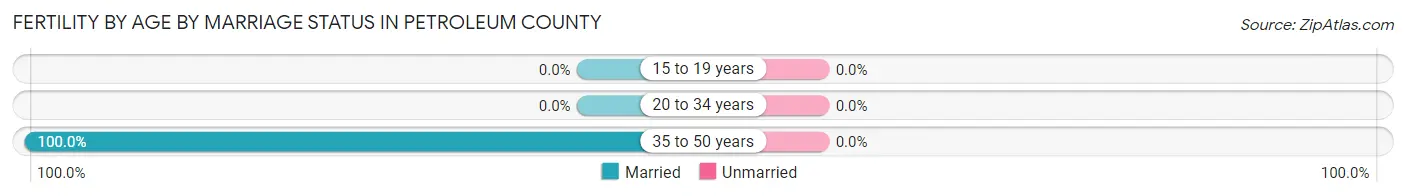
| Age Bracket | Married | Unmarried |
| 15 to 19 years | 0 (0.0%) | 0 (0.0%) |
| 20 to 34 years | 0 (0.0%) | 0 (0.0%) |
| 35 to 50 years | 6 (100.0%) | 0 (0.0%) |
| Total | 6 (100.0%) | 0 (0.0%) |
Fertility by Education in Petroleum County
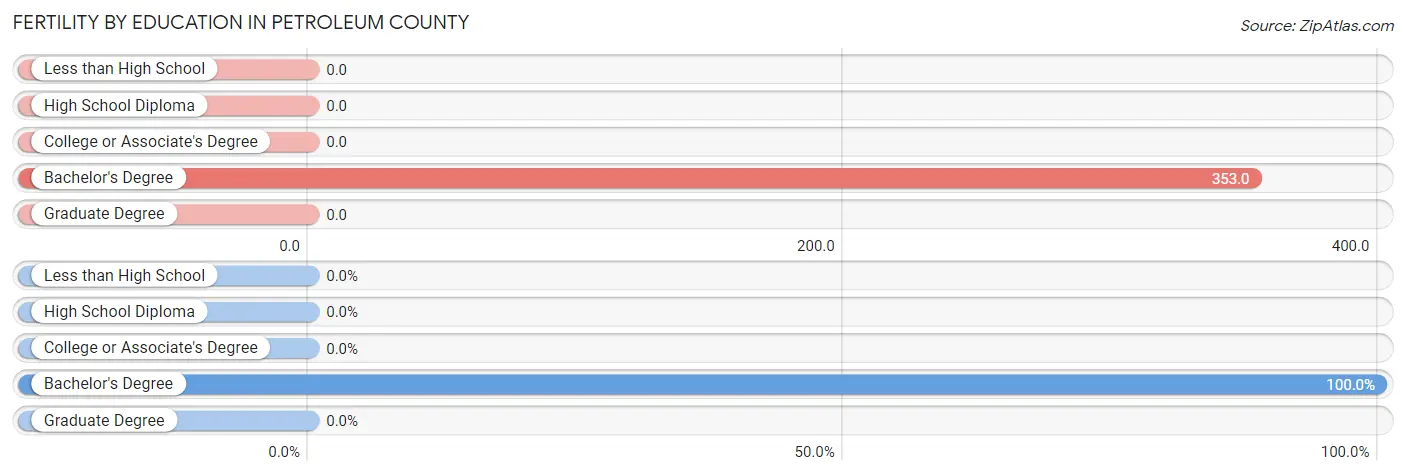
| Educational Attainment | Women with Births | Births / 1,000 Women |
| Less than High School | 0 (0.0%) | 0.0 |
| High School Diploma | 0 (0.0%) | 0.0 |
| College or Associate's Degree | 0 (0.0%) | 0.0 |
| Bachelor's Degree | 6 (100.0%) | 353.0 |
| Graduate Degree | 0 (0.0%) | 0.0 |
| Total | 6 (100.0%) | 87.0 |
Fertility by Education by Marriage Status in Petroleum County
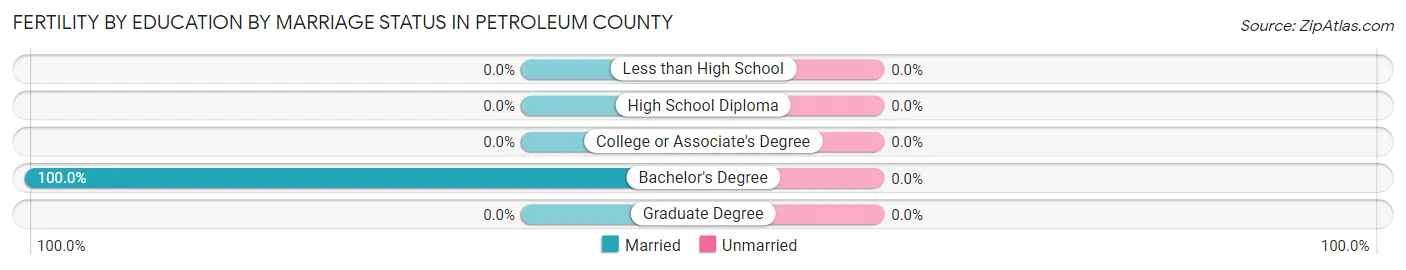
| Educational Attainment | Married | Unmarried |
| Less than High School | 0 (0.0%) | 0 (0.0%) |
| High School Diploma | 0 (0.0%) | 0 (0.0%) |
| College or Associate's Degree | 0 (0.0%) | 0 (0.0%) |
| Bachelor's Degree | 6 (100.0%) | 0 (0.0%) |
| Graduate Degree | 0 (0.0%) | 0 (0.0%) |
| Total | 6 (100.0%) | 0 (0.0%) |
Employment Characteristics in Petroleum County
Employment by Class of Employer in Petroleum County
Among the 235 employed individuals in Petroleum County, private company employees (104 | 44.3%), self-employed (not incorporated) (55 | 23.4%), and local government employees (35 | 14.9%) make up the most common classes of employment.
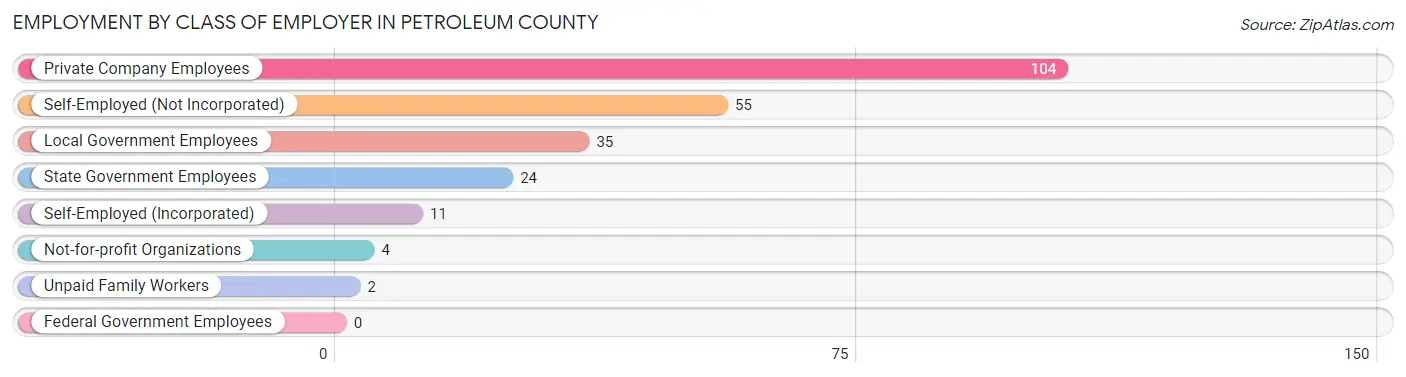
| Employer Class | # Employees | % Employees |
| Private Company Employees | 104 | 44.3% |
| Self-Employed (Incorporated) | 11 | 4.7% |
| Self-Employed (Not Incorporated) | 55 | 23.4% |
| Not-for-profit Organizations | 4 | 1.7% |
| Local Government Employees | 35 | 14.9% |
| State Government Employees | 24 | 10.2% |
| Federal Government Employees | 0 | 0.0% |
| Unpaid Family Workers | 2 | 0.9% |
| Total | 235 | 100.0% |
Employment Status by Age in Petroleum County
According to the labor force statistics for Petroleum County, out of the total population over 16 years of age (345), 69.3% or 239 individuals are in the labor force, with 0.8% or 2 of them unemployed. The age group with the highest labor force participation rate is 20 to 24 years, with 100.0% or 16 individuals in the labor force. Within the labor force, the 20 to 24 years age range has the highest percentage of unemployed individuals, with 12.5% or 2 of them being unemployed.
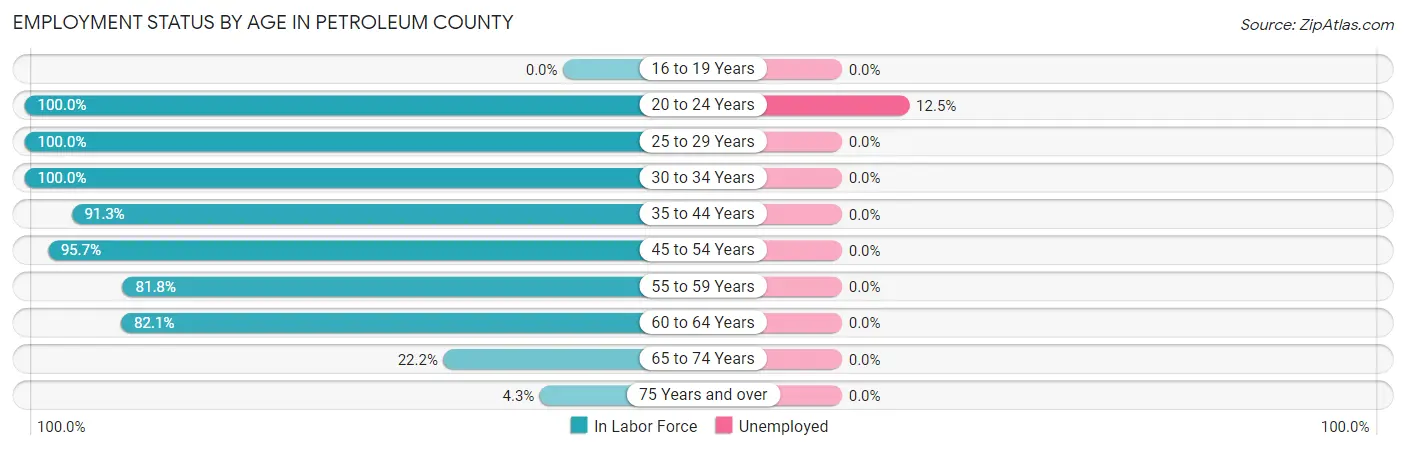
| Age Bracket | In Labor Force | Unemployed |
| 16 to 19 Years | 0 (0.0%) | 0 (0.0%) |
| 20 to 24 Years | 16 (100.0%) | 2 (12.5%) |
| 25 to 29 Years | 22 (100.0%) | 0 (0.0%) |
| 30 to 34 Years | 17 (100.0%) | 0 (0.0%) |
| 35 to 44 Years | 42 (91.3%) | 0 (0.0%) |
| 45 to 54 Years | 66 (95.7%) | 0 (0.0%) |
| 55 to 59 Years | 18 (81.8%) | 0 (0.0%) |
| 60 to 64 Years | 46 (82.1%) | 0 (0.0%) |
| 65 to 74 Years | 10 (22.2%) | 0 (0.0%) |
| 75 Years and over | 2 (4.3%) | 0 (0.0%) |
| Total | 239 (69.3%) | 2 (0.8%) |
Employment Status by Educational Attainment in Petroleum County
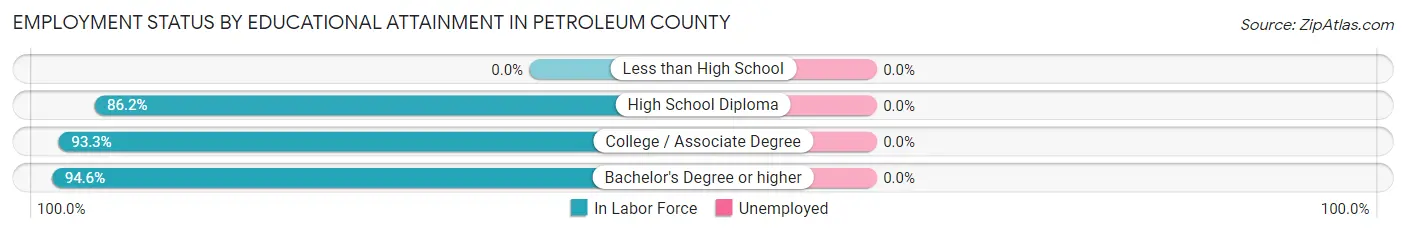
| Educational Attainment | In Labor Force | Unemployed |
| Less than High School | 0 (0.0%) | 0 (0.0%) |
| High School Diploma | 75 (86.2%) | 0 (0.0%) |
| College / Associate Degree | 83 (93.3%) | 0 (0.0%) |
| Bachelor's Degree or higher | 53 (94.6%) | 0 (0.0%) |
| Total | 211 (90.9%) | 0 (0.0%) |
Employment Occupations by Sex in Petroleum County
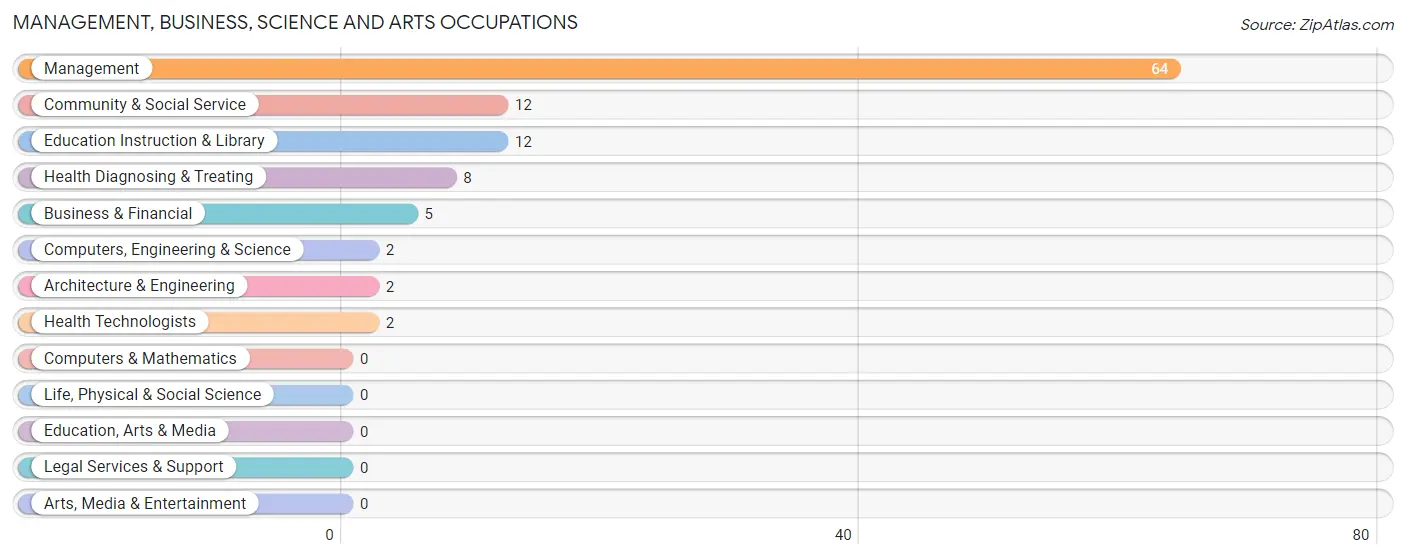
Management, Business, Science and Arts Occupations
The most common Management, Business, Science and Arts occupations in Petroleum County are Management (64 | 27.0%), Community & Social Service (12 | 5.1%), Education Instruction & Library (12 | 5.1%), Health Diagnosing & Treating (8 | 3.4%), and Business & Financial (5 | 2.1%).
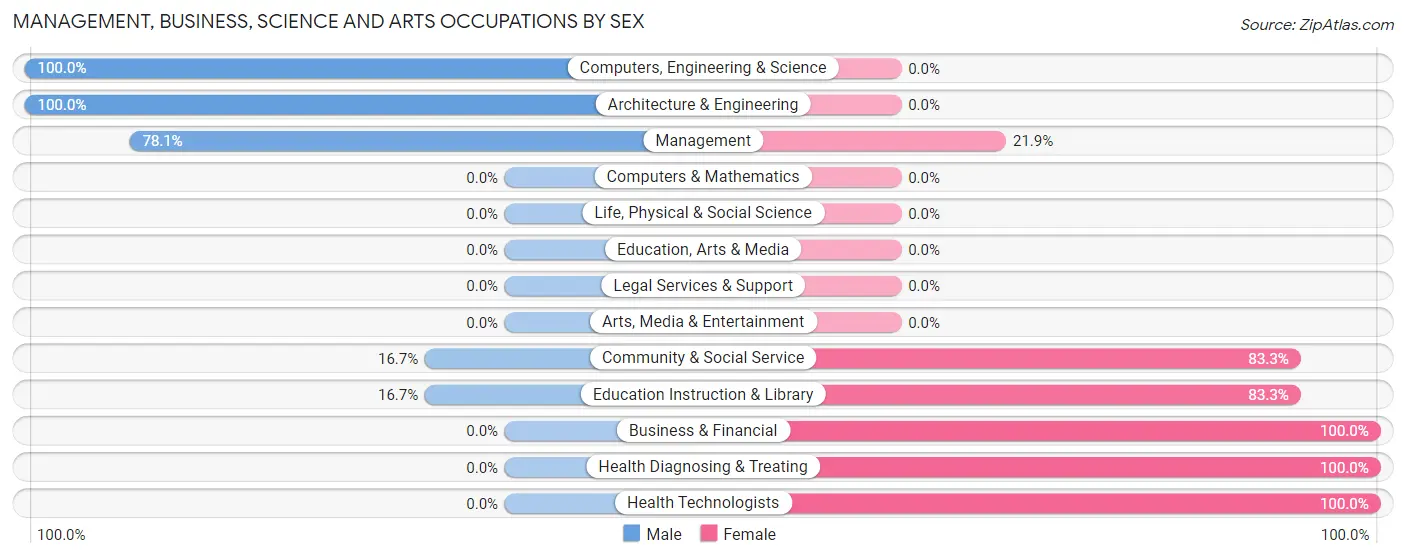
Management, Business, Science and Arts Occupations by Sex
Within the Management, Business, Science and Arts occupations in Petroleum County, the most male-oriented occupations are Computers, Engineering & Science (100.0%), Architecture & Engineering (100.0%), and Management (78.1%), while the most female-oriented occupations are Business & Financial (100.0%), Health Diagnosing & Treating (100.0%), and Health Technologists (100.0%).
| Occupation | Male | Female |
| Management | 50 (78.1%) | 14 (21.9%) |
| Business & Financial | 0 (0.0%) | 5 (100.0%) |
| Computers, Engineering & Science | 2 (100.0%) | 0 (0.0%) |
| Computers & Mathematics | 0 (0.0%) | 0 (0.0%) |
| Architecture & Engineering | 2 (100.0%) | 0 (0.0%) |
| Life, Physical & Social Science | 0 (0.0%) | 0 (0.0%) |
| Community & Social Service | 2 (16.7%) | 10 (83.3%) |
| Education, Arts & Media | 0 (0.0%) | 0 (0.0%) |
| Legal Services & Support | 0 (0.0%) | 0 (0.0%) |
| Education Instruction & Library | 2 (16.7%) | 10 (83.3%) |
| Arts, Media & Entertainment | 0 (0.0%) | 0 (0.0%) |
| Health Diagnosing & Treating | 0 (0.0%) | 8 (100.0%) |
| Health Technologists | 0 (0.0%) | 2 (100.0%) |
| Total (Category) | 54 (59.3%) | 37 (40.7%) |
| Total (Overall) | 123 (51.9%) | 114 (48.1%) |
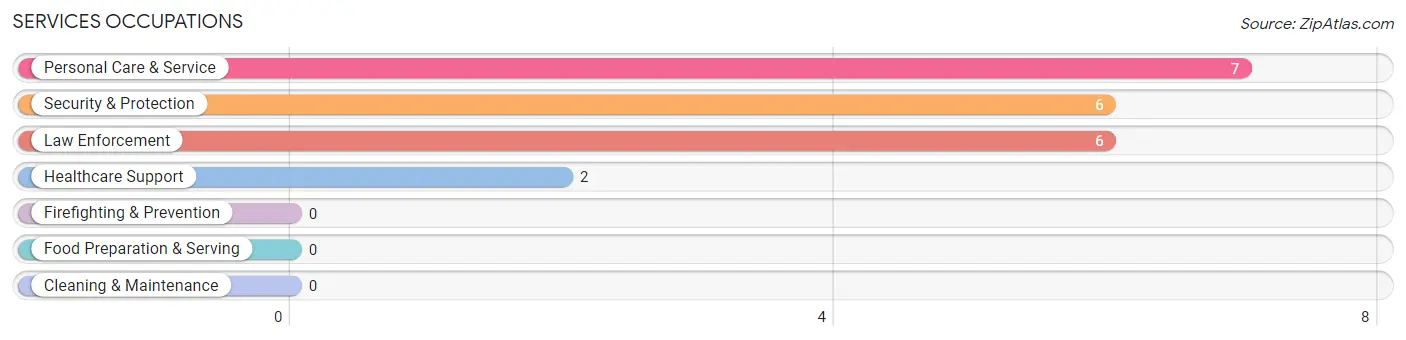
Services Occupations
The most common Services occupations in Petroleum County are Personal Care & Service (7 | 2.9%), Security & Protection (6 | 2.5%), Law Enforcement (6 | 2.5%), and Healthcare Support (2 | 0.8%).
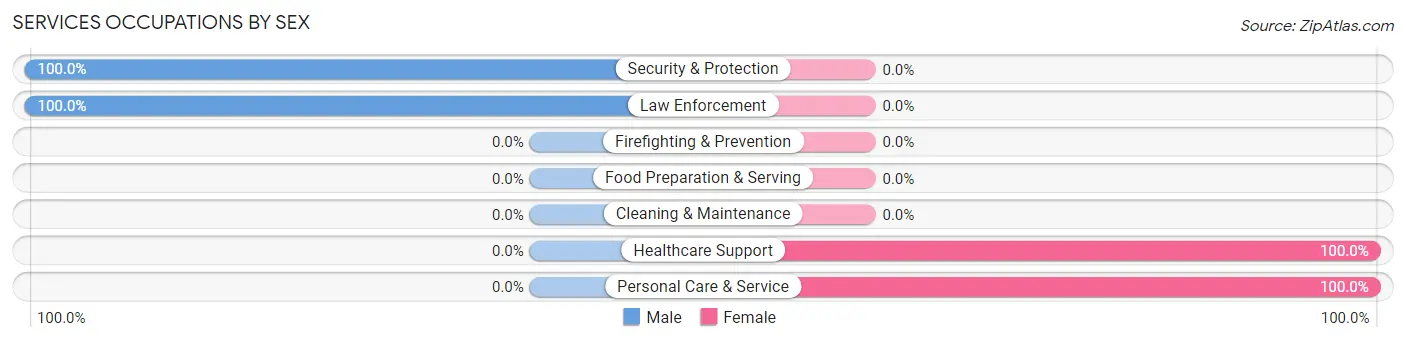
Services Occupations by Sex
Within the Services occupations in Petroleum County, the most male-oriented occupations are Security & Protection (100.0%), and Law Enforcement (100.0%), while the most female-oriented occupations are Healthcare Support (100.0%), and Personal Care & Service (100.0%).
| Occupation | Male | Female |
| Healthcare Support | 0 (0.0%) | 2 (100.0%) |
| Security & Protection | 6 (100.0%) | 0 (0.0%) |
| Firefighting & Prevention | 0 (0.0%) | 0 (0.0%) |
| Law Enforcement | 6 (100.0%) | 0 (0.0%) |
| Food Preparation & Serving | 0 (0.0%) | 0 (0.0%) |
| Cleaning & Maintenance | 0 (0.0%) | 0 (0.0%) |
| Personal Care & Service | 0 (0.0%) | 7 (100.0%) |
| Total (Category) | 6 (40.0%) | 9 (60.0%) |
| Total (Overall) | 123 (51.9%) | 114 (48.1%) |
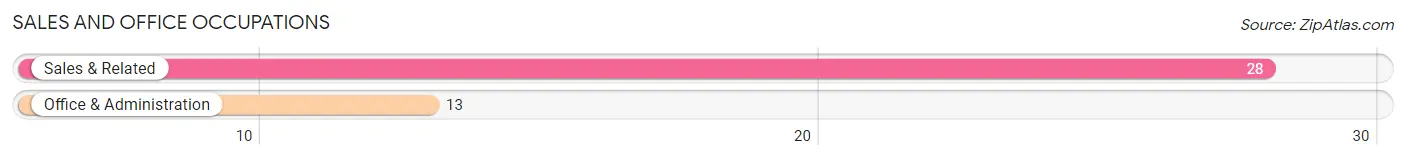
Sales and Office Occupations
The most common Sales and Office occupations in Petroleum County are Sales & Related (28 | 11.8%), and Office & Administration (13 | 5.5%).
Sales and Office Occupations by Sex
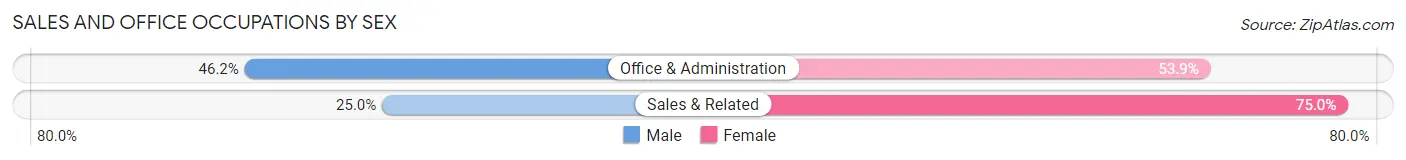
| Occupation | Male | Female |
| Sales & Related | 7 (25.0%) | 21 (75.0%) |
| Office & Administration | 6 (46.2%) | 7 (53.8%) |
| Total (Category) | 13 (31.7%) | 28 (68.3%) |
| Total (Overall) | 123 (51.9%) | 114 (48.1%) |
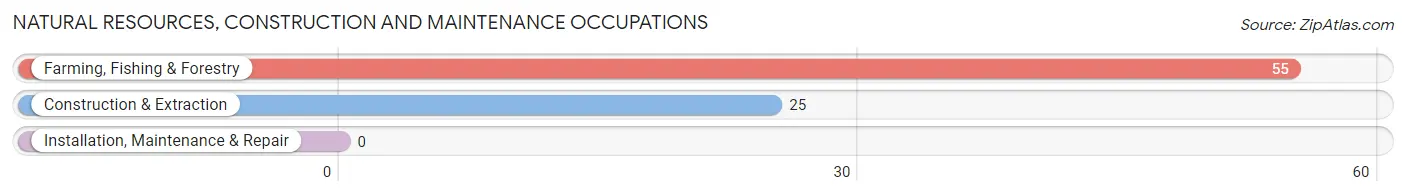
Natural Resources, Construction and Maintenance Occupations
The most common Natural Resources, Construction and Maintenance occupations in Petroleum County are Farming, Fishing & Forestry (55 | 23.2%), and Construction & Extraction (25 | 10.5%).
Natural Resources, Construction and Maintenance Occupations by Sex
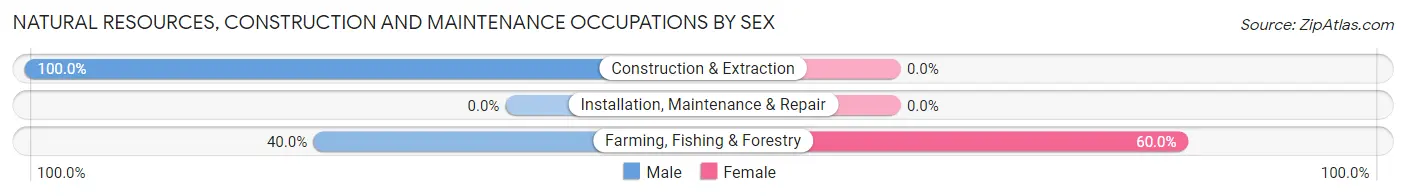
| Occupation | Male | Female |
| Farming, Fishing & Forestry | 22 (40.0%) | 33 (60.0%) |
| Construction & Extraction | 25 (100.0%) | 0 (0.0%) |
| Installation, Maintenance & Repair | 0 (0.0%) | 0 (0.0%) |
| Total (Category) | 47 (58.8%) | 33 (41.2%) |
| Total (Overall) | 123 (51.9%) | 114 (48.1%) |
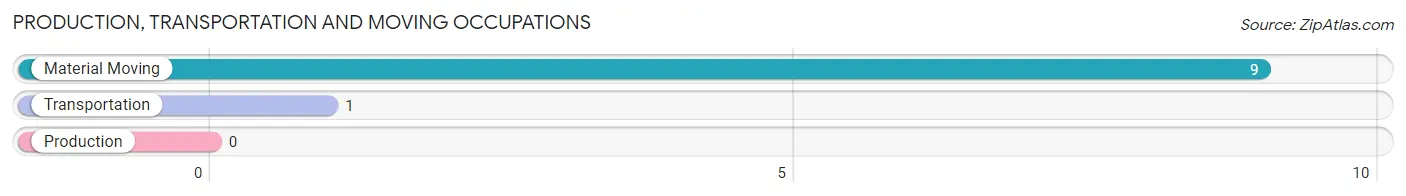
Production, Transportation and Moving Occupations
The most common Production, Transportation and Moving occupations in Petroleum County are Material Moving (9 | 3.8%), and Transportation (1 | 0.4%).
Production, Transportation and Moving Occupations by Sex
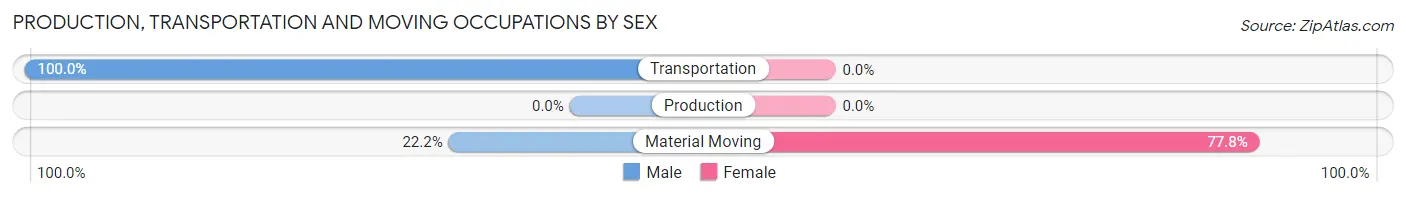
| Occupation | Male | Female |
| Production | 0 (0.0%) | 0 (0.0%) |
| Transportation | 1 (100.0%) | 0 (0.0%) |
| Material Moving | 2 (22.2%) | 7 (77.8%) |
| Total (Category) | 3 (30.0%) | 7 (70.0%) |
| Total (Overall) | 123 (51.9%) | 114 (48.1%) |
Employment Industries by Sex in Petroleum County
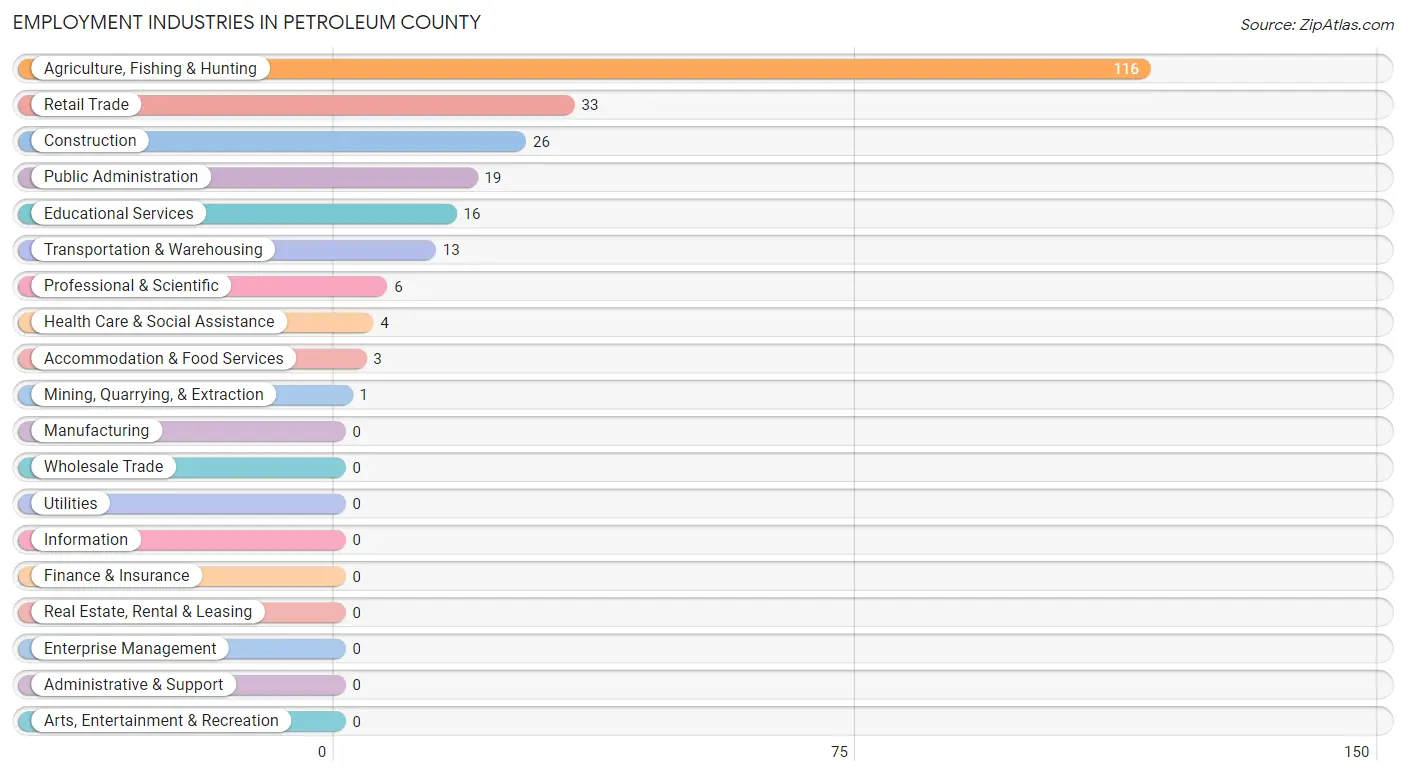
Employment Industries in Petroleum County
The major employment industries in Petroleum County include Agriculture, Fishing & Hunting (116 | 48.9%), Retail Trade (33 | 13.9%), Construction (26 | 11.0%), Public Administration (19 | 8.0%), and Educational Services (16 | 6.8%).
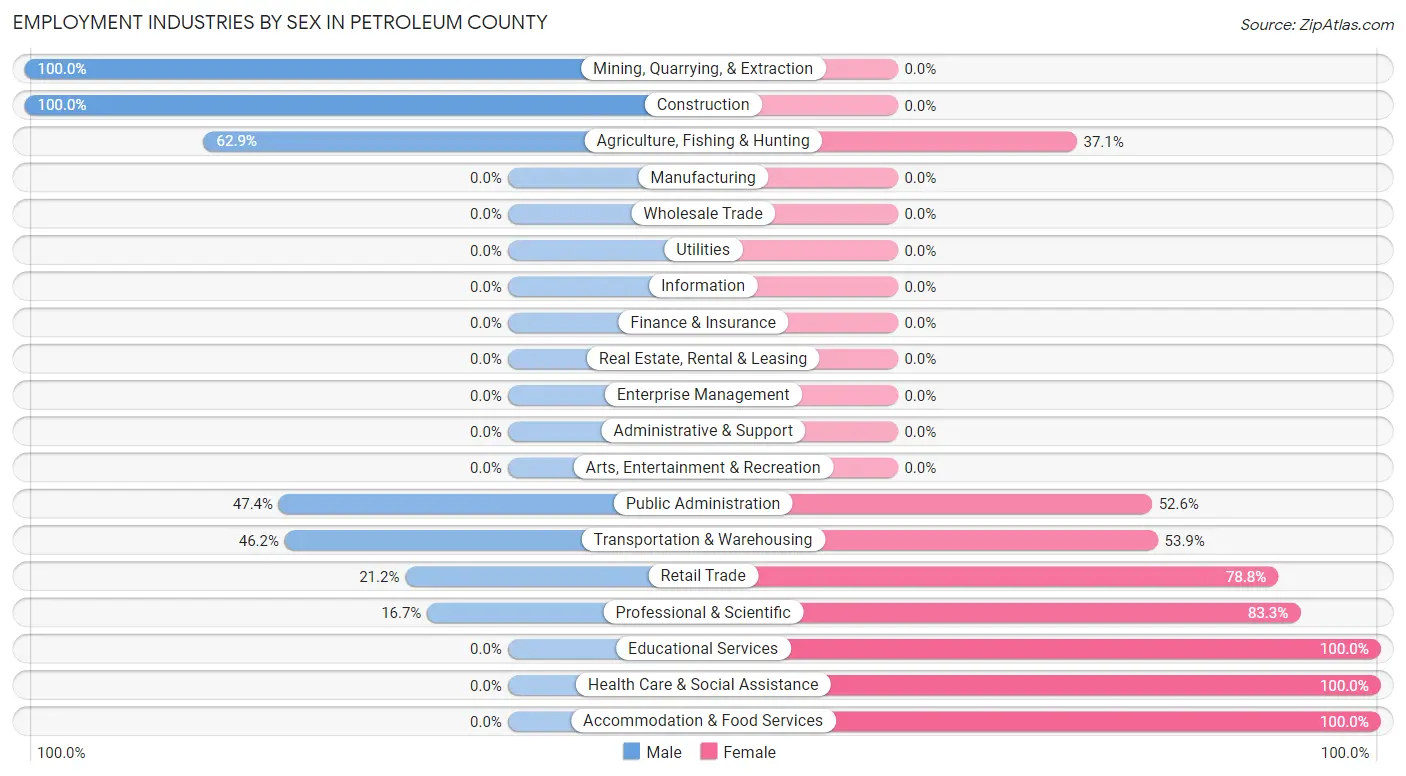
Employment Industries by Sex in Petroleum County
The Petroleum County industries that see more men than women are Mining, Quarrying, & Extraction (100.0%), Construction (100.0%), and Agriculture, Fishing & Hunting (62.9%), whereas the industries that tend to have a higher number of women are Educational Services (100.0%), Health Care & Social Assistance (100.0%), and Accommodation & Food Services (100.0%).
| Industry | Male | Female |
| Agriculture, Fishing & Hunting | 73 (62.9%) | 43 (37.1%) |
| Mining, Quarrying, & Extraction | 1 (100.0%) | 0 (0.0%) |
| Construction | 26 (100.0%) | 0 (0.0%) |
| Manufacturing | 0 (0.0%) | 0 (0.0%) |
| Wholesale Trade | 0 (0.0%) | 0 (0.0%) |
| Retail Trade | 7 (21.2%) | 26 (78.8%) |
| Transportation & Warehousing | 6 (46.2%) | 7 (53.8%) |
| Utilities | 0 (0.0%) | 0 (0.0%) |
| Information | 0 (0.0%) | 0 (0.0%) |
| Finance & Insurance | 0 (0.0%) | 0 (0.0%) |
| Real Estate, Rental & Leasing | 0 (0.0%) | 0 (0.0%) |
| Professional & Scientific | 1 (16.7%) | 5 (83.3%) |
| Enterprise Management | 0 (0.0%) | 0 (0.0%) |
| Administrative & Support | 0 (0.0%) | 0 (0.0%) |
| Educational Services | 0 (0.0%) | 16 (100.0%) |
| Health Care & Social Assistance | 0 (0.0%) | 4 (100.0%) |
| Arts, Entertainment & Recreation | 0 (0.0%) | 0 (0.0%) |
| Accommodation & Food Services | 0 (0.0%) | 3 (100.0%) |
| Public Administration | 9 (47.4%) | 10 (52.6%) |
| Total | 123 (51.9%) | 114 (48.1%) |
Education in Petroleum County
School Enrollment in Petroleum County
The most common levels of schooling among the 50 students in Petroleum County are high school (15 | 30.0%), elementary school (12 | 24.0%), and college / undergraduate (7 | 14.0%).
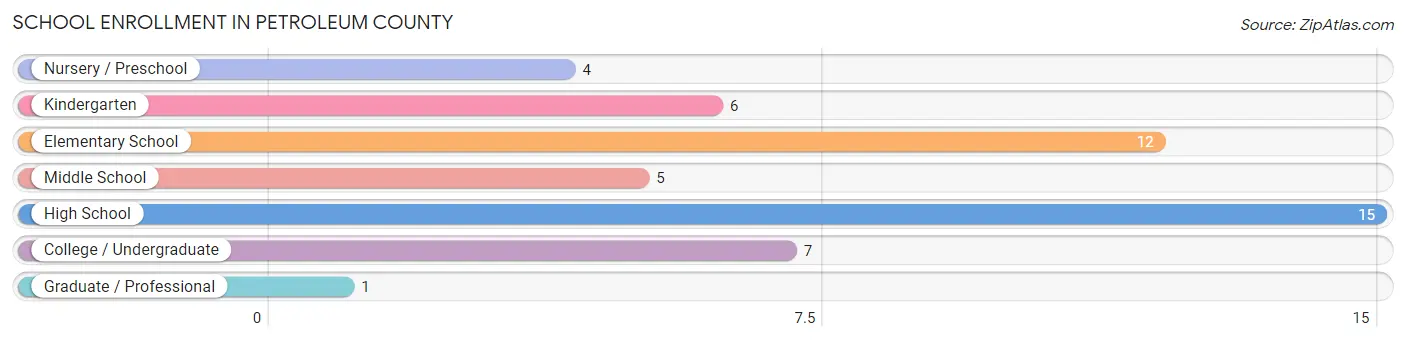
| School Level | # Students | % Students |
| Nursery / Preschool | 4 | 8.0% |
| Kindergarten | 6 | 12.0% |
| Elementary School | 12 | 24.0% |
| Middle School | 5 | 10.0% |
| High School | 15 | 30.0% |
| College / Undergraduate | 7 | 14.0% |
| Graduate / Professional | 1 | 2.0% |
| Total | 50 | 100.0% |
School Enrollment by Age by Funding Source in Petroleum County
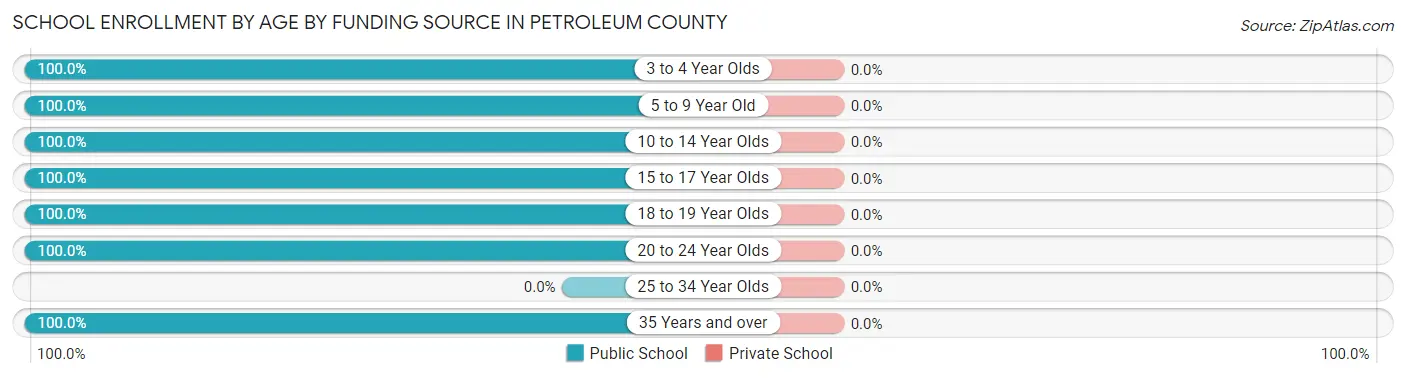
| Age Bracket | Public School | Private School |
| 3 to 4 Year Olds | 4 (100.0%) | 0 (0.0%) |
| 5 to 9 Year Old | 16 (100.0%) | 0 (0.0%) |
| 10 to 14 Year Olds | 14 (100.0%) | 0 (0.0%) |
| 15 to 17 Year Olds | 3 (100.0%) | 0 (0.0%) |
| 18 to 19 Year Olds | 5 (100.0%) | 0 (0.0%) |
| 20 to 24 Year Olds | 7 (100.0%) | 0 (0.0%) |
| 25 to 34 Year Olds | 0 (0.0%) | 0 (0.0%) |
| 35 Years and over | 1 (100.0%) | 0 (0.0%) |
| Total | 50 (100.0%) | 0 (0.0%) |
Educational Attainment by Field of Study in Petroleum County
Education (20 | 24.7%), bio, nature & agricultural (18 | 22.2%), visual & performing arts (12 | 14.8%), business (11 | 13.6%), and arts & humanities (8 | 9.9%) are the most common fields of study among 81 individuals in Petroleum County who have obtained a bachelor's degree or higher.
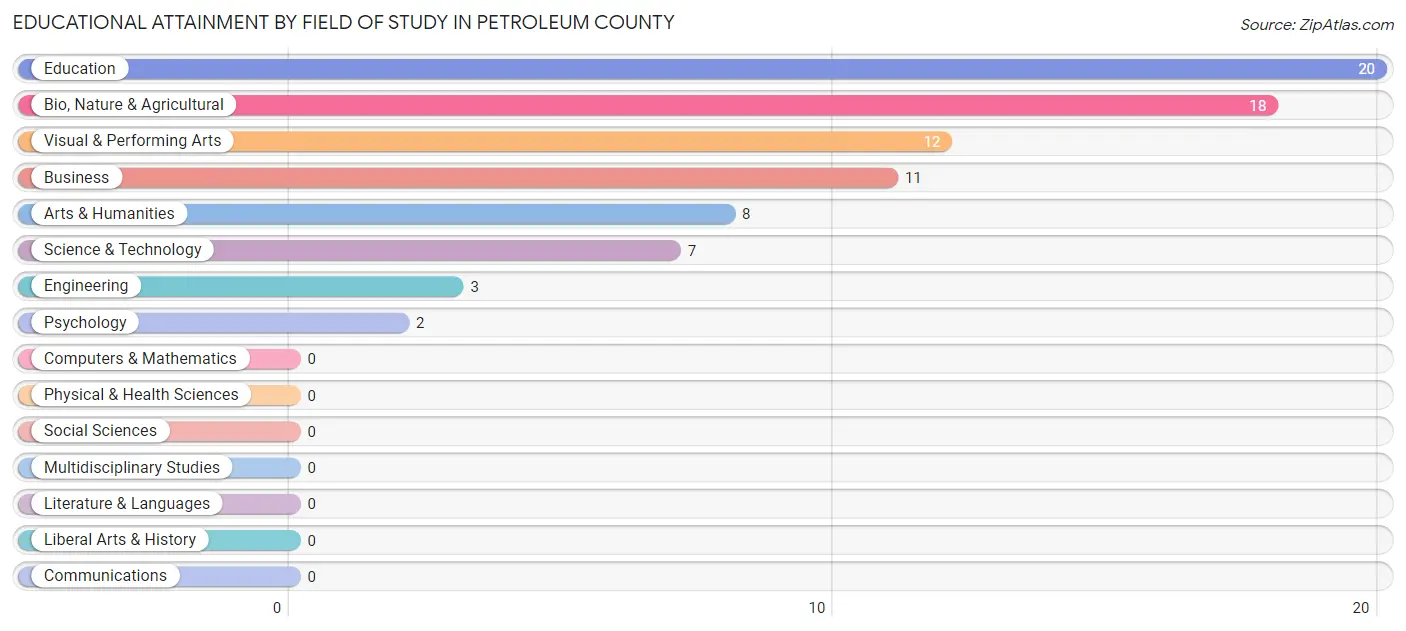
| Field of Study | # Graduates | % Graduates |
| Computers & Mathematics | 0 | 0.0% |
| Bio, Nature & Agricultural | 18 | 22.2% |
| Physical & Health Sciences | 0 | 0.0% |
| Psychology | 2 | 2.5% |
| Social Sciences | 0 | 0.0% |
| Engineering | 3 | 3.7% |
| Multidisciplinary Studies | 0 | 0.0% |
| Science & Technology | 7 | 8.6% |
| Business | 11 | 13.6% |
| Education | 20 | 24.7% |
| Literature & Languages | 0 | 0.0% |
| Liberal Arts & History | 0 | 0.0% |
| Visual & Performing Arts | 12 | 14.8% |
| Communications | 0 | 0.0% |
| Arts & Humanities | 8 | 9.9% |
| Total | 81 | 100.0% |
Transportation & Commute in Petroleum County
Vehicle Availability by Sex in Petroleum County
The most prevalent vehicle ownership categories in Petroleum County are males with 2 vehicles (55, accounting for 44.7%) and females with 2 vehicles (53, making up 49.1%).
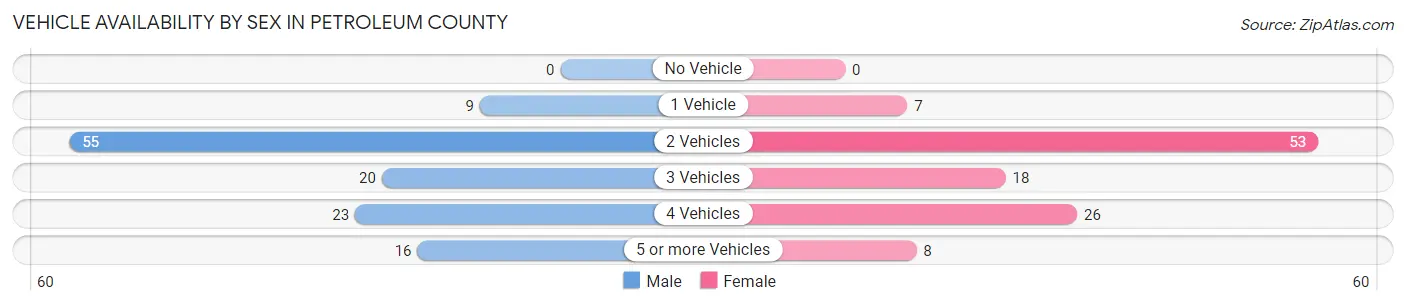
| Vehicles Available | Male | Female |
| No Vehicle | 0 (0.0%) | 0 (0.0%) |
| 1 Vehicle | 9 (7.3%) | 7 (6.2%) |
| 2 Vehicles | 55 (44.7%) | 53 (47.3%) |
| 3 Vehicles | 20 (16.3%) | 18 (16.1%) |
| 4 Vehicles | 23 (18.7%) | 26 (23.2%) |
| 5 or more Vehicles | 16 (13.0%) | 8 (7.1%) |
| Total | 123 (100.0%) | 112 (100.0%) |
Commute Time in Petroleum County
The most frequently occuring commute durations in Petroleum County are 5 to 9 minutes (52 commuters, 30.4%), less than 5 minutes (46 commuters, 26.9%), and 10 to 14 minutes (14 commuters, 8.2%).
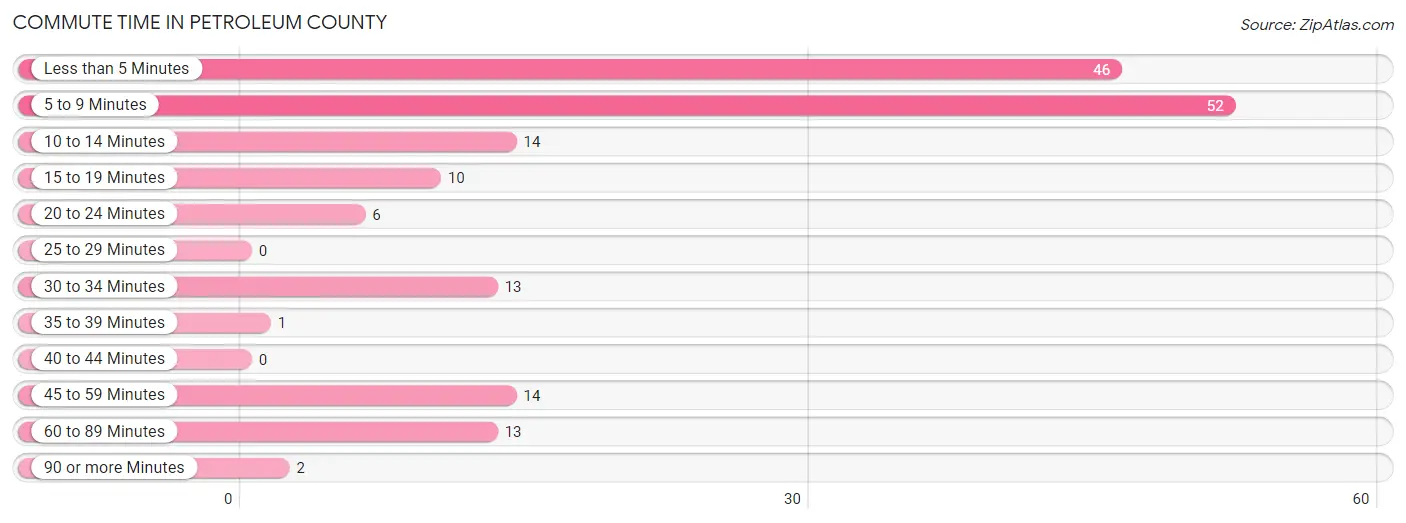
| Commute Time | # Commuters | % Commuters |
| Less than 5 Minutes | 46 | 26.9% |
| 5 to 9 Minutes | 52 | 30.4% |
| 10 to 14 Minutes | 14 | 8.2% |
| 15 to 19 Minutes | 10 | 5.9% |
| 20 to 24 Minutes | 6 | 3.5% |
| 25 to 29 Minutes | 0 | 0.0% |
| 30 to 34 Minutes | 13 | 7.6% |
| 35 to 39 Minutes | 1 | 0.6% |
| 40 to 44 Minutes | 0 | 0.0% |
| 45 to 59 Minutes | 14 | 8.2% |
| 60 to 89 Minutes | 13 | 7.6% |
| 90 or more Minutes | 2 | 1.2% |
Commute Time by Sex in Petroleum County
The most common commute times in Petroleum County are 5 to 9 minutes (31 commuters, 38.3%) for males and less than 5 minutes (27 commuters, 30.0%) for females.
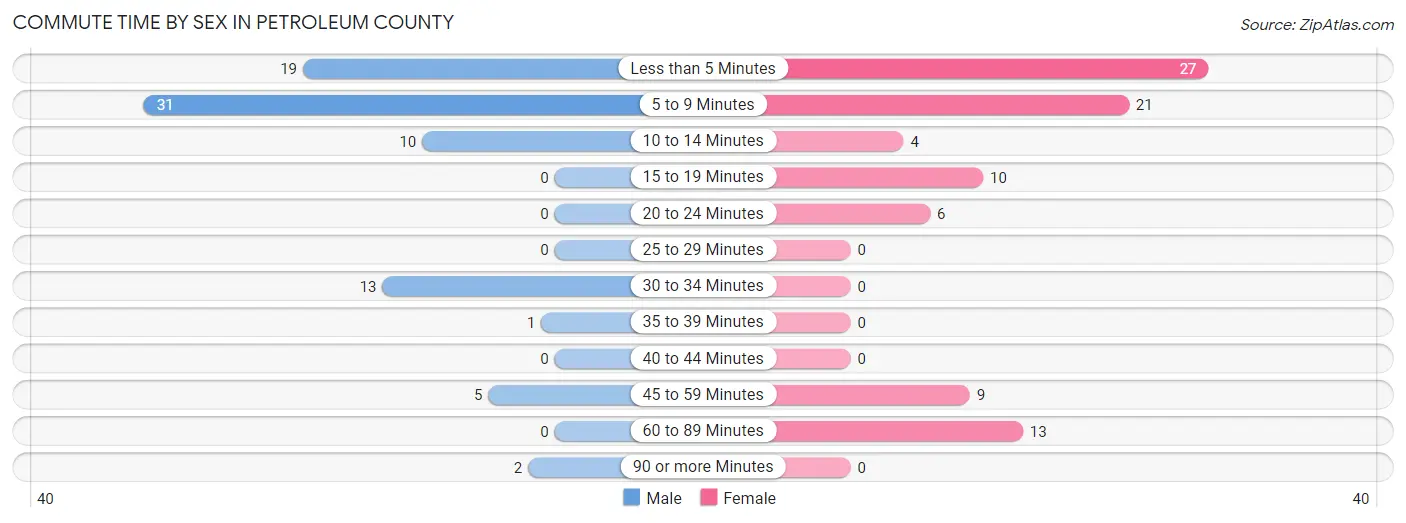
| Commute Time | Male | Female |
| Less than 5 Minutes | 19 (23.5%) | 27 (30.0%) |
| 5 to 9 Minutes | 31 (38.3%) | 21 (23.3%) |
| 10 to 14 Minutes | 10 (12.3%) | 4 (4.4%) |
| 15 to 19 Minutes | 0 (0.0%) | 10 (11.1%) |
| 20 to 24 Minutes | 0 (0.0%) | 6 (6.7%) |
| 25 to 29 Minutes | 0 (0.0%) | 0 (0.0%) |
| 30 to 34 Minutes | 13 (16.1%) | 0 (0.0%) |
| 35 to 39 Minutes | 1 (1.2%) | 0 (0.0%) |
| 40 to 44 Minutes | 0 (0.0%) | 0 (0.0%) |
| 45 to 59 Minutes | 5 (6.2%) | 9 (10.0%) |
| 60 to 89 Minutes | 0 (0.0%) | 13 (14.4%) |
| 90 or more Minutes | 2 (2.5%) | 0 (0.0%) |
Time of Departure to Work by Sex in Petroleum County
The most frequent times of departure to work in Petroleum County are 6:30 AM to 6:59 AM (22, 27.2%) for males and 7:30 AM to 7:59 AM (27, 30.0%) for females.
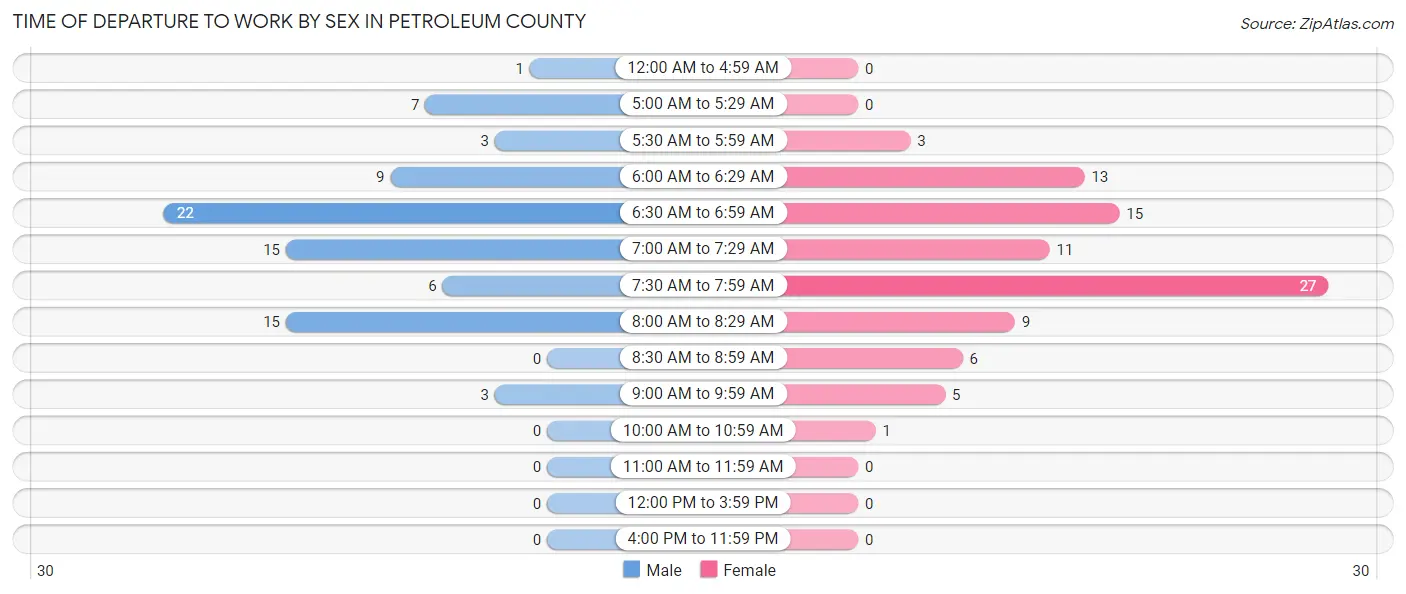
| Time of Departure | Male | Female |
| 12:00 AM to 4:59 AM | 1 (1.2%) | 0 (0.0%) |
| 5:00 AM to 5:29 AM | 7 (8.6%) | 0 (0.0%) |
| 5:30 AM to 5:59 AM | 3 (3.7%) | 3 (3.3%) |
| 6:00 AM to 6:29 AM | 9 (11.1%) | 13 (14.4%) |
| 6:30 AM to 6:59 AM | 22 (27.2%) | 15 (16.7%) |
| 7:00 AM to 7:29 AM | 15 (18.5%) | 11 (12.2%) |
| 7:30 AM to 7:59 AM | 6 (7.4%) | 27 (30.0%) |
| 8:00 AM to 8:29 AM | 15 (18.5%) | 9 (10.0%) |
| 8:30 AM to 8:59 AM | 0 (0.0%) | 6 (6.7%) |
| 9:00 AM to 9:59 AM | 3 (3.7%) | 5 (5.6%) |
| 10:00 AM to 10:59 AM | 0 (0.0%) | 1 (1.1%) |
| 11:00 AM to 11:59 AM | 0 (0.0%) | 0 (0.0%) |
| 12:00 PM to 3:59 PM | 0 (0.0%) | 0 (0.0%) |
| 4:00 PM to 11:59 PM | 0 (0.0%) | 0 (0.0%) |
| Total | 81 (100.0%) | 90 (100.0%) |
Housing Occupancy in Petroleum County
Occupancy by Ownership in Petroleum County
Of the total 189 dwellings in Petroleum County, owner-occupied units account for 133 (70.4%), while renter-occupied units make up 56 (29.6%).
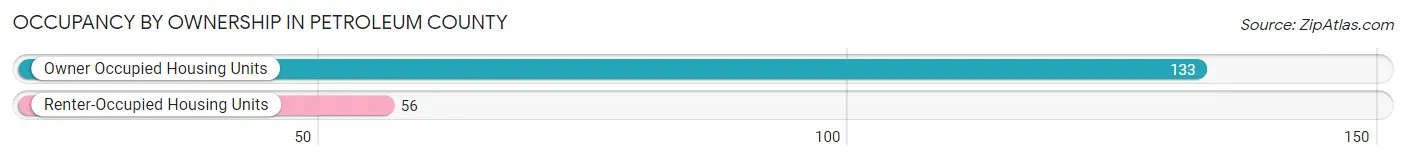
| Occupancy | # Housing Units | % Housing Units |
| Owner Occupied Housing Units | 133 | 70.4% |
| Renter-Occupied Housing Units | 56 | 29.6% |
| Total Occupied Housing Units | 189 | 100.0% |
Occupancy by Household Size in Petroleum County
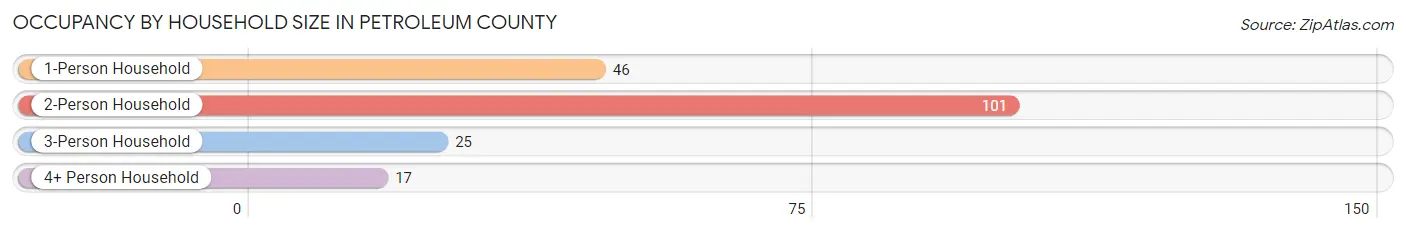
| Household Size | # Housing Units | % Housing Units |
| 1-Person Household | 46 | 24.3% |
| 2-Person Household | 101 | 53.4% |
| 3-Person Household | 25 | 13.2% |
| 4+ Person Household | 17 | 9.0% |
| Total Housing Units | 189 | 100.0% |
Occupancy by Ownership by Household Size in Petroleum County
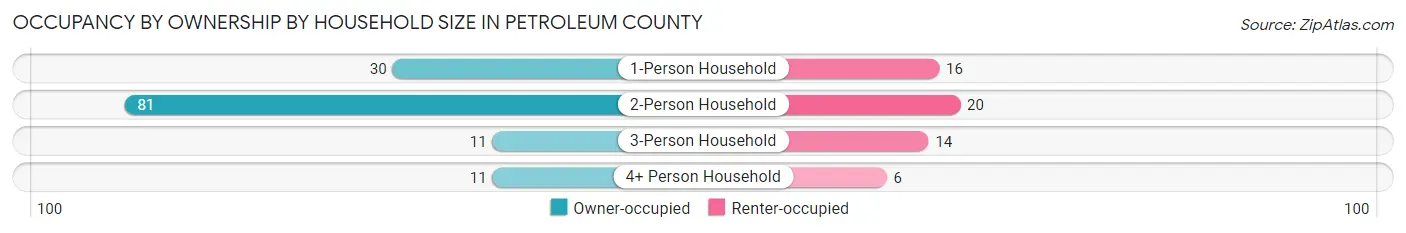
| Household Size | Owner-occupied | Renter-occupied |
| 1-Person Household | 30 (65.2%) | 16 (34.8%) |
| 2-Person Household | 81 (80.2%) | 20 (19.8%) |
| 3-Person Household | 11 (44.0%) | 14 (56.0%) |
| 4+ Person Household | 11 (64.7%) | 6 (35.3%) |
| Total Housing Units | 133 (70.4%) | 56 (29.6%) |
Occupancy by Educational Attainment in Petroleum County
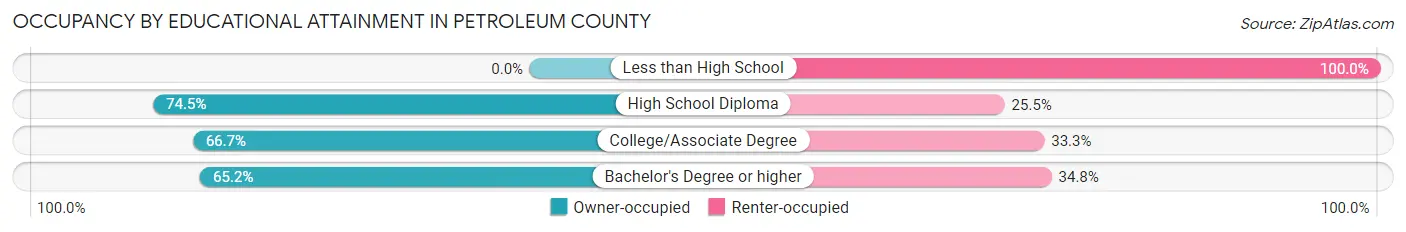
| Household Size | Owner-occupied | Renter-occupied |
| Less than High School | 0 (0.0%) | 1 (100.0%) |
| High School Diploma | 79 (74.5%) | 27 (25.5%) |
| College/Associate Degree | 24 (66.7%) | 12 (33.3%) |
| Bachelor's Degree or higher | 30 (65.2%) | 16 (34.8%) |
Occupancy by Age of Householder in Petroleum County
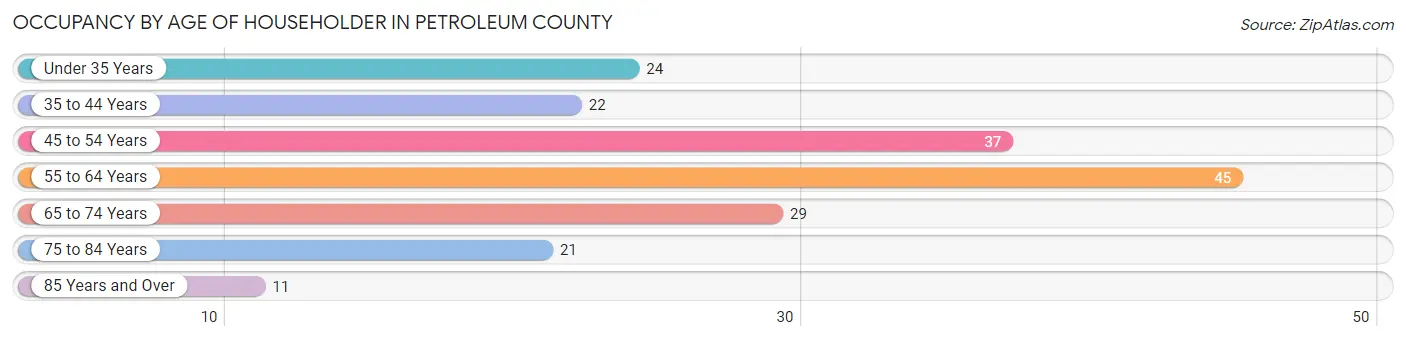
| Age Bracket | # Households | % Households |
| Under 35 Years | 24 | 12.7% |
| 35 to 44 Years | 22 | 11.6% |
| 45 to 54 Years | 37 | 19.6% |
| 55 to 64 Years | 45 | 23.8% |
| 65 to 74 Years | 29 | 15.3% |
| 75 to 84 Years | 21 | 11.1% |
| 85 Years and Over | 11 | 5.8% |
| Total | 189 | 100.0% |
Housing Finances in Petroleum County
Median Income by Occupancy in Petroleum County
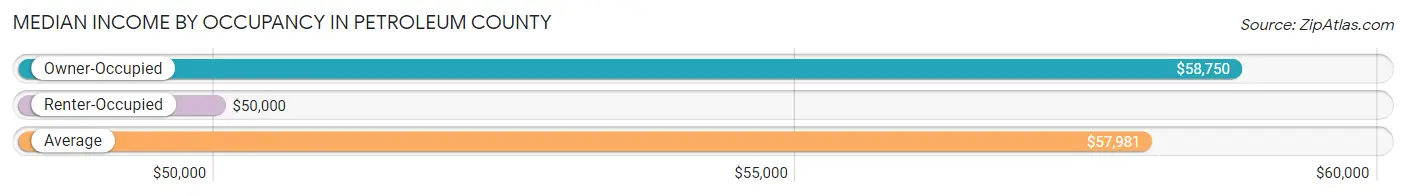
| Occupancy Type | # Households | Median Income |
| Owner-Occupied | 133 (70.4%) | $58,750 |
| Renter-Occupied | 56 (29.6%) | $50,000 |
| Average | 189 (100.0%) | $57,981 |
Occupancy by Householder Income Bracket in Petroleum County
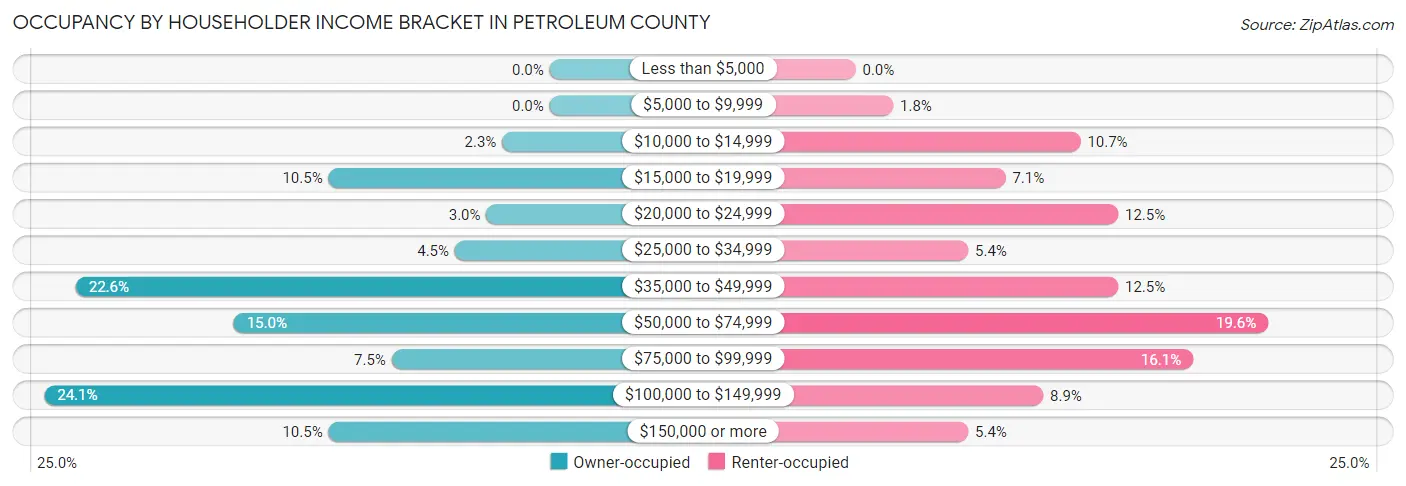
| Income Bracket | Owner-occupied | Renter-occupied |
| Less than $5,000 | 0 (0.0%) | 0 (0.0%) |
| $5,000 to $9,999 | 0 (0.0%) | 1 (1.8%) |
| $10,000 to $14,999 | 3 (2.3%) | 6 (10.7%) |
| $15,000 to $19,999 | 14 (10.5%) | 4 (7.1%) |
| $20,000 to $24,999 | 4 (3.0%) | 7 (12.5%) |
| $25,000 to $34,999 | 6 (4.5%) | 3 (5.4%) |
| $35,000 to $49,999 | 30 (22.6%) | 7 (12.5%) |
| $50,000 to $74,999 | 20 (15.0%) | 11 (19.6%) |
| $75,000 to $99,999 | 10 (7.5%) | 9 (16.1%) |
| $100,000 to $149,999 | 32 (24.1%) | 5 (8.9%) |
| $150,000 or more | 14 (10.5%) | 3 (5.4%) |
| Total | 133 (100.0%) | 56 (100.0%) |
Monthly Housing Cost Tiers in Petroleum County
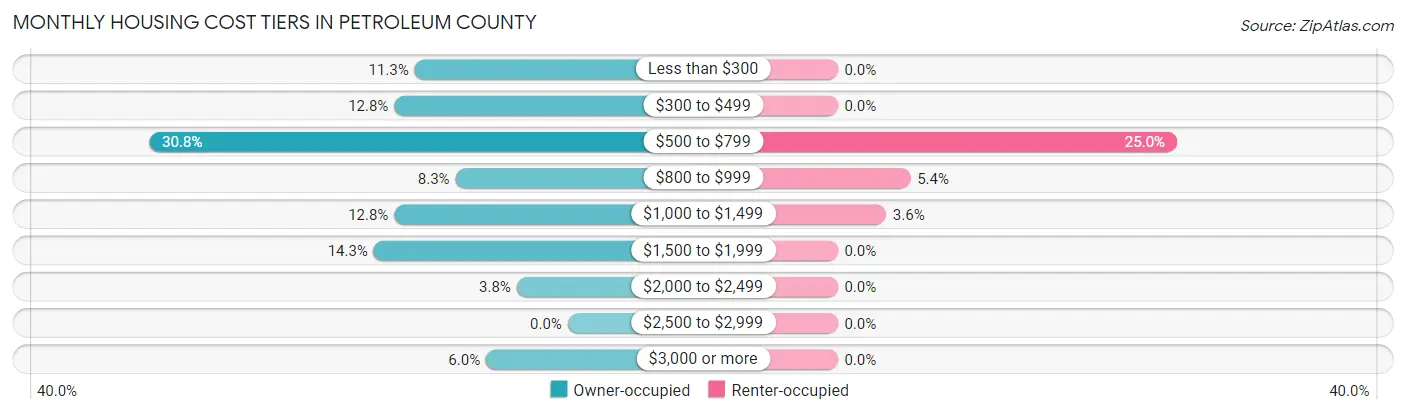
| Monthly Cost | Owner-occupied | Renter-occupied |
| Less than $300 | 15 (11.3%) | 0 (0.0%) |
| $300 to $499 | 17 (12.8%) | 0 (0.0%) |
| $500 to $799 | 41 (30.8%) | 14 (25.0%) |
| $800 to $999 | 11 (8.3%) | 3 (5.4%) |
| $1,000 to $1,499 | 17 (12.8%) | 2 (3.6%) |
| $1,500 to $1,999 | 19 (14.3%) | 0 (0.0%) |
| $2,000 to $2,499 | 5 (3.8%) | 0 (0.0%) |
| $2,500 to $2,999 | 0 (0.0%) | 0 (0.0%) |
| $3,000 or more | 8 (6.0%) | 0 (0.0%) |
| Total | 133 (100.0%) | 56 (100.0%) |
Physical Housing Characteristics in Petroleum County
Housing Structures in Petroleum County
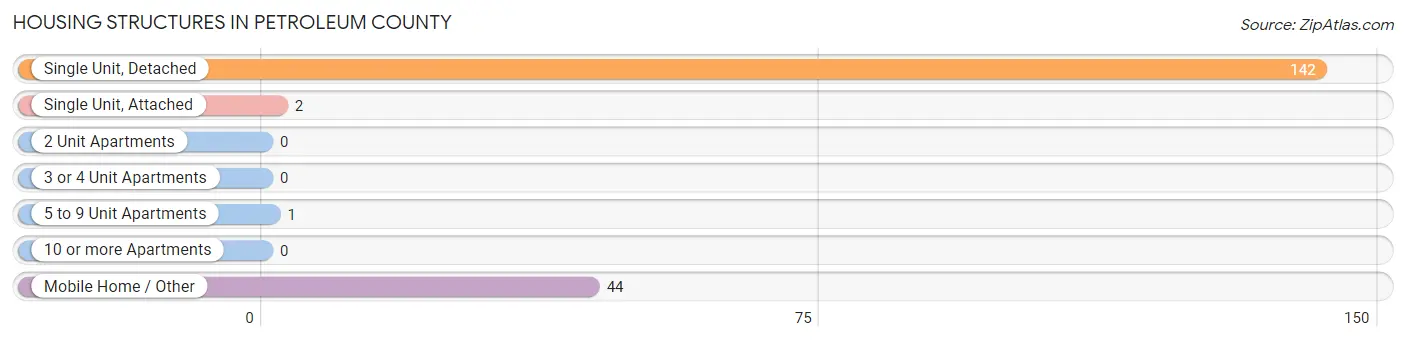
| Structure Type | # Housing Units | % Housing Units |
| Single Unit, Detached | 142 | 75.1% |
| Single Unit, Attached | 2 | 1.1% |
| 2 Unit Apartments | 0 | 0.0% |
| 3 or 4 Unit Apartments | 0 | 0.0% |
| 5 to 9 Unit Apartments | 1 | 0.5% |
| 10 or more Apartments | 0 | 0.0% |
| Mobile Home / Other | 44 | 23.3% |
| Total | 189 | 100.0% |
Housing Structures by Occupancy in Petroleum County
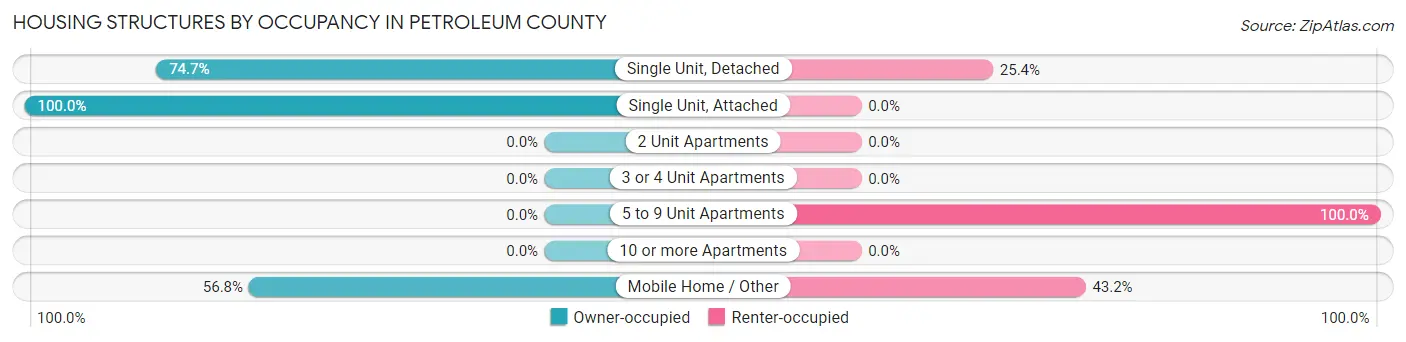
| Structure Type | Owner-occupied | Renter-occupied |
| Single Unit, Detached | 106 (74.7%) | 36 (25.4%) |
| Single Unit, Attached | 2 (100.0%) | 0 (0.0%) |
| 2 Unit Apartments | 0 (0.0%) | 0 (0.0%) |
| 3 or 4 Unit Apartments | 0 (0.0%) | 0 (0.0%) |
| 5 to 9 Unit Apartments | 0 (0.0%) | 1 (100.0%) |
| 10 or more Apartments | 0 (0.0%) | 0 (0.0%) |
| Mobile Home / Other | 25 (56.8%) | 19 (43.2%) |
| Total | 133 (70.4%) | 56 (29.6%) |
Housing Structures by Number of Rooms in Petroleum County
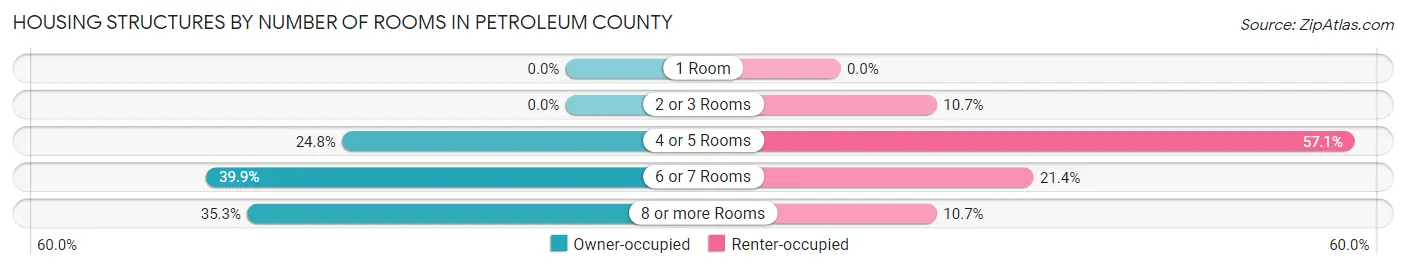
| Number of Rooms | Owner-occupied | Renter-occupied |
| 1 Room | 0 (0.0%) | 0 (0.0%) |
| 2 or 3 Rooms | 0 (0.0%) | 6 (10.7%) |
| 4 or 5 Rooms | 33 (24.8%) | 32 (57.1%) |
| 6 or 7 Rooms | 53 (39.9%) | 12 (21.4%) |
| 8 or more Rooms | 47 (35.3%) | 6 (10.7%) |
| Total | 133 (100.0%) | 56 (100.0%) |
Housing Structure by Heating Type in Petroleum County
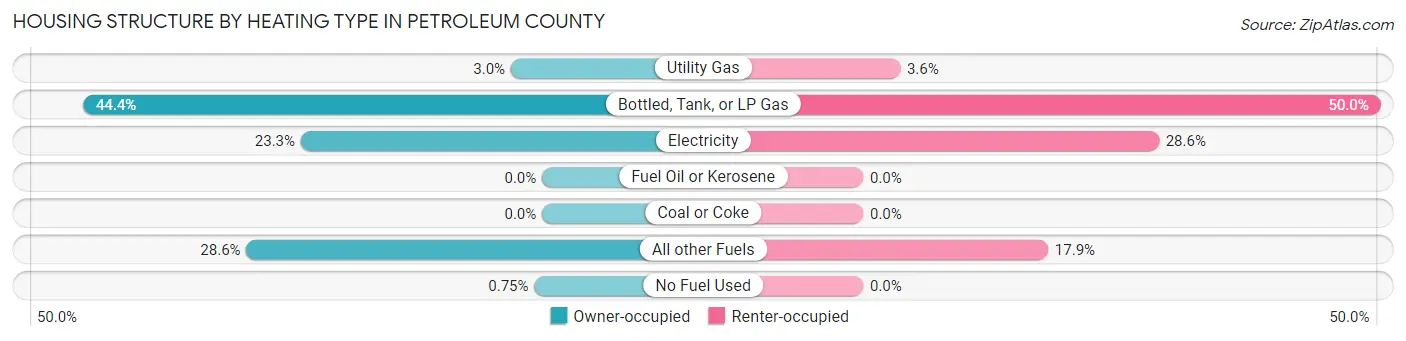
| Heating Type | Owner-occupied | Renter-occupied |
| Utility Gas | 4 (3.0%) | 2 (3.6%) |
| Bottled, Tank, or LP Gas | 59 (44.4%) | 28 (50.0%) |
| Electricity | 31 (23.3%) | 16 (28.6%) |
| Fuel Oil or Kerosene | 0 (0.0%) | 0 (0.0%) |
| Coal or Coke | 0 (0.0%) | 0 (0.0%) |
| All other Fuels | 38 (28.6%) | 10 (17.9%) |
| No Fuel Used | 1 (0.7%) | 0 (0.0%) |
| Total | 133 (100.0%) | 56 (100.0%) |
Household Vehicle Usage in Petroleum County
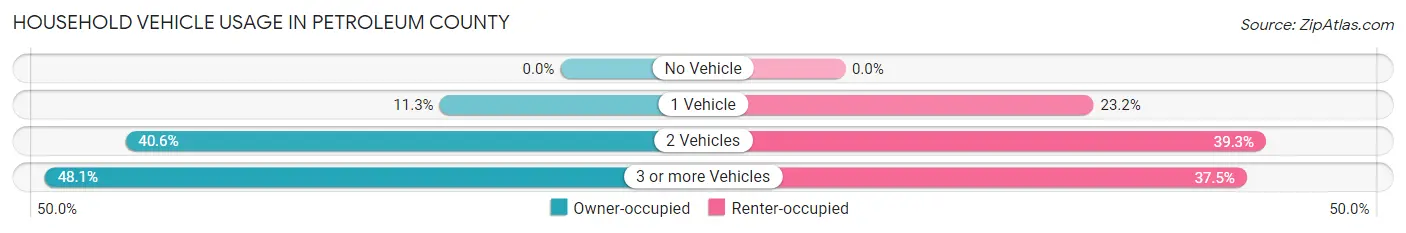
| Vehicles per Household | Owner-occupied | Renter-occupied |
| No Vehicle | 0 (0.0%) | 0 (0.0%) |
| 1 Vehicle | 15 (11.3%) | 13 (23.2%) |
| 2 Vehicles | 54 (40.6%) | 22 (39.3%) |
| 3 or more Vehicles | 64 (48.1%) | 21 (37.5%) |
| Total | 133 (100.0%) | 56 (100.0%) |
Real Estate & Mortgages in Petroleum County
Real Estate and Mortgage Overview in Petroleum County
| Characteristic | Without Mortgage | With Mortgage |
| Housing Units | 79 | 54 |
| Median Property Value | $158,200 | $0 |
| Median Household Income | $40,893 | $8 |
| Monthly Housing Costs | $536 | $8 |
| Real Estate Taxes | $992 | $0 |
Property Value by Mortgage Status in Petroleum County
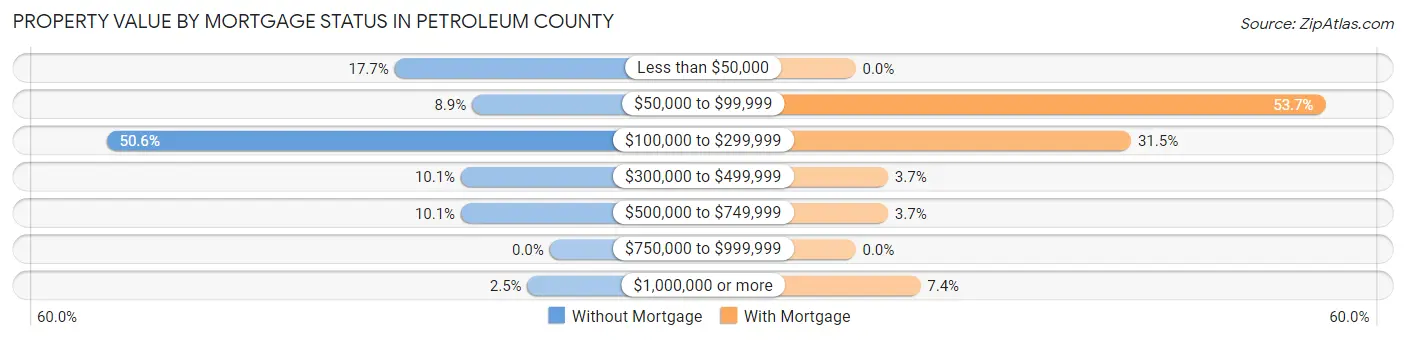
| Property Value | Without Mortgage | With Mortgage |
| Less than $50,000 | 14 (17.7%) | 0 (0.0%) |
| $50,000 to $99,999 | 7 (8.9%) | 29 (53.7%) |
| $100,000 to $299,999 | 40 (50.6%) | 17 (31.5%) |
| $300,000 to $499,999 | 8 (10.1%) | 2 (3.7%) |
| $500,000 to $749,999 | 8 (10.1%) | 2 (3.7%) |
| $750,000 to $999,999 | 0 (0.0%) | 0 (0.0%) |
| $1,000,000 or more | 2 (2.5%) | 4 (7.4%) |
| Total | 79 (100.0%) | 54 (100.0%) |
Household Income by Mortgage Status in Petroleum County
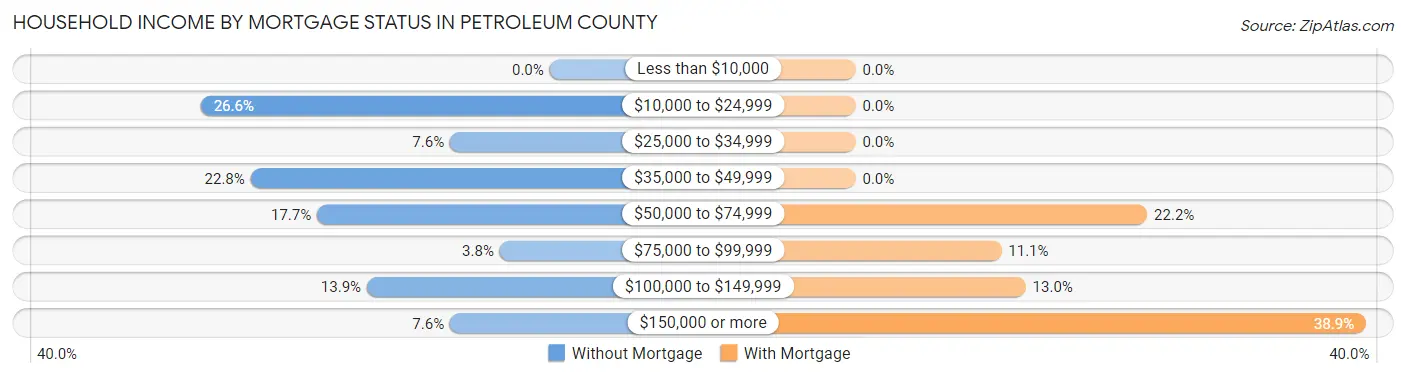
| Household Income | Without Mortgage | With Mortgage |
| Less than $10,000 | 0 (0.0%) | 0 (0.0%) |
| $10,000 to $24,999 | 21 (26.6%) | 0 (0.0%) |
| $25,000 to $34,999 | 6 (7.6%) | 0 (0.0%) |
| $35,000 to $49,999 | 18 (22.8%) | 0 (0.0%) |
| $50,000 to $74,999 | 14 (17.7%) | 12 (22.2%) |
| $75,000 to $99,999 | 3 (3.8%) | 6 (11.1%) |
| $100,000 to $149,999 | 11 (13.9%) | 7 (13.0%) |
| $150,000 or more | 6 (7.6%) | 21 (38.9%) |
| Total | 79 (100.0%) | 54 (100.0%) |
Property Value to Household Income Ratio in Petroleum County
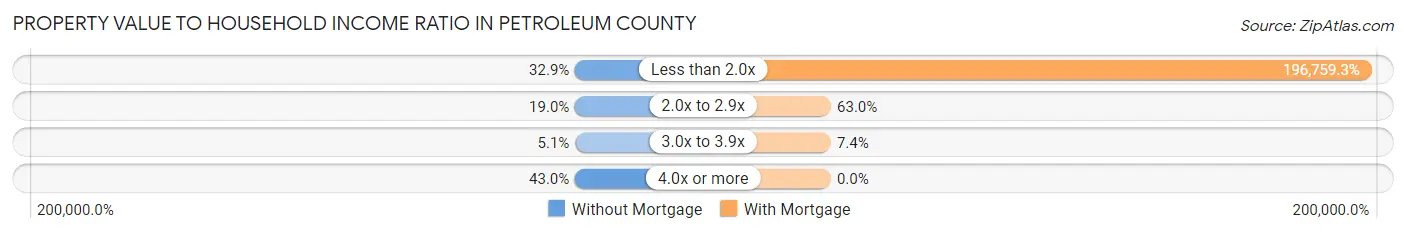
| Value-to-Income Ratio | Without Mortgage | With Mortgage |
| Less than 2.0x | 26 (32.9%) | 106,250 (196,759.3%) |
| 2.0x to 2.9x | 15 (19.0%) | 34 (63.0%) |
| 3.0x to 3.9x | 4 (5.1%) | 4 (7.4%) |
| 4.0x or more | 34 (43.0%) | 0 (0.0%) |
| Total | 79 (100.0%) | 54 (100.0%) |
Real Estate Taxes by Mortgage Status in Petroleum County
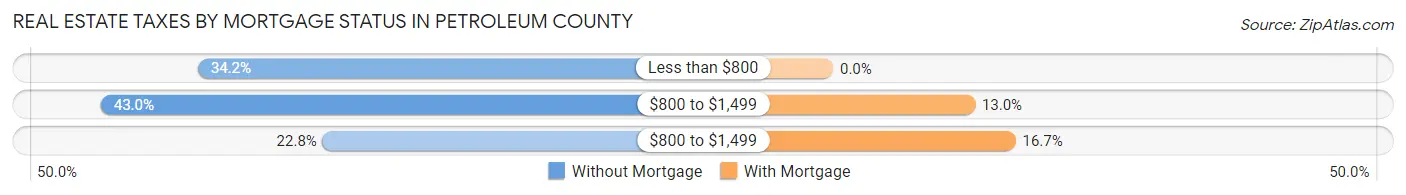
| Property Taxes | Without Mortgage | With Mortgage |
| Less than $800 | 27 (34.2%) | 0 (0.0%) |
| $800 to $1,499 | 34 (43.0%) | 7 (13.0%) |
| $800 to $1,499 | 18 (22.8%) | 9 (16.7%) |
| Total | 79 (100.0%) | 54 (100.0%) |
Health & Disability in Petroleum County
Health Insurance Coverage by Age in Petroleum County
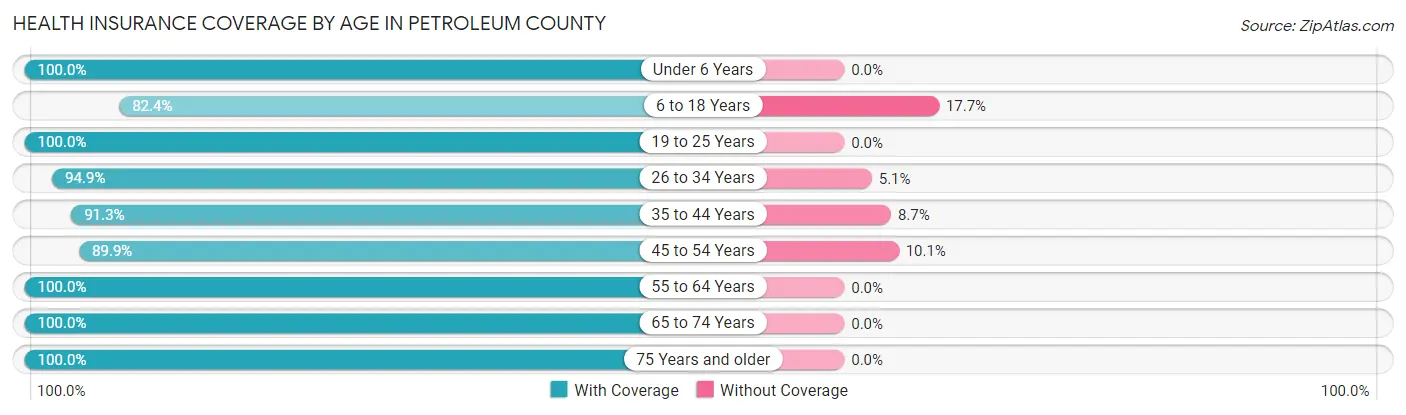
| Age Bracket | With Coverage | Without Coverage |
| Under 6 Years | 43 (100.0%) | 0 (0.0%) |
| 6 to 18 Years | 28 (82.4%) | 6 (17.6%) |
| 19 to 25 Years | 16 (100.0%) | 0 (0.0%) |
| 26 to 34 Years | 37 (94.9%) | 2 (5.1%) |
| 35 to 44 Years | 42 (91.3%) | 4 (8.7%) |
| 45 to 54 Years | 62 (89.9%) | 7 (10.1%) |
| 55 to 64 Years | 78 (100.0%) | 0 (0.0%) |
| 65 to 74 Years | 45 (100.0%) | 0 (0.0%) |
| 75 Years and older | 46 (100.0%) | 0 (0.0%) |
| Total | 397 (95.4%) | 19 (4.6%) |
Health Insurance Coverage by Citizenship Status in Petroleum County
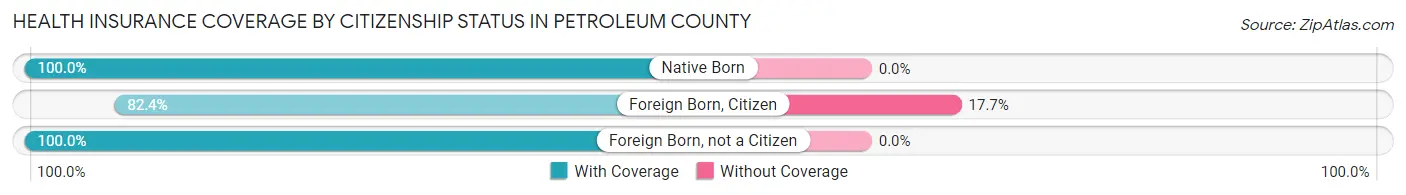
| Citizenship Status | With Coverage | Without Coverage |
| Native Born | 43 (100.0%) | 0 (0.0%) |
| Foreign Born, Citizen | 28 (82.4%) | 6 (17.6%) |
| Foreign Born, not a Citizen | 16 (100.0%) | 0 (0.0%) |
Health Insurance Coverage by Household Income in Petroleum County
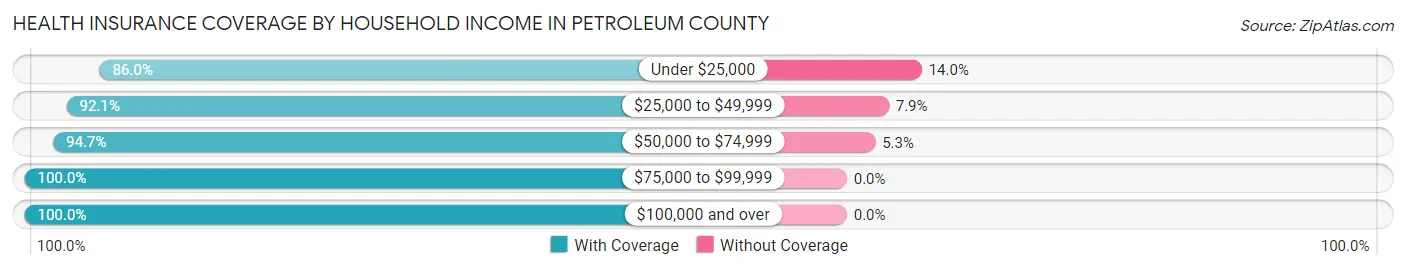
| Household Income | With Coverage | Without Coverage |
| Under $25,000 | 49 (86.0%) | 8 (14.0%) |
| $25,000 to $49,999 | 82 (92.1%) | 7 (7.9%) |
| $50,000 to $74,999 | 71 (94.7%) | 4 (5.3%) |
| $75,000 to $99,999 | 61 (100.0%) | 0 (0.0%) |
| $100,000 and over | 134 (100.0%) | 0 (0.0%) |
Public vs Private Health Insurance Coverage by Age in Petroleum County
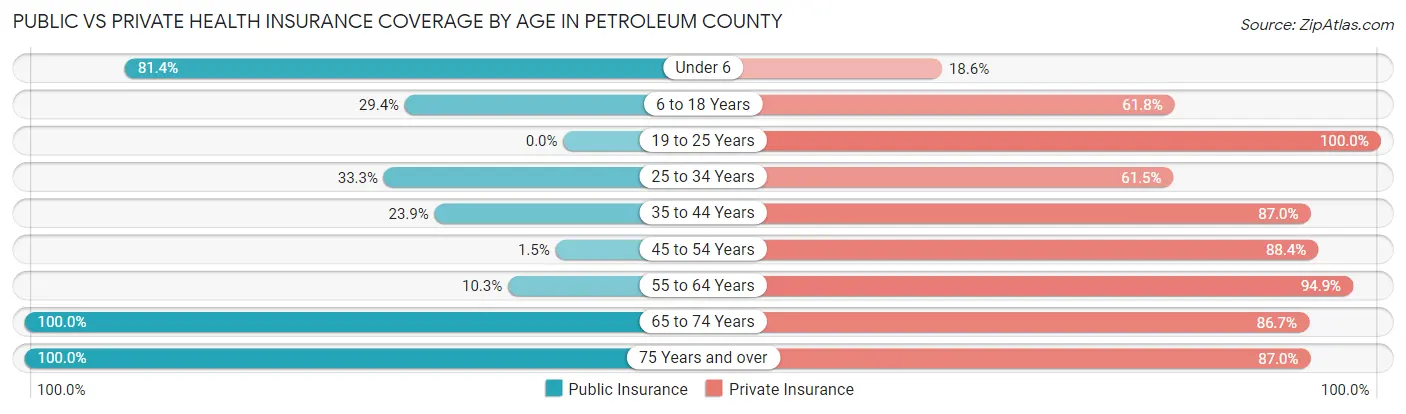
| Age Bracket | Public Insurance | Private Insurance |
| Under 6 | 35 (81.4%) | 8 (18.6%) |
| 6 to 18 Years | 10 (29.4%) | 21 (61.8%) |
| 19 to 25 Years | 0 (0.0%) | 16 (100.0%) |
| 25 to 34 Years | 13 (33.3%) | 24 (61.5%) |
| 35 to 44 Years | 11 (23.9%) | 40 (87.0%) |
| 45 to 54 Years | 1 (1.5%) | 61 (88.4%) |
| 55 to 64 Years | 8 (10.3%) | 74 (94.9%) |
| 65 to 74 Years | 45 (100.0%) | 39 (86.7%) |
| 75 Years and over | 46 (100.0%) | 40 (87.0%) |
| Total | 169 (40.6%) | 323 (77.6%) |
Disability Status by Sex by Age in Petroleum County
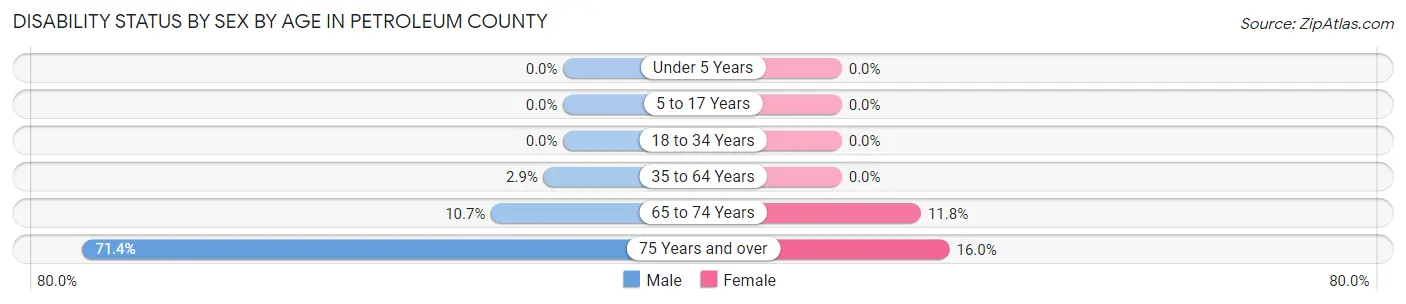
| Age Bracket | Male | Female |
| Under 5 Years | 0 (0.0%) | 0 (0.0%) |
| 5 to 17 Years | 0 (0.0%) | 0 (0.0%) |
| 18 to 34 Years | 0 (0.0%) | 0 (0.0%) |
| 35 to 64 Years | 3 (2.9%) | 0 (0.0%) |
| 65 to 74 Years | 3 (10.7%) | 2 (11.8%) |
| 75 Years and over | 15 (71.4%) | 4 (16.0%) |
Disability Class by Sex by Age in Petroleum County
Disability Class: Hearing Difficulty
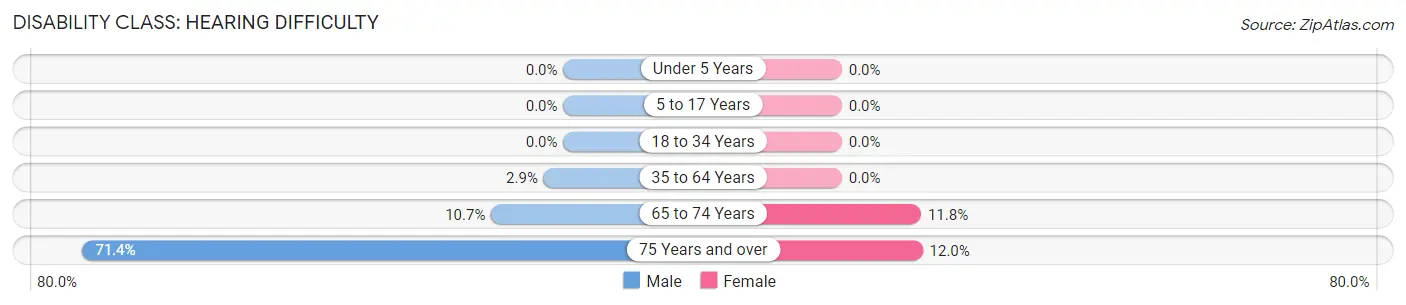
| Age Bracket | Male | Female |
| Under 5 Years | 0 (0.0%) | 0 (0.0%) |
| 5 to 17 Years | 0 (0.0%) | 0 (0.0%) |
| 18 to 34 Years | 0 (0.0%) | 0 (0.0%) |
| 35 to 64 Years | 3 (2.9%) | 0 (0.0%) |
| 65 to 74 Years | 3 (10.7%) | 2 (11.8%) |
| 75 Years and over | 15 (71.4%) | 3 (12.0%) |
Disability Class: Vision Difficulty
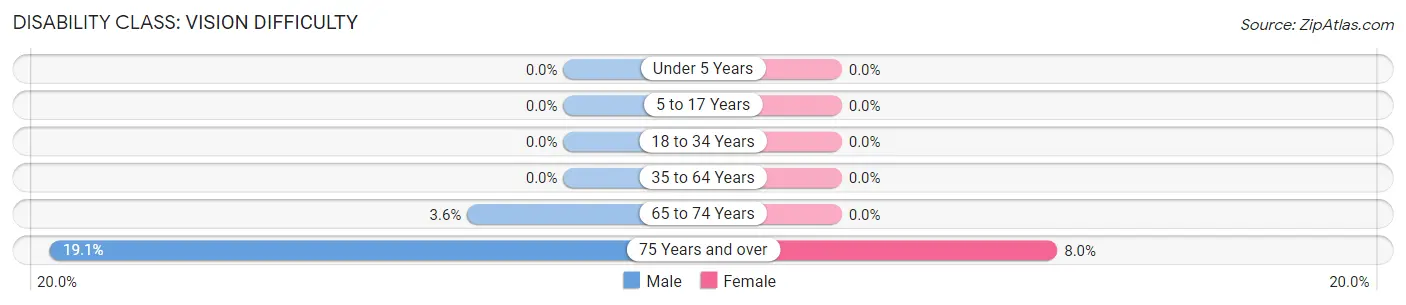
| Age Bracket | Male | Female |
| Under 5 Years | 0 (0.0%) | 0 (0.0%) |
| 5 to 17 Years | 0 (0.0%) | 0 (0.0%) |
| 18 to 34 Years | 0 (0.0%) | 0 (0.0%) |
| 35 to 64 Years | 0 (0.0%) | 0 (0.0%) |
| 65 to 74 Years | 1 (3.6%) | 0 (0.0%) |
| 75 Years and over | 4 (19.1%) | 2 (8.0%) |
Disability Class: Cognitive Difficulty
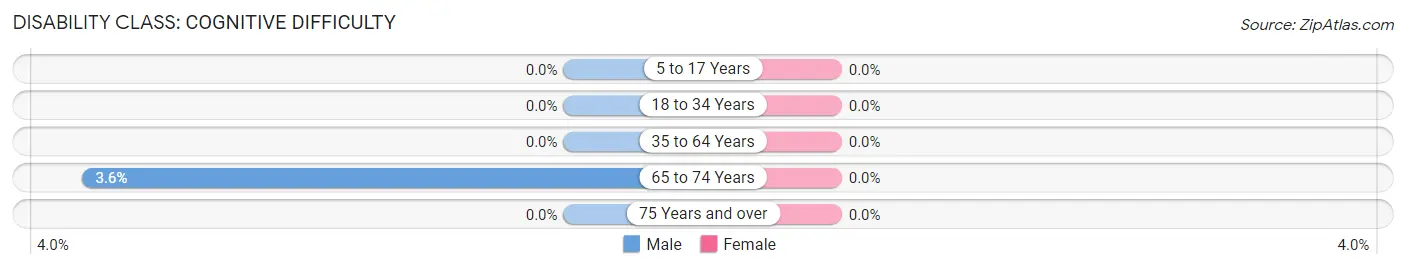
| Age Bracket | Male | Female |
| 5 to 17 Years | 0 (0.0%) | 0 (0.0%) |
| 18 to 34 Years | 0 (0.0%) | 0 (0.0%) |
| 35 to 64 Years | 0 (0.0%) | 0 (0.0%) |
| 65 to 74 Years | 1 (3.6%) | 0 (0.0%) |
| 75 Years and over | 0 (0.0%) | 0 (0.0%) |
Disability Class: Ambulatory Difficulty
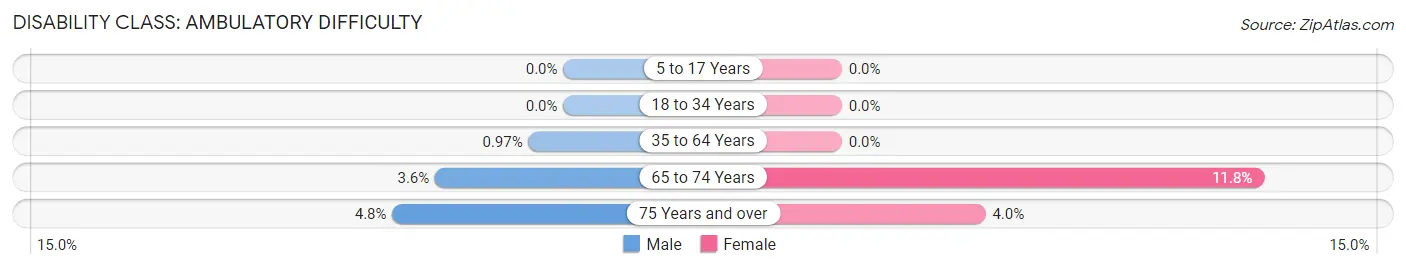
| Age Bracket | Male | Female |
| 5 to 17 Years | 0 (0.0%) | 0 (0.0%) |
| 18 to 34 Years | 0 (0.0%) | 0 (0.0%) |
| 35 to 64 Years | 1 (1.0%) | 0 (0.0%) |
| 65 to 74 Years | 1 (3.6%) | 2 (11.8%) |
| 75 Years and over | 1 (4.8%) | 1 (4.0%) |
Disability Class: Self-Care Difficulty
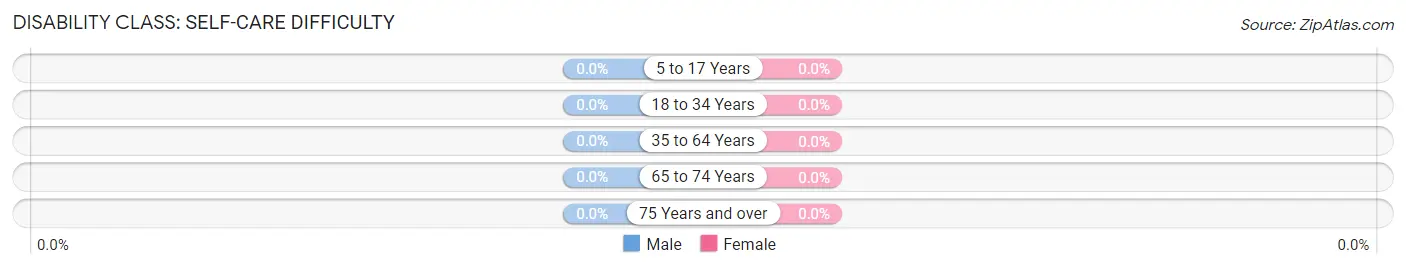
| Age Bracket | Male | Female |
| 5 to 17 Years | 0 (0.0%) | 0 (0.0%) |
| 18 to 34 Years | 0 (0.0%) | 0 (0.0%) |
| 35 to 64 Years | 0 (0.0%) | 0 (0.0%) |
| 65 to 74 Years | 0 (0.0%) | 0 (0.0%) |
| 75 Years and over | 0 (0.0%) | 0 (0.0%) |
Technology Access in Petroleum County
Computing Device Access in Petroleum County
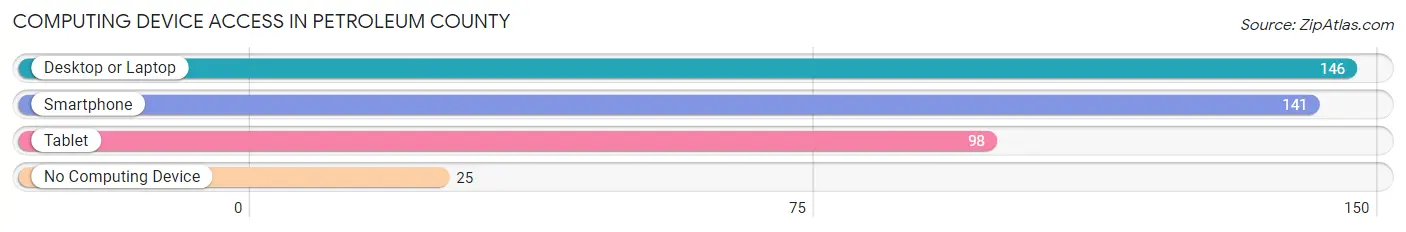
| Device Type | # Households | % Households |
| Desktop or Laptop | 146 | 77.2% |
| Smartphone | 141 | 74.6% |
| Tablet | 98 | 51.8% |
| No Computing Device | 25 | 13.2% |
| Total | 189 | 100.0% |
Internet Access in Petroleum County
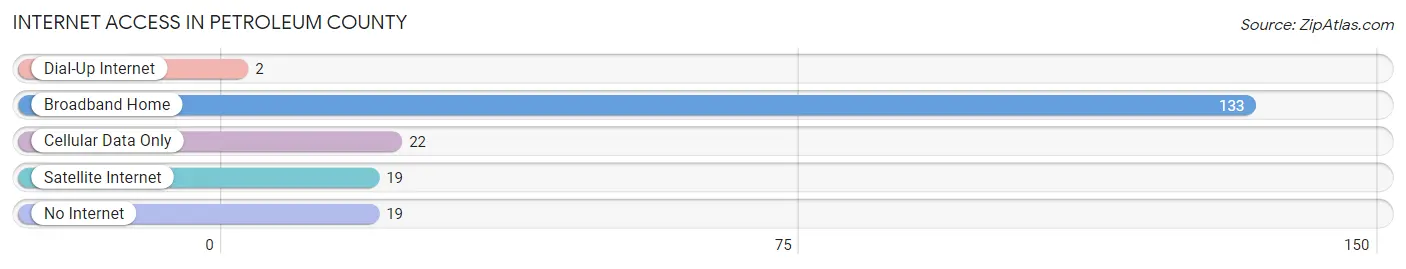
| Internet Type | # Households | % Households |
| Dial-Up Internet | 2 | 1.1% |
| Broadband Home | 133 | 70.4% |
| Cellular Data Only | 22 | 11.6% |
| Satellite Internet | 19 | 10.1% |
| No Internet | 19 | 10.1% |
| Total | 189 | 100.0% |
Petroleum County Summary
Petroleum County, Montana is located in the northeastern corner of the state, and is bordered by the Missouri River to the east, the Musselshell River to the south, and the Yellowstone River to the west. The county seat is Winnett, and the county has a total area of 1,845 square miles. As of the 2010 census, the population was 922, making it the least populous county in Montana.
Geography
Petroleum County is located in the Great Plains region of Montana, and is characterized by rolling hills and wide open spaces. The county is mostly rural, with the majority of the population living in small towns and rural communities. The county is home to several large ranches, and the landscape is dominated by grasslands and prairies. The county is also home to several small lakes, including Lake Elwell, Lake Francis, and Lake Mary.
The county is home to several wildlife refuges, including the Charles M. Russell National Wildlife Refuge, the Upper Missouri River Breaks National Monument, and the Fort Peck Indian Reservation. The county is also home to several state parks, including the Medicine Rocks State Park, the Upper Missouri River Breaks State Park, and the Fort Peck State Park.
Climate
Petroleum County has a semi-arid climate, with hot summers and cold winters. The average annual temperature is 48°F, and the average annual precipitation is 13.5 inches. The county is prone to extreme weather, including severe thunderstorms, hail, and tornadoes.
Economy
The economy of Petroleum County is largely based on agriculture and ranching. The county is home to several large ranches, and the majority of the population is employed in the agricultural sector. The county is also home to several oil and gas fields, and the oil and gas industry is a major contributor to the local economy.
The county is also home to several small businesses, including restaurants, retail stores, and service providers. The county is home to several tourist attractions, including the Charles M. Russell National Wildlife Refuge, the Upper Missouri River Breaks National Monument, and the Fort Peck Indian Reservation.
Demographics
As of the 2010 census, the population of Petroleum County was 922, making it the least populous county in Montana. The population is spread out, with the majority of the population living in small towns and rural communities. The racial makeup of the county is 97.2% White, 0.2% African American, 0.2% Native American, 0.2% Asian, 0.2% from other races, and 1.9% from two or more races.
The median income for a household in the county was $37,917, and the median income for a family was $45,000. The per capita income for the county was $18,945. About 11.2% of families and 14.2% of the population were below the poverty line, including 17.2% of those under age 18 and 8.3% of those age 65 or over.
Petroleum County is a rural county with a small population and a largely agricultural economy. The county is home to several tourist attractions, and the oil and gas industry is a major contributor to the local economy. The county is also home to several wildlife refuges and state parks, making it a popular destination for outdoor enthusiasts.
Common Questions
What is Per Capita Income in Petroleum County?
Per Capita income in Petroleum County is $32,590.
What is the Median Family Income in Petroleum County?
Median Family Income in Petroleum County is $77,500.
What is the Median Household income in Petroleum County?
Median Household Income in Petroleum County is $57,981.
What is Income or Wage Gap in Petroleum County?
Income or Wage Gap in Petroleum County is 13.6%.
Women in Petroleum County earn 86.4 cents for every dollar earned by a man.
What is Inequality or Gini Index in Petroleum County?
Inequality or Gini Index in Petroleum County is 0.38.
What is the Total Population of Petroleum County?
Total Population of Petroleum County is 416.
What is the Total Male Population of Petroleum County?
Total Male Population of Petroleum County is 226.
What is the Total Female Population of Petroleum County?
Total Female Population of Petroleum County is 190.
What is the Ratio of Males per 100 Females in Petroleum County?
There are 118.95 Males per 100 Females in Petroleum County.
What is the Ratio of Females per 100 Males in Petroleum County?
There are 84.07 Females per 100 Males in Petroleum County.
What is the Median Population Age in Petroleum County?
Median Population Age in Petroleum County is 49.6 Years.
What is the Average Family Size in Petroleum County
Average Family Size in Petroleum County is 2.6 People.
What is the Average Household Size in Petroleum County
Average Household Size in Petroleum County is 2.2 People.
How Large is the Labor Force in Petroleum County?
There are 239 People in the Labor Forcein in Petroleum County.
What is the Percentage of People in the Labor Force in Petroleum County?
69.3% of People are in the Labor Force in Petroleum County.
What is the Unemployment Rate in Petroleum County?
Unemployment Rate in Petroleum County is 0.8%.