Chouteau County, MT Map & Demographics
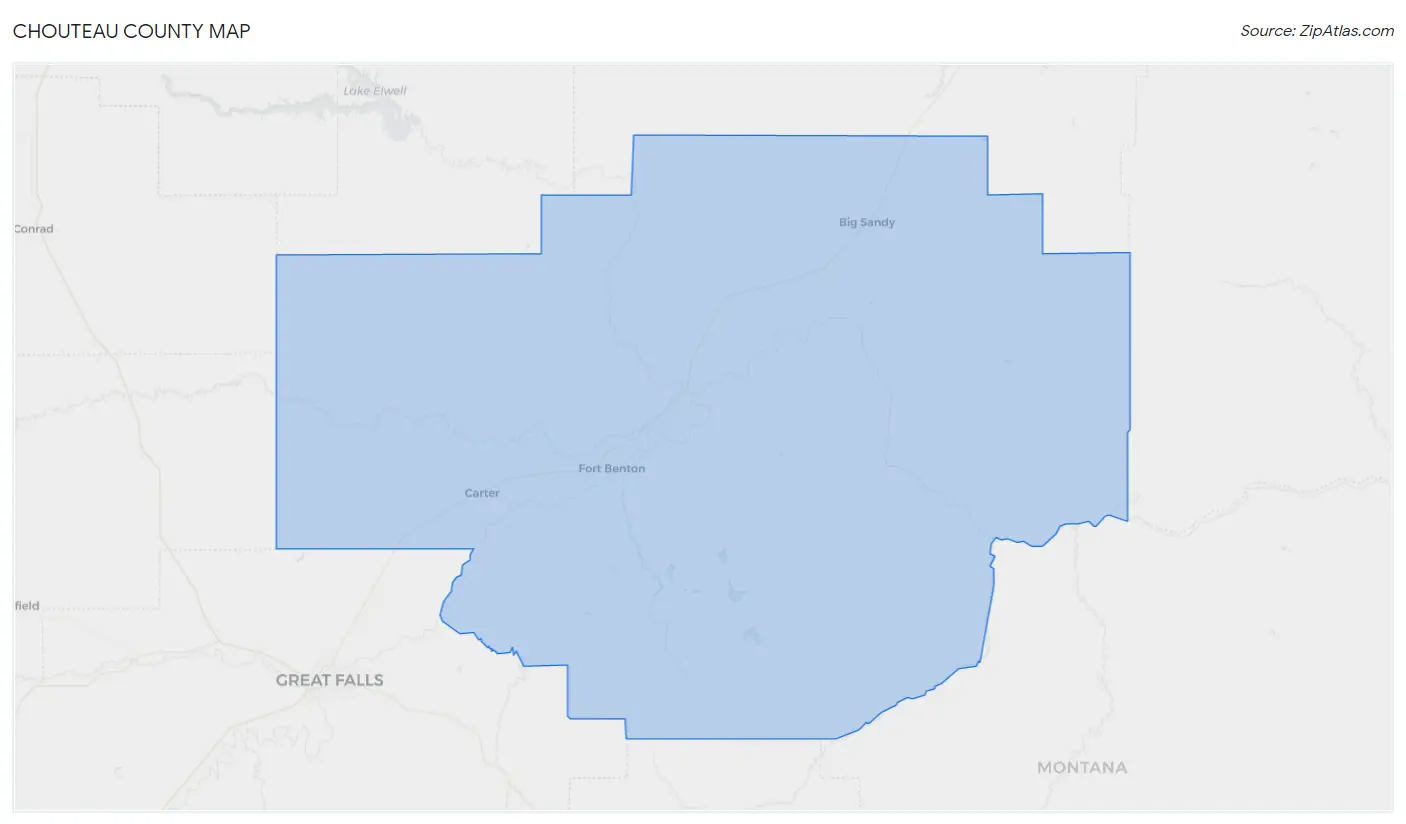
Chouteau County Map
Chouteau County Overview
$28,980
PER CAPITA INCOME
$76,058
AVG FAMILY INCOME
$51,791
AVG HOUSEHOLD INCOME
39.1%
WAGE / INCOME GAP [ % ]
60.9¢/ $1
WAGE / INCOME GAP [ $ ]
$12,006
FAMILY INCOME DEFICIT
0.44
INEQUALITY / GINI INDEX
5,897
TOTAL POPULATION
2,956
MALE POPULATION
2,941
FEMALE POPULATION
100.51
MALES / 100 FEMALES
99.49
FEMALES / 100 MALES
42.4
MEDIAN AGE
3.5
AVG FAMILY SIZE
2.6
AVG HOUSEHOLD SIZE
2,641
LABOR FORCE [ PEOPLE ]
55.7%
PERCENT IN LABOR FORCE
5.2%
UNEMPLOYMENT RATE
Chouteau County Area Codes
Income in Chouteau County
Income Overview in Chouteau County
Per Capita Income in Chouteau County is $28,980, while median incomes of families and households are $76,058 and $51,791 respectively.
| Characteristic | Number | Measure |
| Per Capita Income | 5,897 | $28,980 |
| Median Family Income | 1,331 | $76,058 |
| Mean Family Income | 1,331 | $87,805 |
| Median Household Income | 2,184 | $51,791 |
| Mean Household Income | 2,184 | $71,860 |
| Income Deficit | 1,331 | $12,006 |
| Wage / Income Gap (%) | 5,897 | 39.07% |
| Wage / Income Gap ($) | 5,897 | 60.93¢ per $1 |
| Gini / Inequality Index | 5,897 | 0.44 |
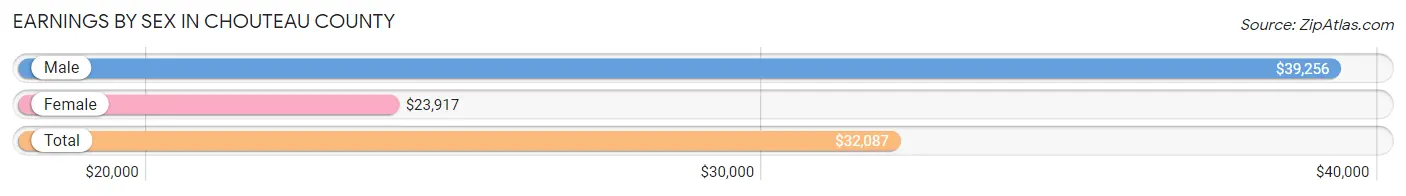
Earnings by Sex in Chouteau County
Average Earnings in Chouteau County are $32,087, $39,256 for men and $23,917 for women, a difference of 39.1%.
| Sex | Number | Average Earnings |
| Male | 1,487 (54.5%) | $39,256 |
| Female | 1,241 (45.5%) | $23,917 |
| Total | 2,728 (100.0%) | $32,087 |
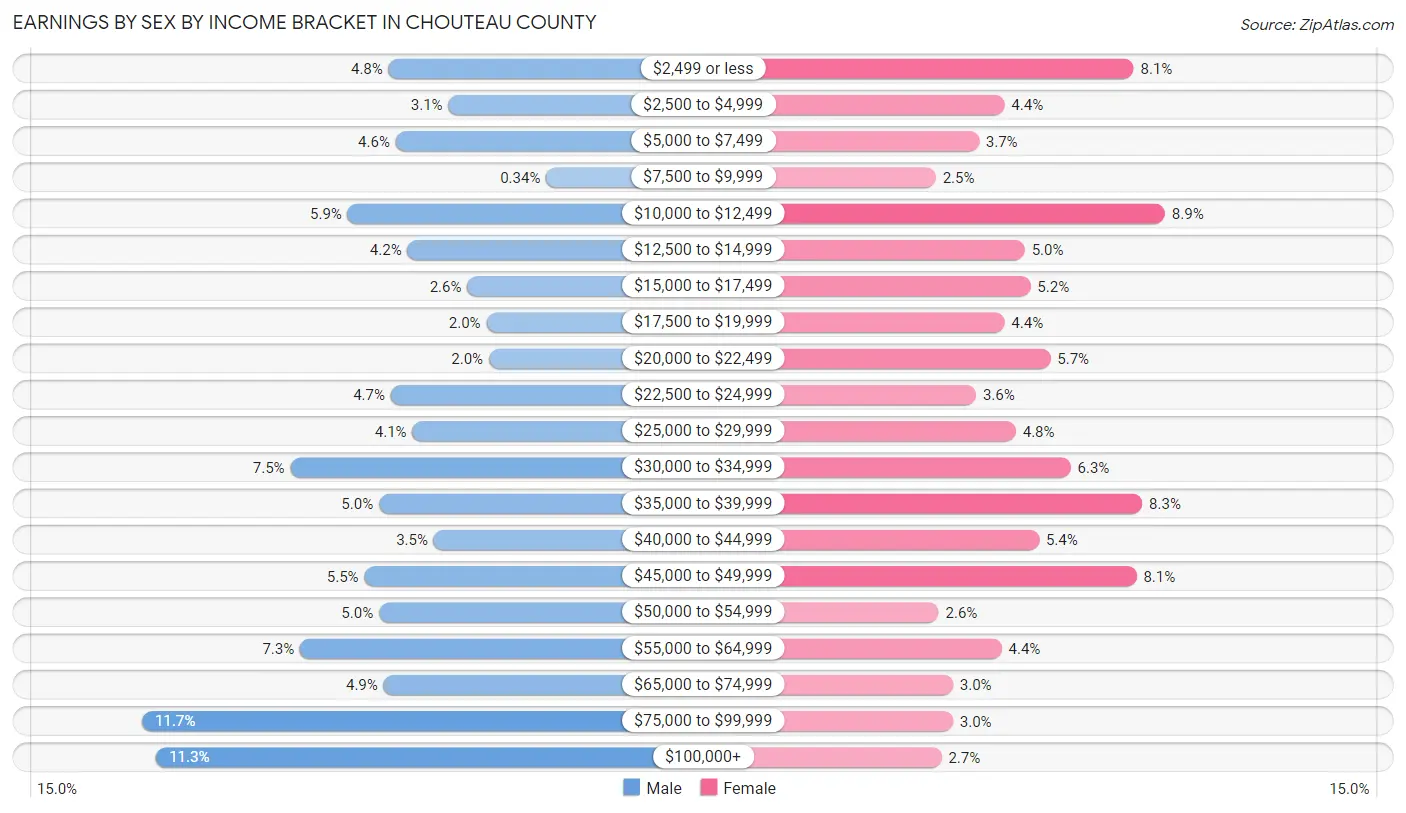
Earnings by Sex by Income Bracket in Chouteau County
The most common earnings brackets in Chouteau County are $75,000 to $99,999 for men (174 | 11.7%) and $10,000 to $12,499 for women (111 | 8.9%).
| Income | Male | Female |
| $2,499 or less | 71 (4.8%) | 100 (8.1%) |
| $2,500 to $4,999 | 46 (3.1%) | 55 (4.4%) |
| $5,000 to $7,499 | 68 (4.6%) | 46 (3.7%) |
| $7,500 to $9,999 | 5 (0.3%) | 31 (2.5%) |
| $10,000 to $12,499 | 88 (5.9%) | 111 (8.9%) |
| $12,500 to $14,999 | 63 (4.2%) | 62 (5.0%) |
| $15,000 to $17,499 | 38 (2.6%) | 64 (5.2%) |
| $17,500 to $19,999 | 30 (2.0%) | 55 (4.4%) |
| $20,000 to $22,499 | 29 (1.9%) | 71 (5.7%) |
| $22,500 to $24,999 | 70 (4.7%) | 45 (3.6%) |
| $25,000 to $29,999 | 61 (4.1%) | 59 (4.8%) |
| $30,000 to $34,999 | 112 (7.5%) | 78 (6.3%) |
| $35,000 to $39,999 | 75 (5.0%) | 103 (8.3%) |
| $40,000 to $44,999 | 52 (3.5%) | 67 (5.4%) |
| $45,000 to $49,999 | 81 (5.4%) | 101 (8.1%) |
| $50,000 to $54,999 | 75 (5.0%) | 32 (2.6%) |
| $55,000 to $64,999 | 108 (7.3%) | 54 (4.3%) |
| $65,000 to $74,999 | 73 (4.9%) | 37 (3.0%) |
| $75,000 to $99,999 | 174 (11.7%) | 37 (3.0%) |
| $100,000+ | 168 (11.3%) | 33 (2.7%) |
| Total | 1,487 (100.0%) | 1,241 (100.0%) |
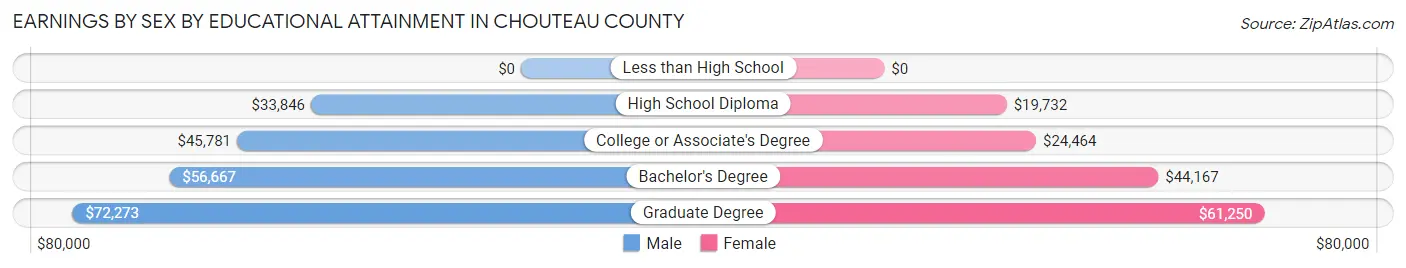
Earnings by Sex by Educational Attainment in Chouteau County
Average earnings in Chouteau County are $45,324 for men and $30,313 for women, a difference of 33.1%. Men with an educational attainment of graduate degree enjoy the highest average annual earnings of $72,273, while those with high school diploma education earn the least with $33,846. Women with an educational attainment of graduate degree earn the most with the average annual earnings of $61,250, while those with high school diploma education have the smallest earnings of $19,732.
| Educational Attainment | Male Income | Female Income |
| Less than High School | - | - |
| High School Diploma | $33,846 | $19,732 |
| College or Associate's Degree | $45,781 | $24,464 |
| Bachelor's Degree | $56,667 | $44,167 |
| Graduate Degree | $72,273 | $61,250 |
| Total | $45,324 | $30,313 |
Family Income in Chouteau County
Family Income Brackets in Chouteau County
According to the Chouteau County family income data, there are 291 families falling into the $100,000 to $149,999 income range, which is the most common income bracket and makes up 21.9% of all families. Conversely, the $10,000 to $14,999 income bracket is the least frequent group with only 19 families (1.4%) belonging to this category.
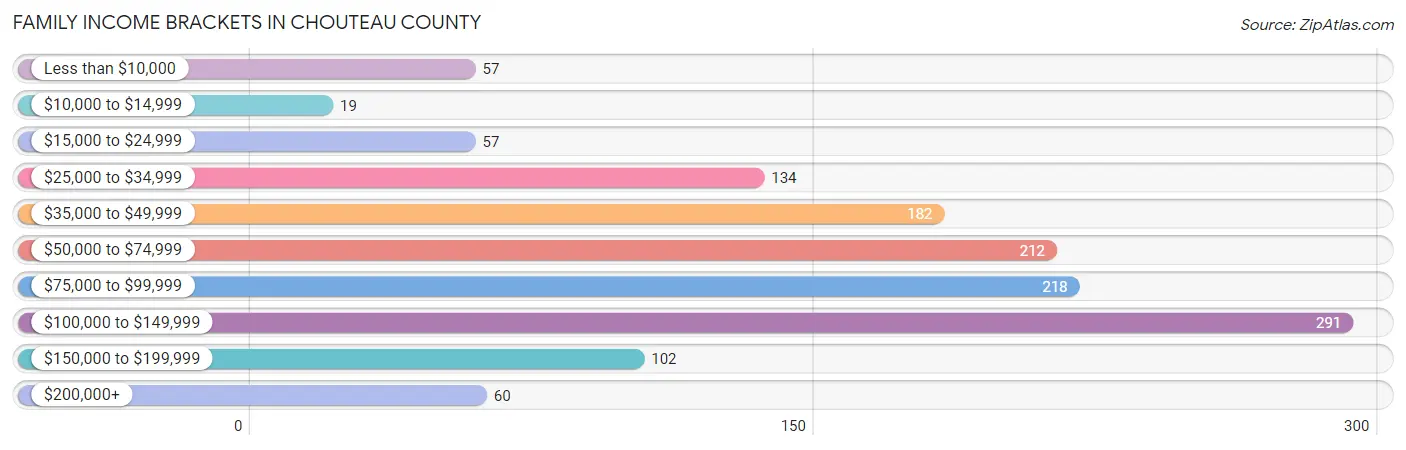
| Income Bracket | # Families | % Families |
| Less than $10,000 | 57 | 4.3% |
| $10,000 to $14,999 | 19 | 1.4% |
| $15,000 to $24,999 | 57 | 4.3% |
| $25,000 to $34,999 | 134 | 10.1% |
| $35,000 to $49,999 | 182 | 13.7% |
| $50,000 to $74,999 | 212 | 15.9% |
| $75,000 to $99,999 | 218 | 16.4% |
| $100,000 to $149,999 | 291 | 21.9% |
| $150,000 to $199,999 | 102 | 7.7% |
| $200,000+ | 60 | 4.5% |
Family Income by Famaliy Size in Chouteau County
3-person families (224 | 16.8%) account for the highest median family income in Chouteau County with $83,750 per family, while 2-person families (690 | 51.8%) have the highest median income of $39,766 per family member.
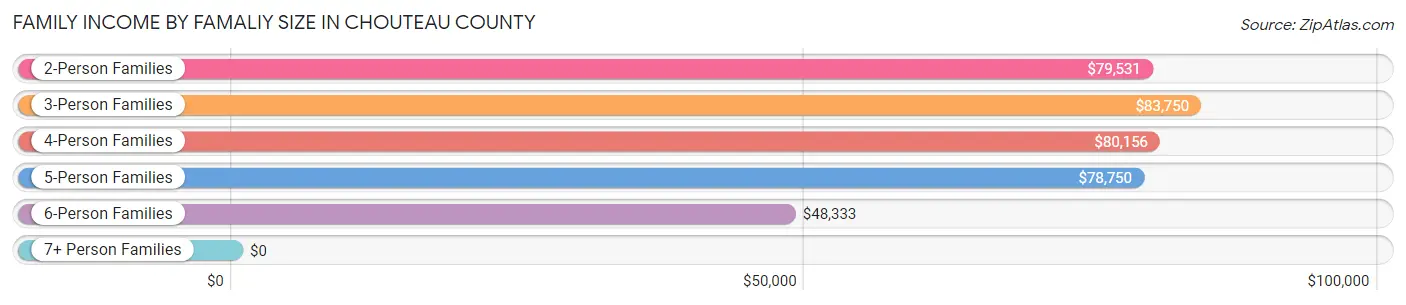
| Income Bracket | # Families | Median Income |
| 2-Person Families | 690 (51.8%) | $79,531 |
| 3-Person Families | 224 (16.8%) | $83,750 |
| 4-Person Families | 192 (14.4%) | $80,156 |
| 5-Person Families | 95 (7.1%) | $78,750 |
| 6-Person Families | 110 (8.3%) | $48,333 |
| 7+ Person Families | 20 (1.5%) | $0 |
| Total | 1,331 (100.0%) | $76,058 |
Family Income by Number of Earners in Chouteau County
The median family income in Chouteau County is $76,058, with families comprising 3+ earners (61) having the highest median family income of $116,339, while families with no earners (245) have the lowest median family income of $43,036, accounting for 4.6% and 18.4% of families, respectively.
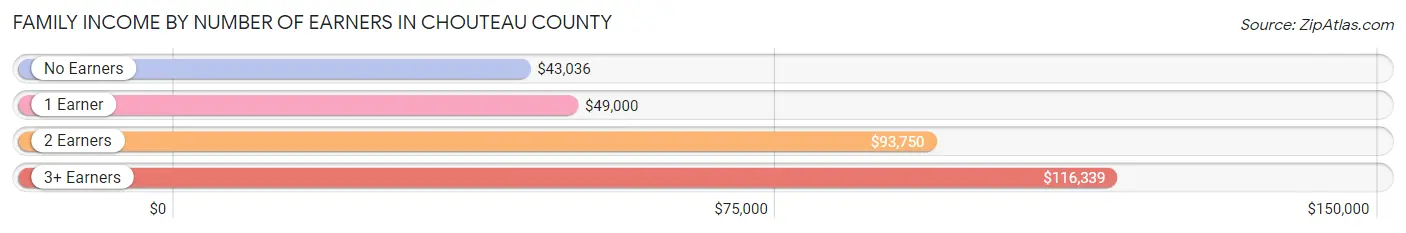
| Number of Earners | # Families | Median Income |
| No Earners | 245 (18.4%) | $43,036 |
| 1 Earner | 418 (31.4%) | $49,000 |
| 2 Earners | 607 (45.6%) | $93,750 |
| 3+ Earners | 61 (4.6%) | $116,339 |
| Total | 1,331 (100.0%) | $76,058 |
Household Income in Chouteau County
Household Income Brackets in Chouteau County
With 371 households falling in the category, the $50,000 to $74,999 income range is the most frequent in Chouteau County, accounting for 17.0% of all households. In contrast, only 72 households (3.3%) fall into the $200,000+ income bracket, making it the least populous group.
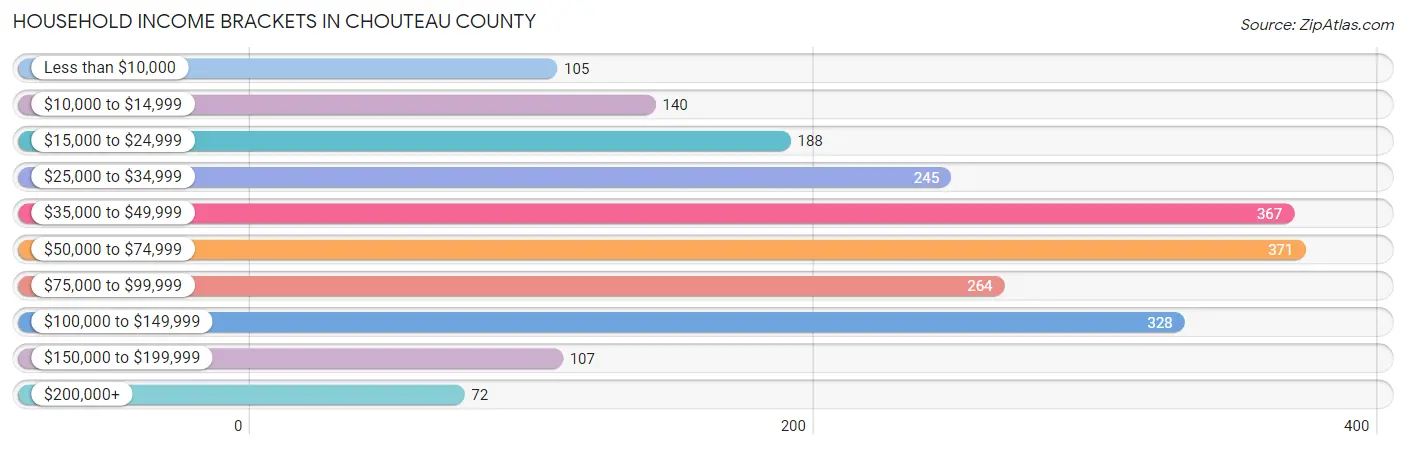
| Income Bracket | # Households | % Households |
| Less than $10,000 | 105 | 4.8% |
| $10,000 to $14,999 | 140 | 6.4% |
| $15,000 to $24,999 | 188 | 8.6% |
| $25,000 to $34,999 | 245 | 11.2% |
| $35,000 to $49,999 | 367 | 16.8% |
| $50,000 to $74,999 | 371 | 17.0% |
| $75,000 to $99,999 | 264 | 12.1% |
| $100,000 to $149,999 | 328 | 15.0% |
| $150,000 to $199,999 | 107 | 4.9% |
| $200,000+ | 72 | 3.3% |
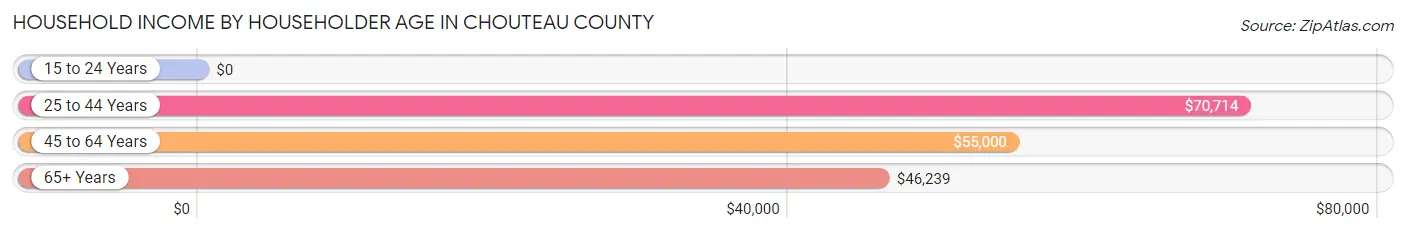
Household Income by Householder Age in Chouteau County
The median household income in Chouteau County is $51,791, with the highest median household income of $70,714 found in the 25 to 44 years age bracket for the primary householder. A total of 500 households (22.9%) fall into this category. Meanwhile, the 15 to 24 years age bracket for the primary householder has the lowest median household income of $0, with 73 households (3.3%) in this group.
| Income Bracket | # Households | Median Income |
| 15 to 24 Years | 73 (3.3%) | $0 |
| 25 to 44 Years | 500 (22.9%) | $70,714 |
| 45 to 64 Years | 776 (35.5%) | $55,000 |
| 65+ Years | 835 (38.2%) | $46,239 |
| Total | 2,184 (100.0%) | $51,791 |
Poverty in Chouteau County
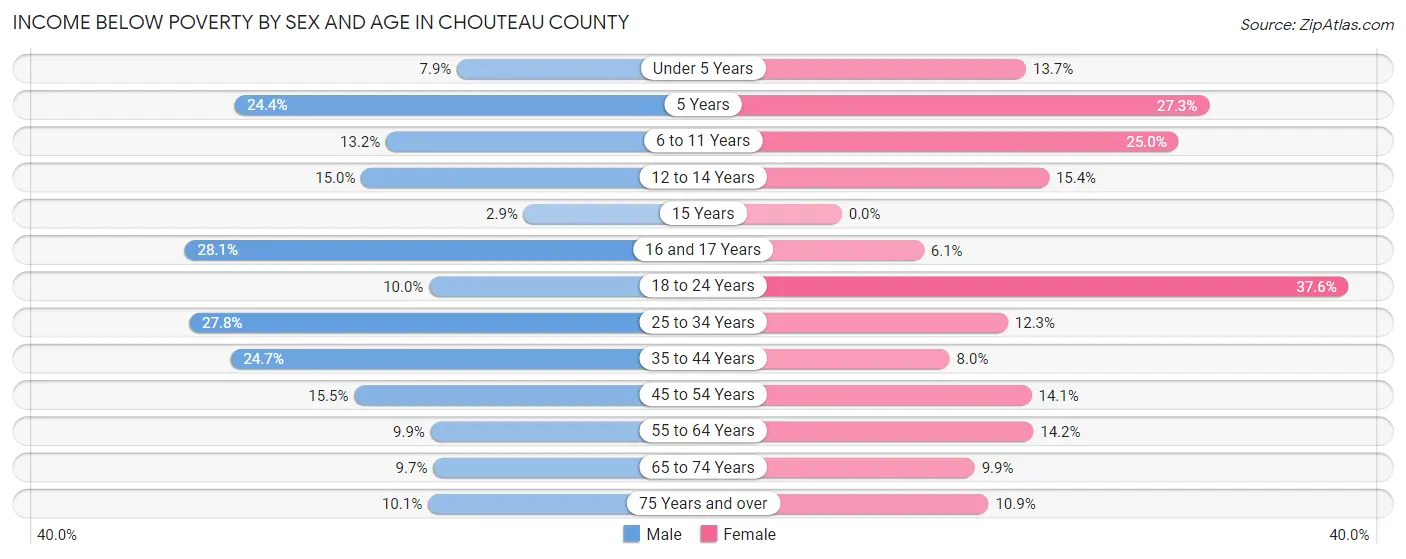
Income Below Poverty by Sex and Age in Chouteau County
With 15.3% poverty level for males and 14.8% for females among the residents of Chouteau County, 16 and 17 year old males and 18 to 24 year old females are the most vulnerable to poverty, with 27 males (28.1%) and 79 females (37.6%) in their respective age groups living below the poverty level.
| Age Bracket | Male | Female |
| Under 5 Years | 13 (7.9%) | 26 (13.7%) |
| 5 Years | 11 (24.4%) | 18 (27.3%) |
| 6 to 11 Years | 30 (13.2%) | 56 (25.0%) |
| 12 to 14 Years | 9 (15.0%) | 14 (15.4%) |
| 15 Years | 1 (2.9%) | 0 (0.0%) |
| 16 and 17 Years | 27 (28.1%) | 7 (6.1%) |
| 18 to 24 Years | 24 (10.0%) | 79 (37.6%) |
| 25 to 34 Years | 95 (27.8%) | 36 (12.3%) |
| 35 to 44 Years | 84 (24.7%) | 25 (8.0%) |
| 45 to 54 Years | 52 (15.5%) | 41 (14.1%) |
| 55 to 64 Years | 40 (9.9%) | 64 (14.2%) |
| 65 to 74 Years | 40 (9.7%) | 38 (9.9%) |
| 75 Years and over | 21 (10.1%) | 27 (10.9%) |
| Total | 447 (15.3%) | 431 (14.8%) |
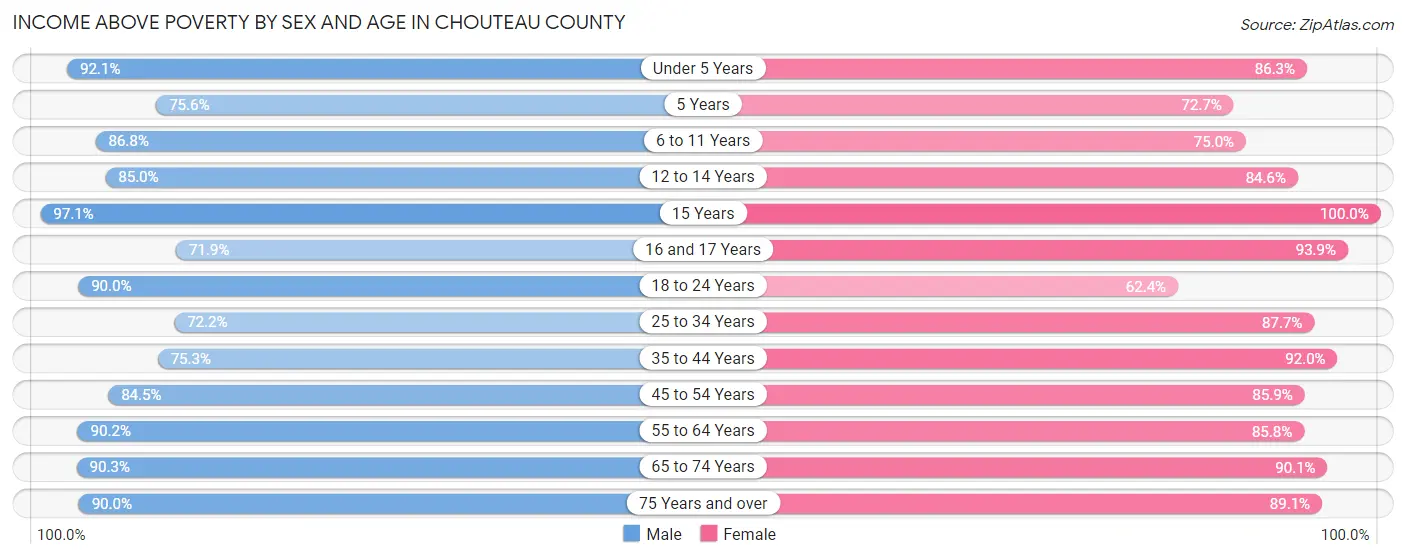
Income Above Poverty by Sex and Age in Chouteau County
According to the poverty statistics in Chouteau County, males aged 15 years and females aged 15 years are the age groups that are most secure financially, with 97.1% of males and 100.0% of females in these age groups living above the poverty line.
| Age Bracket | Male | Female |
| Under 5 Years | 152 (92.1%) | 164 (86.3%) |
| 5 Years | 34 (75.6%) | 48 (72.7%) |
| 6 to 11 Years | 198 (86.8%) | 168 (75.0%) |
| 12 to 14 Years | 51 (85.0%) | 77 (84.6%) |
| 15 Years | 33 (97.1%) | 43 (100.0%) |
| 16 and 17 Years | 69 (71.9%) | 108 (93.9%) |
| 18 to 24 Years | 217 (90.0%) | 131 (62.4%) |
| 25 to 34 Years | 247 (72.2%) | 256 (87.7%) |
| 35 to 44 Years | 256 (75.3%) | 287 (92.0%) |
| 45 to 54 Years | 283 (84.5%) | 250 (85.9%) |
| 55 to 64 Years | 366 (90.1%) | 386 (85.8%) |
| 65 to 74 Years | 374 (90.3%) | 347 (90.1%) |
| 75 Years and over | 188 (89.9%) | 221 (89.1%) |
| Total | 2,468 (84.7%) | 2,486 (85.2%) |
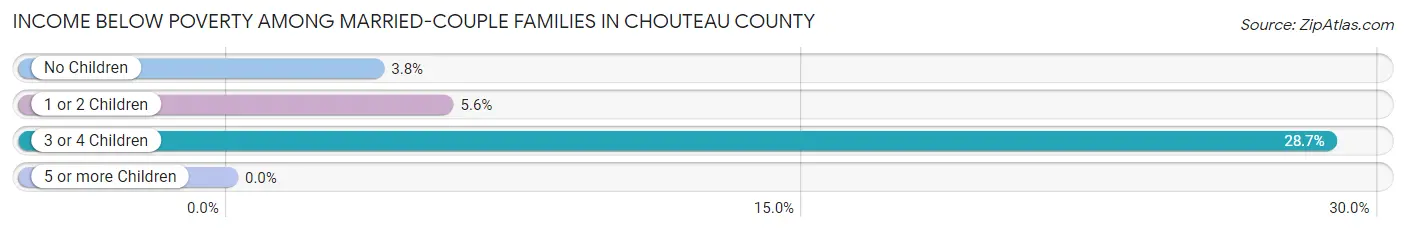
Income Below Poverty Among Married-Couple Families in Chouteau County
The poverty statistics for married-couple families in Chouteau County show that 7.5% or 80 of the total 1,066 families live below the poverty line. Families with 3 or 4 children have the highest poverty rate of 28.7%, comprising of 39 families. On the other hand, families with no children have the lowest poverty rate of 3.8%, which includes 24 families.
| Children | Above Poverty | Below Poverty |
| No Children | 604 (96.2%) | 24 (3.8%) |
| 1 or 2 Children | 285 (94.4%) | 17 (5.6%) |
| 3 or 4 Children | 97 (71.3%) | 39 (28.7%) |
| 5 or more Children | 0 (0.0%) | 0 (0.0%) |
| Total | 986 (92.5%) | 80 (7.5%) |
Income Below Poverty Among Single-Parent Households in Chouteau County
According to the poverty data in Chouteau County, 21.5% or 25 single-father households and 35.6% or 53 single-mother households are living below the poverty line. Among single-father households, those with 1 or 2 children have the highest poverty rate, with 23 households (45.1%) experiencing poverty. Likewise, among single-mother households, those with 5 or more children have the highest poverty rate, with 8 households (100.0%) falling below the poverty line.
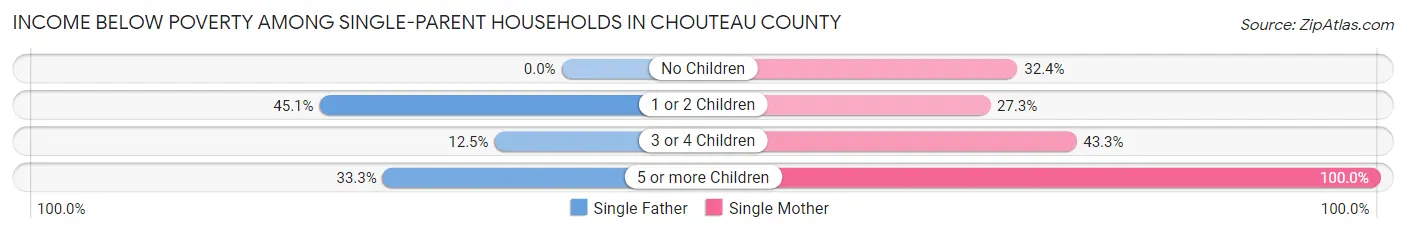
| Children | Single Father | Single Mother |
| No Children | 0 (0.0%) | 11 (32.4%) |
| 1 or 2 Children | 23 (45.1%) | 21 (27.3%) |
| 3 or 4 Children | 1 (12.5%) | 13 (43.3%) |
| 5 or more Children | 1 (33.3%) | 8 (100.0%) |
| Total | 25 (21.5%) | 53 (35.6%) |
Income Below Poverty Among Married-Couple vs Single-Parent Households in Chouteau County
The poverty data for Chouteau County shows that 80 of the married-couple family households (7.5%) and 78 of the single-parent households (29.4%) are living below the poverty level. Within the married-couple family households, those with 3 or 4 children have the highest poverty rate, with 39 households (28.7%) falling below the poverty line. Among the single-parent households, those with 5 or more children have the highest poverty rate, with 9 household (81.8%) living below poverty.
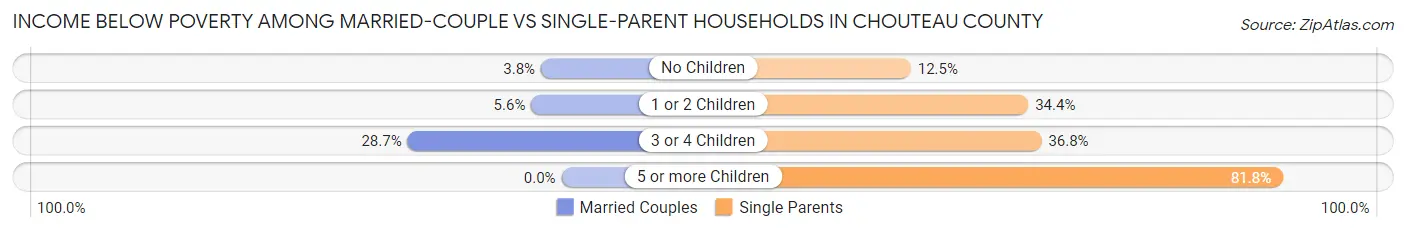
| Children | Married-Couple Families | Single-Parent Households |
| No Children | 24 (3.8%) | 11 (12.5%) |
| 1 or 2 Children | 17 (5.6%) | 44 (34.4%) |
| 3 or 4 Children | 39 (28.7%) | 14 (36.8%) |
| 5 or more Children | 0 (0.0%) | 9 (81.8%) |
| Total | 80 (7.5%) | 78 (29.4%) |
Race in Chouteau County
The most populous races in Chouteau County are White / Caucasian (4,651 | 78.9%), Native / Alaskan (967 | 16.4%), and Two or more Races (245 | 4.2%).
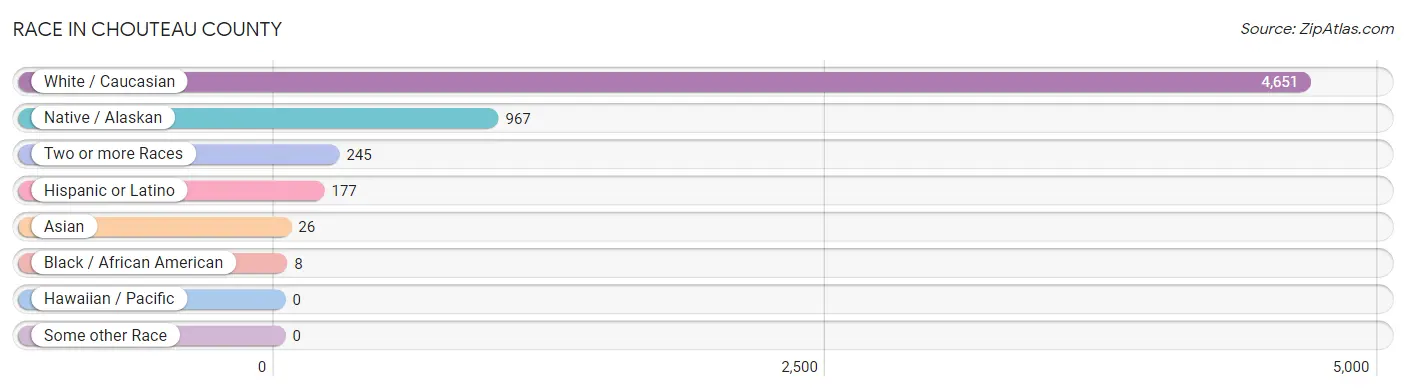
| Race | # Population | % Population |
| Asian | 26 | 0.4% |
| Black / African American | 8 | 0.1% |
| Hawaiian / Pacific | 0 | 0.0% |
| Hispanic or Latino | 177 | 3.0% |
| Native / Alaskan | 967 | 16.4% |
| White / Caucasian | 4,651 | 78.9% |
| Two or more Races | 245 | 4.2% |
| Some other Race | 0 | 0.0% |
| Total | 5,897 | 100.0% |
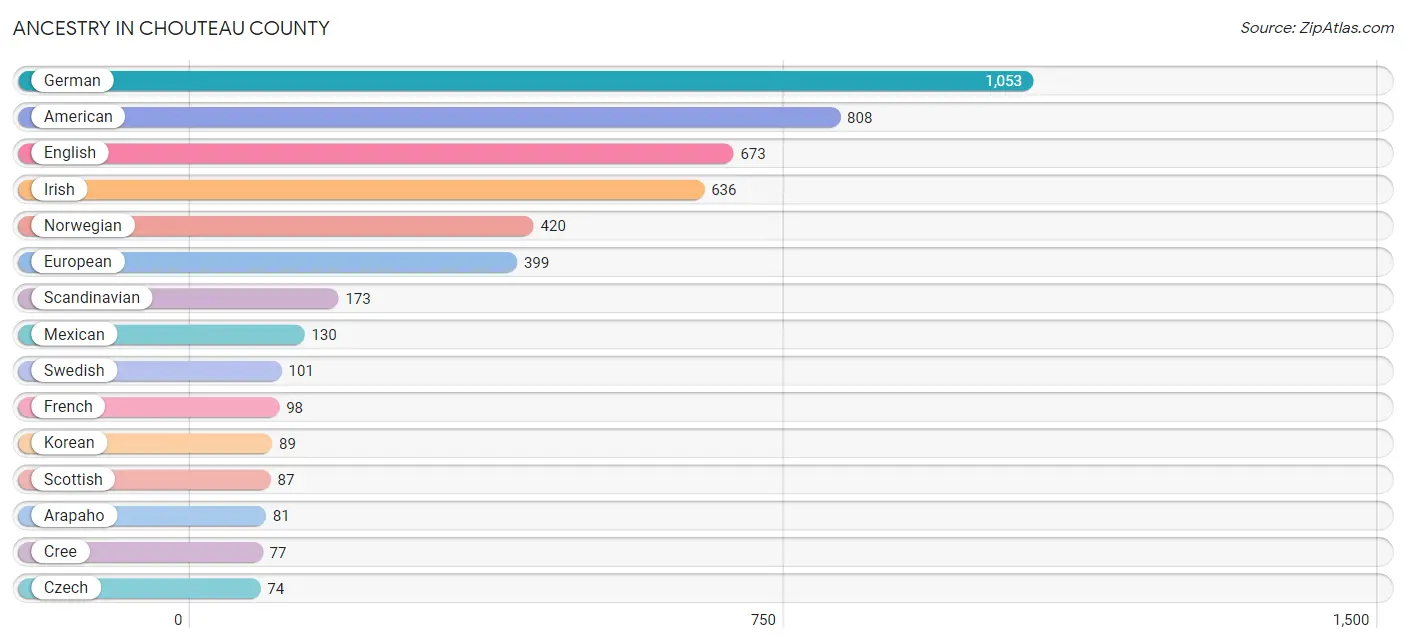
Ancestry in Chouteau County
The most populous ancestries reported in Chouteau County are German (1,053 | 17.9%), American (808 | 13.7%), English (673 | 11.4%), Irish (636 | 10.8%), and Norwegian (420 | 7.1%), together accounting for 60.9% of all Chouteau County residents.
| Ancestry | # Population | % Population |
| American | 808 | 13.7% |
| Apache | 1 | 0.0% |
| Arapaho | 81 | 1.4% |
| Austrian | 3 | 0.1% |
| Belgian | 3 | 0.1% |
| Bhutanese | 3 | 0.1% |
| Blackfeet | 2 | 0.0% |
| British | 30 | 0.5% |
| Burmese | 15 | 0.3% |
| Central American | 41 | 0.7% |
| Chippewa | 37 | 0.6% |
| Cree | 77 | 1.3% |
| Croatian | 3 | 0.1% |
| Crow | 17 | 0.3% |
| Czech | 74 | 1.3% |
| Czechoslovakian | 6 | 0.1% |
| Danish | 40 | 0.7% |
| Dutch | 72 | 1.2% |
| Eastern European | 19 | 0.3% |
| English | 673 | 11.4% |
| Estonian | 9 | 0.2% |
| European | 399 | 6.8% |
| Finnish | 20 | 0.3% |
| French | 98 | 1.7% |
| French American Indian | 3 | 0.1% |
| French Canadian | 25 | 0.4% |
| German | 1,053 | 17.9% |
| Greek | 2 | 0.0% |
| Guatemalan | 41 | 0.7% |
| Indian (Asian) | 4 | 0.1% |
| Irish | 636 | 10.8% |
| Italian | 41 | 0.7% |
| Korean | 89 | 1.5% |
| Mexican | 130 | 2.2% |
| Native Hawaiian | 13 | 0.2% |
| Northern European | 4 | 0.1% |
| Norwegian | 420 | 7.1% |
| Paiute | 1 | 0.0% |
| Peruvian | 3 | 0.1% |
| Polish | 61 | 1.0% |
| Portuguese | 2 | 0.0% |
| Russian | 9 | 0.2% |
| Scandinavian | 173 | 2.9% |
| Scotch-Irish | 43 | 0.7% |
| Scottish | 87 | 1.5% |
| Shoshone | 3 | 0.1% |
| Slovak | 3 | 0.1% |
| Slovene | 3 | 0.1% |
| South American | 3 | 0.1% |
| Sri Lankan | 5 | 0.1% |
| Swedish | 101 | 1.7% |
| Swiss | 21 | 0.4% |
| Ukrainian | 1 | 0.0% |
| Welsh | 52 | 0.9% |
| Yugoslavian | 2 | 0.0% | View All 55 Rows |
Immigrants in Chouteau County
The most numerous immigrant groups reported in Chouteau County came from Asia (22 | 0.4%), Europe (20 | 0.3%), Canada (19 | 0.3%), South Eastern Asia (15 | 0.3%), and Philippines (13 | 0.2%), together accounting for 1.5% of all Chouteau County residents.
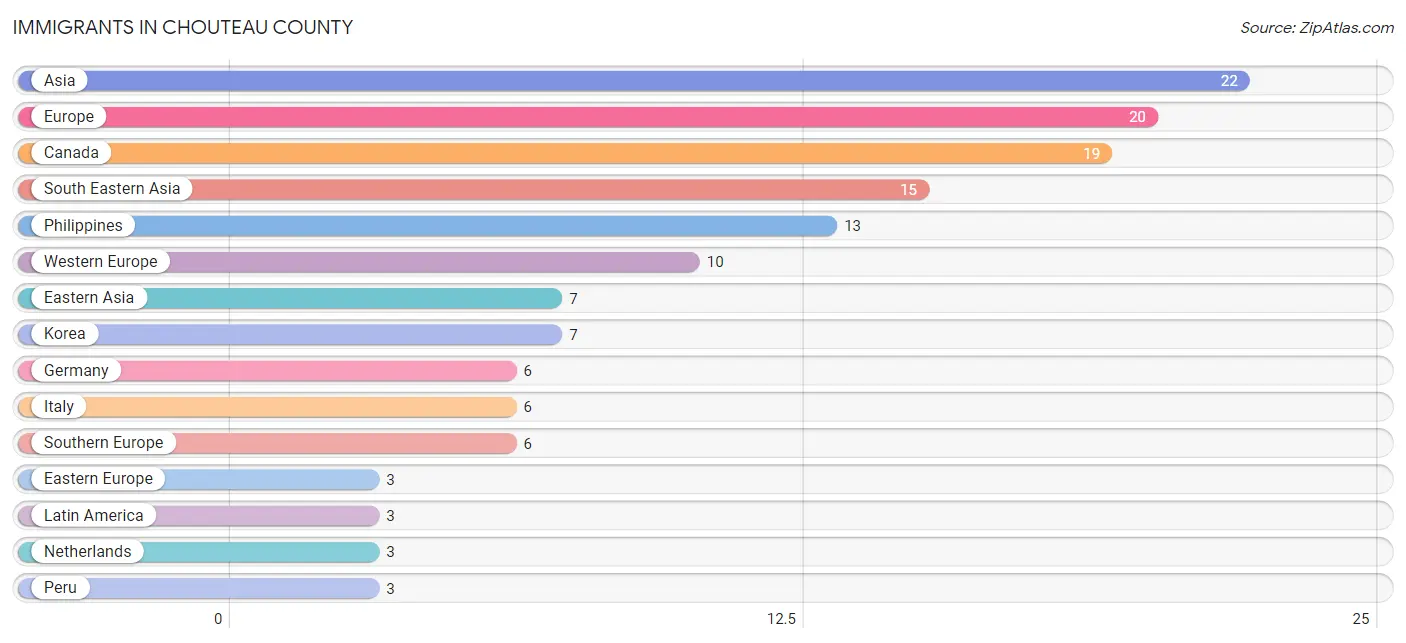
| Immigration Origin | # Population | % Population |
| Asia | 22 | 0.4% |
| Austria | 1 | 0.0% |
| Canada | 19 | 0.3% |
| Denmark | 1 | 0.0% |
| Eastern Asia | 7 | 0.1% |
| Eastern Europe | 3 | 0.1% |
| Europe | 20 | 0.3% |
| Germany | 6 | 0.1% |
| Italy | 6 | 0.1% |
| Korea | 7 | 0.1% |
| Latin America | 3 | 0.1% |
| Netherlands | 3 | 0.1% |
| Northern Europe | 1 | 0.0% |
| Peru | 3 | 0.1% |
| Philippines | 13 | 0.2% |
| Romania | 3 | 0.1% |
| South America | 3 | 0.1% |
| South Eastern Asia | 15 | 0.3% |
| Southern Europe | 6 | 0.1% |
| Thailand | 2 | 0.0% |
| Western Europe | 10 | 0.2% | View All 21 Rows |
Sex and Age in Chouteau County
Sex and Age in Chouteau County
The most populous age groups in Chouteau County are 65 to 69 Years (269 | 9.1%) for men and 55 to 59 Years (242 | 8.2%) for women.
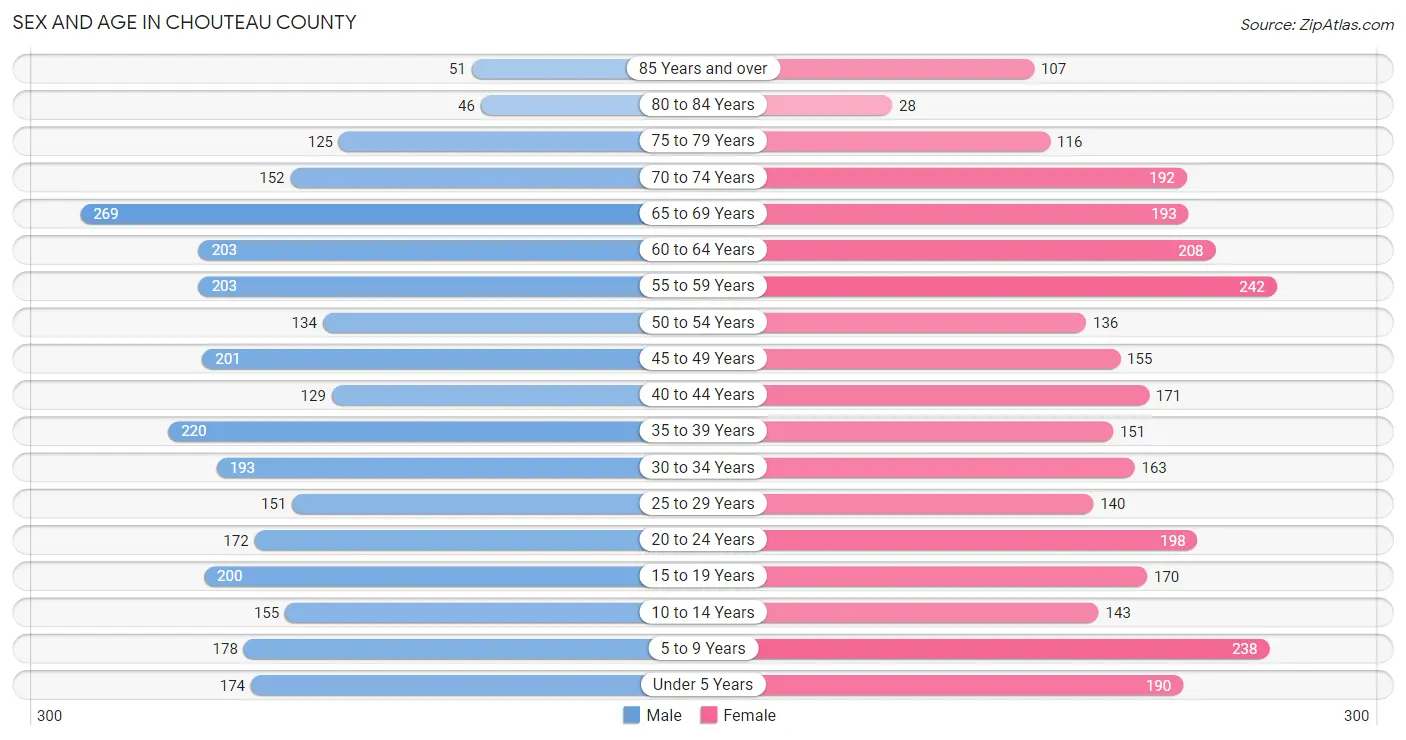
| Age Bracket | Male | Female |
| Under 5 Years | 174 (5.9%) | 190 (6.5%) |
| 5 to 9 Years | 178 (6.0%) | 238 (8.1%) |
| 10 to 14 Years | 155 (5.2%) | 143 (4.9%) |
| 15 to 19 Years | 200 (6.8%) | 170 (5.8%) |
| 20 to 24 Years | 172 (5.8%) | 198 (6.7%) |
| 25 to 29 Years | 151 (5.1%) | 140 (4.8%) |
| 30 to 34 Years | 193 (6.5%) | 163 (5.5%) |
| 35 to 39 Years | 220 (7.4%) | 151 (5.1%) |
| 40 to 44 Years | 129 (4.4%) | 171 (5.8%) |
| 45 to 49 Years | 201 (6.8%) | 155 (5.3%) |
| 50 to 54 Years | 134 (4.5%) | 136 (4.6%) |
| 55 to 59 Years | 203 (6.9%) | 242 (8.2%) |
| 60 to 64 Years | 203 (6.9%) | 208 (7.1%) |
| 65 to 69 Years | 269 (9.1%) | 193 (6.6%) |
| 70 to 74 Years | 152 (5.1%) | 192 (6.5%) |
| 75 to 79 Years | 125 (4.2%) | 116 (3.9%) |
| 80 to 84 Years | 46 (1.6%) | 28 (0.9%) |
| 85 Years and over | 51 (1.7%) | 107 (3.6%) |
| Total | 2,956 (100.0%) | 2,941 (100.0%) |
Families and Households in Chouteau County
Median Family Size in Chouteau County
The median family size in Chouteau County is 3.55 persons per family, with single female/mother families (149 | 11.2%) accounting for the largest median family size of 5.12 persons per family. On the other hand, married-couple families (1,066 | 80.1%) represent the smallest median family size with 3.23 persons per family.
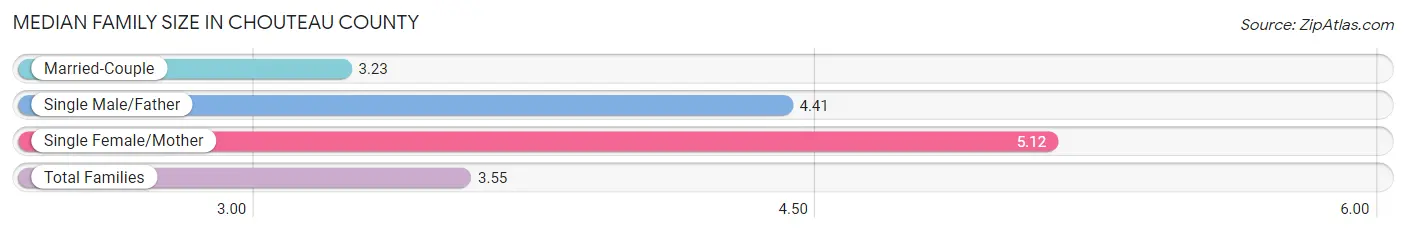
| Family Type | # Families | Family Size |
| Married-Couple | 1,066 (80.1%) | 3.23 |
| Single Male/Father | 116 (8.7%) | 4.41 |
| Single Female/Mother | 149 (11.2%) | 5.12 |
| Total Families | 1,331 (100.0%) | 3.55 |
Median Household Size in Chouteau County
The median household size in Chouteau County is 2.65 persons per household, with single female/mother households (149 | 6.8%) accounting for the largest median household size of 5.72 persons per household. non-family households (853 | 39.1%) represent the smallest median household size with 1.08 persons per household.
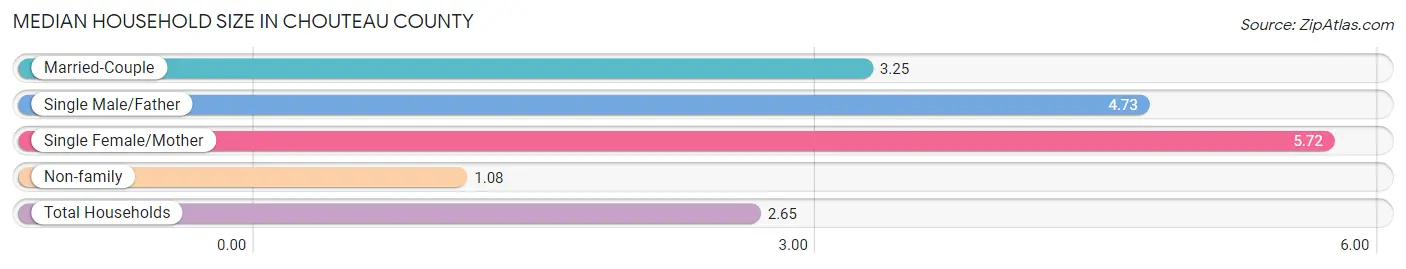
| Household Type | # Households | Household Size |
| Married-Couple | 1,066 (48.8%) | 3.25 |
| Single Male/Father | 116 (5.3%) | 4.73 |
| Single Female/Mother | 149 (6.8%) | 5.72 |
| Non-family | 853 (39.1%) | 1.08 |
| Total Households | 2,184 (100.0%) | 2.65 |
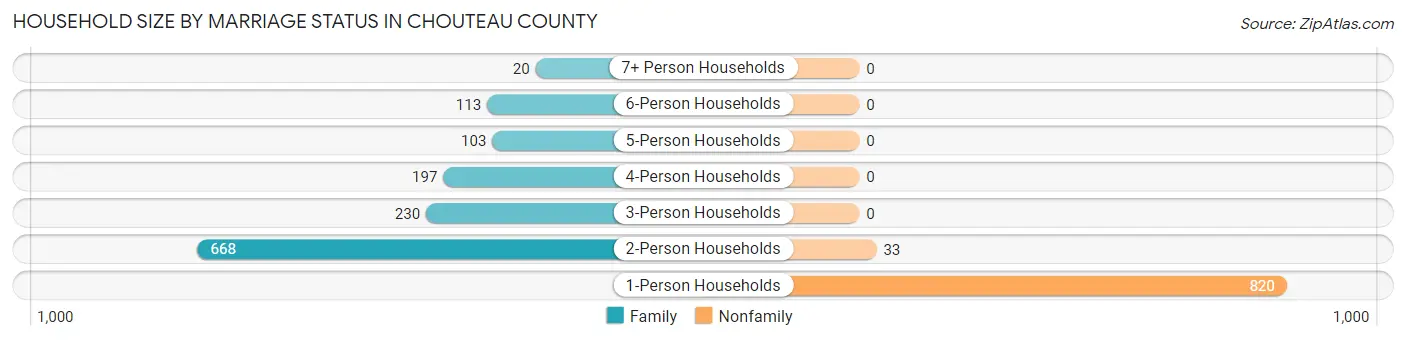
Household Size by Marriage Status in Chouteau County
Out of a total of 2,184 households in Chouteau County, 1,331 (60.9%) are family households, while 853 (39.1%) are nonfamily households. The most numerous type of family households are 2-person households, comprising 668, and the most common type of nonfamily households are 1-person households, comprising 820.
| Household Size | Family Households | Nonfamily Households |
| 1-Person Households | - | 820 (37.6%) |
| 2-Person Households | 668 (30.6%) | 33 (1.5%) |
| 3-Person Households | 230 (10.5%) | 0 (0.0%) |
| 4-Person Households | 197 (9.0%) | 0 (0.0%) |
| 5-Person Households | 103 (4.7%) | 0 (0.0%) |
| 6-Person Households | 113 (5.2%) | 0 (0.0%) |
| 7+ Person Households | 20 (0.9%) | 0 (0.0%) |
| Total | 1,331 (60.9%) | 853 (39.1%) |
Female Fertility in Chouteau County
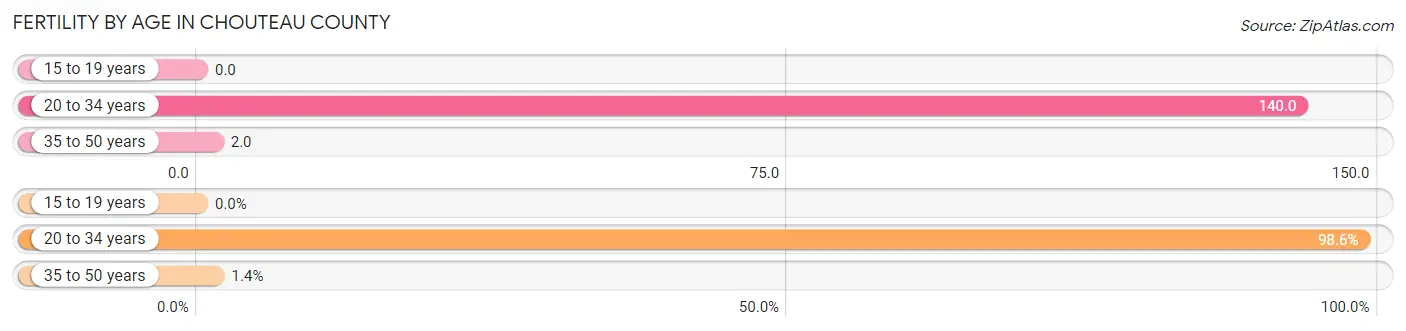
Fertility by Age in Chouteau County
Average fertility rate in Chouteau County is 59.0 births per 1,000 women. Women in the age bracket of 20 to 34 years have the highest fertility rate with 140.0 births per 1,000 women. Women in the age bracket of 20 to 34 years acount for 98.6% of all women with births.
| Age Bracket | Women with Births | Births / 1,000 Women |
| 15 to 19 years | 0 (0.0%) | 0.0 |
| 20 to 34 years | 70 (98.6%) | 140.0 |
| 35 to 50 years | 1 (1.4%) | 2.0 |
| Total | 71 (100.0%) | 59.0 |
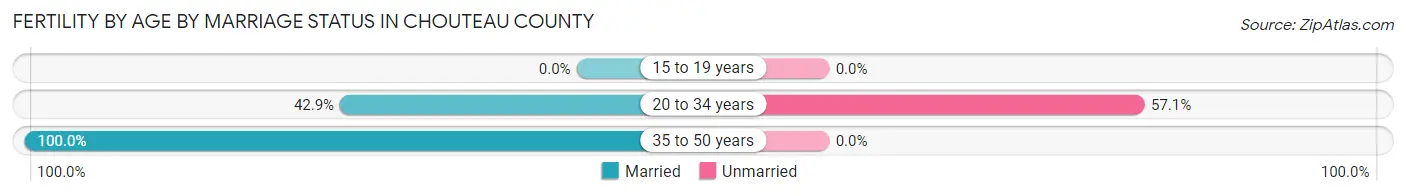
Fertility by Age by Marriage Status in Chouteau County
43.7% of women with births (71) in Chouteau County are married. The highest percentage of unmarried women with births falls into 20 to 34 years age bracket with 57.1% of them unmarried at the time of birth, while the lowest percentage of unmarried women with births belong to 35 to 50 years age bracket with 0.0% of them unmarried.
| Age Bracket | Married | Unmarried |
| 15 to 19 years | 0 (0.0%) | 0 (0.0%) |
| 20 to 34 years | 30 (42.9%) | 40 (57.1%) |
| 35 to 50 years | 1 (100.0%) | 0 (0.0%) |
| Total | 31 (43.7%) | 40 (56.3%) |
Fertility by Education in Chouteau County
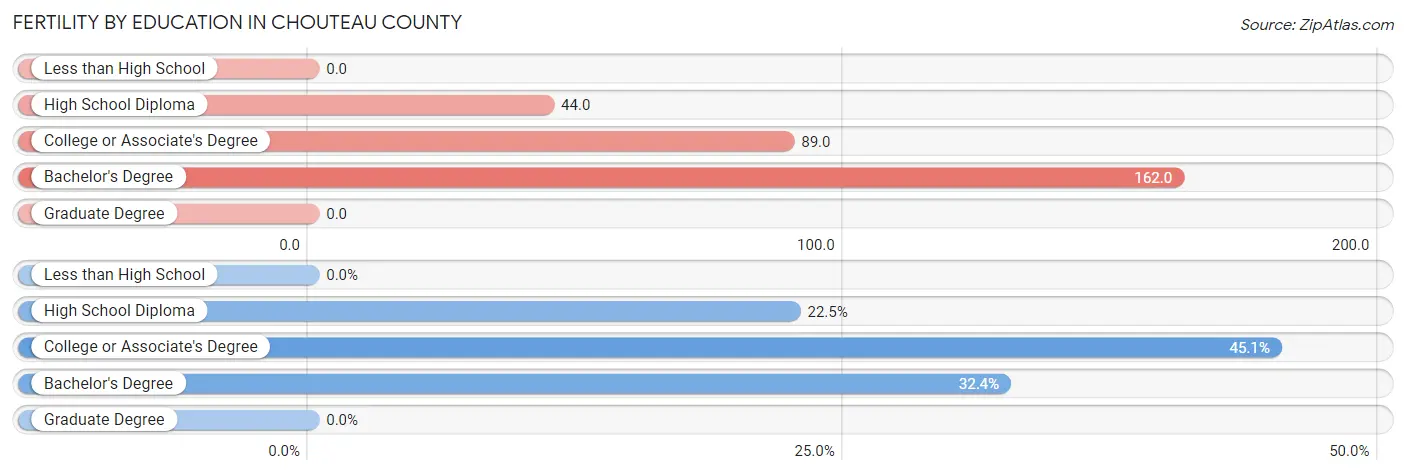
| Educational Attainment | Women with Births | Births / 1,000 Women |
| Less than High School | 0 (0.0%) | 0.0 |
| High School Diploma | 16 (22.5%) | 44.0 |
| College or Associate's Degree | 32 (45.1%) | 89.0 |
| Bachelor's Degree | 23 (32.4%) | 162.0 |
| Graduate Degree | 0 (0.0%) | 0.0 |
| Total | 71 (100.0%) | 59.0 |
Fertility by Education by Marriage Status in Chouteau County
56.3% of women with births in Chouteau County are unmarried. Women with the educational attainment of bachelor's degree are most likely to be married with 100.0% of them married at childbirth, while women with the educational attainment of high school diploma are least likely to be married with 87.5% of them unmarried at childbirth.
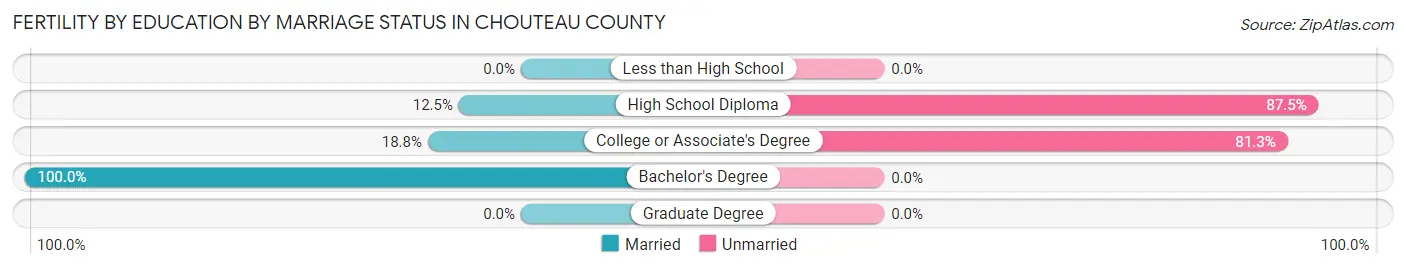
| Educational Attainment | Married | Unmarried |
| Less than High School | 0 (0.0%) | 0 (0.0%) |
| High School Diploma | 2 (12.5%) | 14 (87.5%) |
| College or Associate's Degree | 6 (18.8%) | 26 (81.2%) |
| Bachelor's Degree | 23 (100.0%) | 0 (0.0%) |
| Graduate Degree | 0 (0.0%) | 0 (0.0%) |
| Total | 31 (43.7%) | 40 (56.3%) |
Employment Characteristics in Chouteau County
Employment by Class of Employer in Chouteau County
Among the 2,495 employed individuals in Chouteau County, private company employees (936 | 37.5%), local government employees (447 | 17.9%), and self-employed (not incorporated) (341 | 13.7%) make up the most common classes of employment.
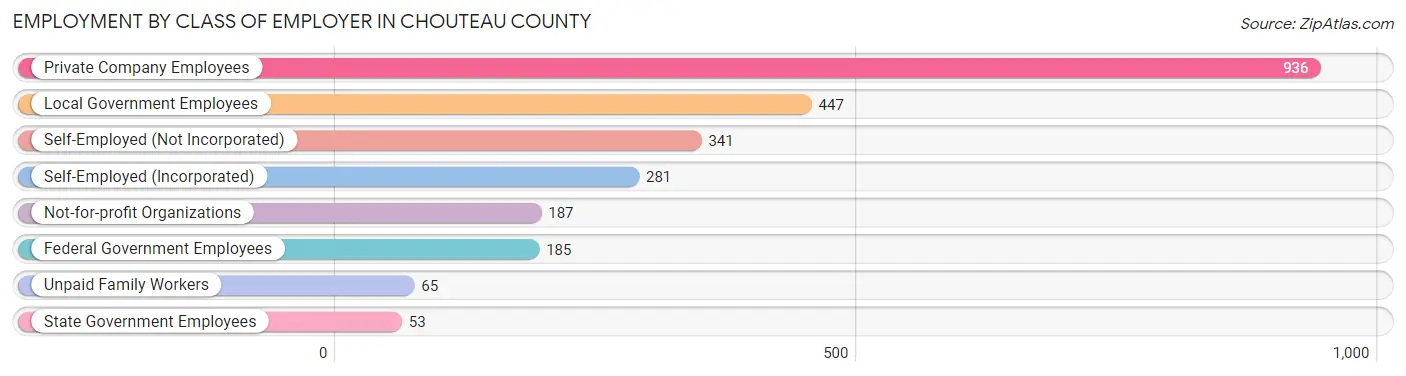
| Employer Class | # Employees | % Employees |
| Private Company Employees | 936 | 37.5% |
| Self-Employed (Incorporated) | 281 | 11.3% |
| Self-Employed (Not Incorporated) | 341 | 13.7% |
| Not-for-profit Organizations | 187 | 7.5% |
| Local Government Employees | 447 | 17.9% |
| State Government Employees | 53 | 2.1% |
| Federal Government Employees | 185 | 7.4% |
| Unpaid Family Workers | 65 | 2.6% |
| Total | 2,495 | 100.0% |
Employment Status by Age in Chouteau County
According to the labor force statistics for Chouteau County, out of the total population over 16 years of age (4,742), 55.7% or 2,641 individuals are in the labor force, with 5.2% or 137 of them unemployed. The age group with the highest labor force participation rate is 25 to 29 years, with 84.5% or 246 individuals in the labor force. Within the labor force, the 16 to 19 years age range has the highest percentage of unemployed individuals, with 66.7% or 52 of them being unemployed.
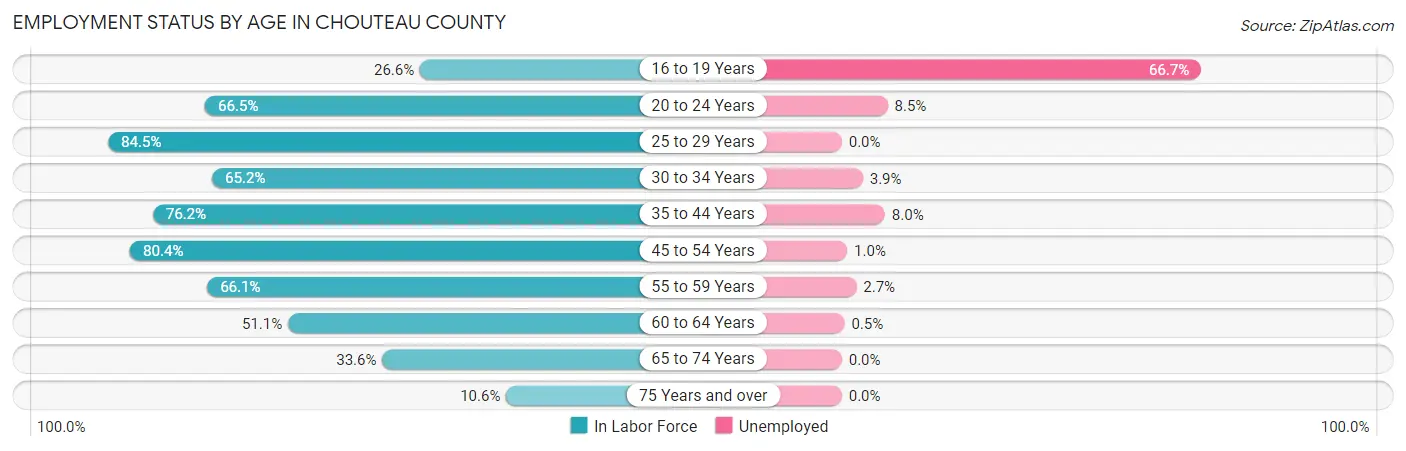
| Age Bracket | In Labor Force | Unemployed |
| 16 to 19 Years | 78 (26.6%) | 52 (66.7%) |
| 20 to 24 Years | 246 (66.5%) | 21 (8.5%) |
| 25 to 29 Years | 246 (84.5%) | 0 (0.0%) |
| 30 to 34 Years | 232 (65.2%) | 9 (3.9%) |
| 35 to 44 Years | 511 (76.2%) | 41 (8.0%) |
| 45 to 54 Years | 503 (80.4%) | 5 (1.0%) |
| 55 to 59 Years | 294 (66.1%) | 8 (2.7%) |
| 60 to 64 Years | 210 (51.1%) | 1 (0.5%) |
| 65 to 74 Years | 271 (33.6%) | 0 (0.0%) |
| 75 Years and over | 50 (10.6%) | 0 (0.0%) |
| Total | 2,641 (55.7%) | 137 (5.2%) |
Employment Status by Educational Attainment in Chouteau County
According to labor force statistics for Chouteau County, 71.3% of individuals (1,996) out of the total population between 25 and 64 years of age (2,800) are in the labor force, with 3.2% or 64 of them being unemployed. The group with the highest labor force participation rate are those with the educational attainment of bachelor's degree or higher, with 84.4% or 545 individuals in the labor force. Within the labor force, individuals with less than high school education have the highest percentage of unemployment, with 10.5% or 9 of them being unemployed.
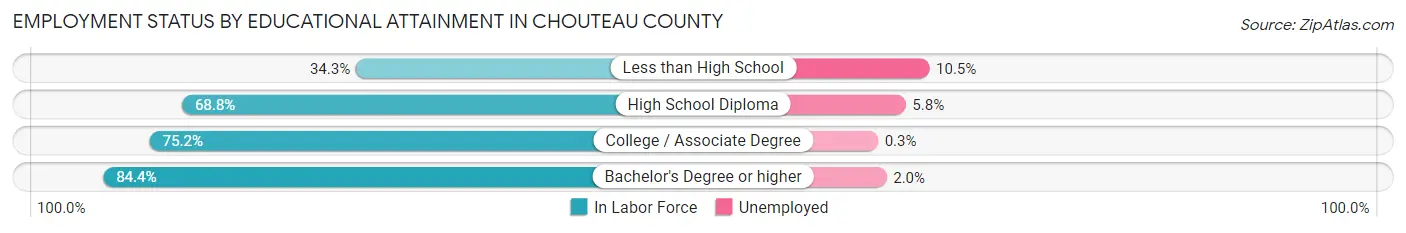
| Educational Attainment | In Labor Force | Unemployed |
| Less than High School | 86 (34.3%) | 26 (10.5%) |
| High School Diploma | 718 (68.8%) | 60 (5.8%) |
| College / Associate Degree | 647 (75.2%) | 3 (0.3%) |
| Bachelor's Degree or higher | 545 (84.4%) | 13 (2.0%) |
| Total | 1,996 (71.3%) | 90 (3.2%) |
Employment Occupations by Sex in Chouteau County
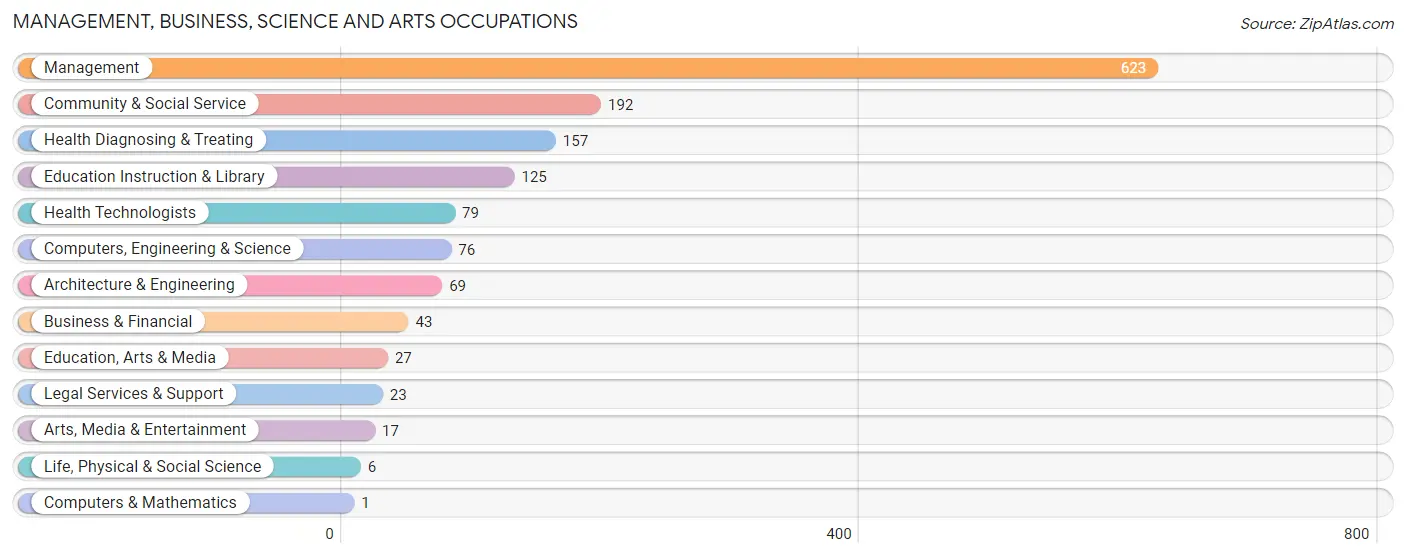
Management, Business, Science and Arts Occupations
The most common Management, Business, Science and Arts occupations in Chouteau County are Management (623 | 25.1%), Community & Social Service (192 | 7.7%), Health Diagnosing & Treating (157 | 6.3%), Education Instruction & Library (125 | 5.0%), and Health Technologists (79 | 3.2%).
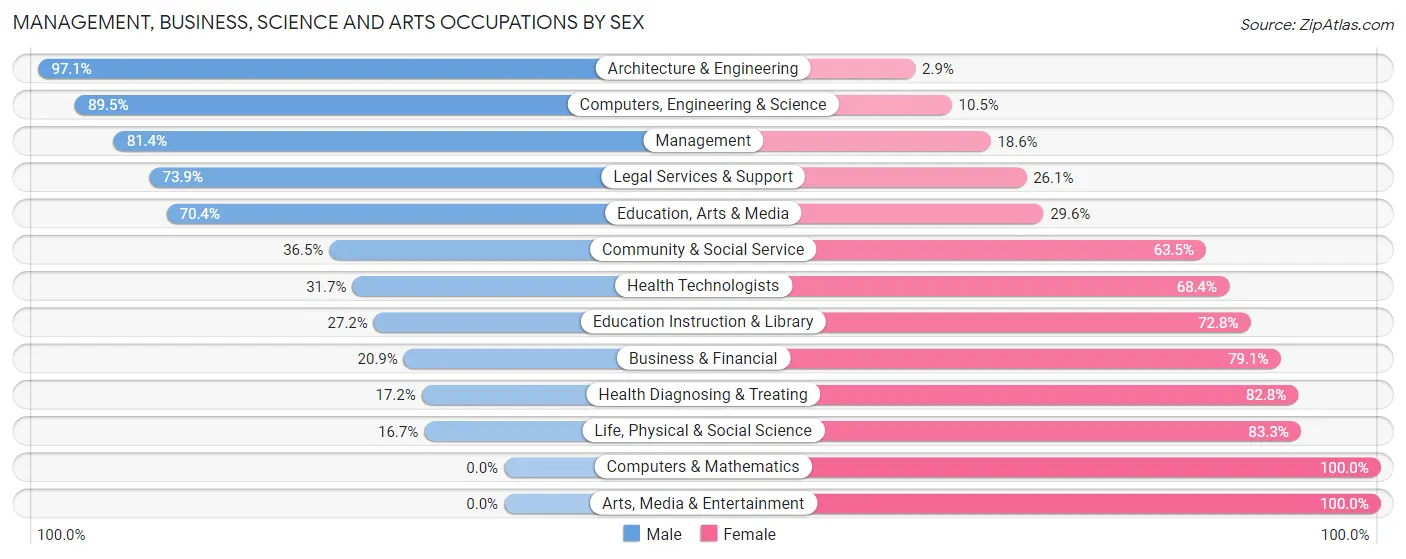
Management, Business, Science and Arts Occupations by Sex
Within the Management, Business, Science and Arts occupations in Chouteau County, the most male-oriented occupations are Architecture & Engineering (97.1%), Computers, Engineering & Science (89.5%), and Management (81.4%), while the most female-oriented occupations are Computers & Mathematics (100.0%), Arts, Media & Entertainment (100.0%), and Life, Physical & Social Science (83.3%).
| Occupation | Male | Female |
| Management | 507 (81.4%) | 116 (18.6%) |
| Business & Financial | 9 (20.9%) | 34 (79.1%) |
| Computers, Engineering & Science | 68 (89.5%) | 8 (10.5%) |
| Computers & Mathematics | 0 (0.0%) | 1 (100.0%) |
| Architecture & Engineering | 67 (97.1%) | 2 (2.9%) |
| Life, Physical & Social Science | 1 (16.7%) | 5 (83.3%) |
| Community & Social Service | 70 (36.5%) | 122 (63.5%) |
| Education, Arts & Media | 19 (70.4%) | 8 (29.6%) |
| Legal Services & Support | 17 (73.9%) | 6 (26.1%) |
| Education Instruction & Library | 34 (27.2%) | 91 (72.8%) |
| Arts, Media & Entertainment | 0 (0.0%) | 17 (100.0%) |
| Health Diagnosing & Treating | 27 (17.2%) | 130 (82.8%) |
| Health Technologists | 25 (31.7%) | 54 (68.3%) |
| Total (Category) | 681 (62.4%) | 410 (37.6%) |
| Total (Overall) | 1,374 (55.3%) | 1,112 (44.7%) |
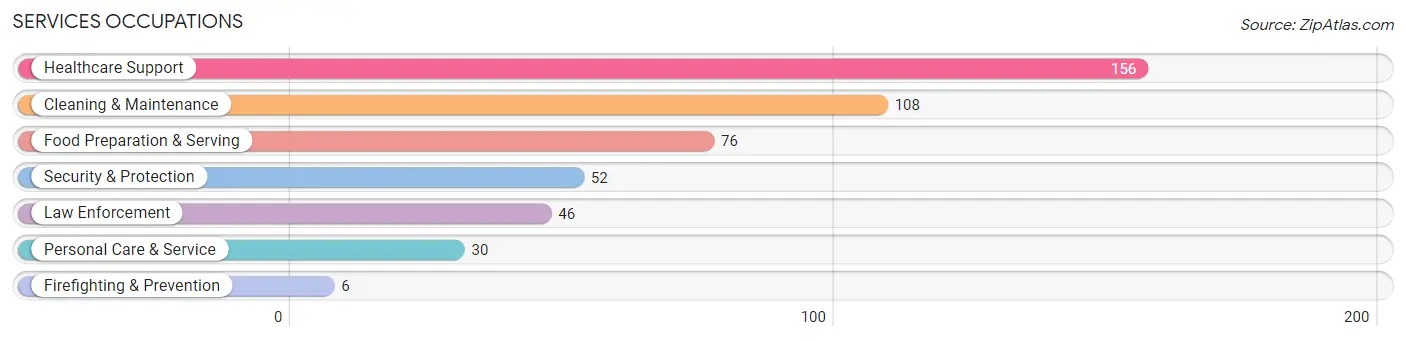
Services Occupations
The most common Services occupations in Chouteau County are Healthcare Support (156 | 6.3%), Cleaning & Maintenance (108 | 4.3%), Food Preparation & Serving (76 | 3.1%), Security & Protection (52 | 2.1%), and Law Enforcement (46 | 1.8%).
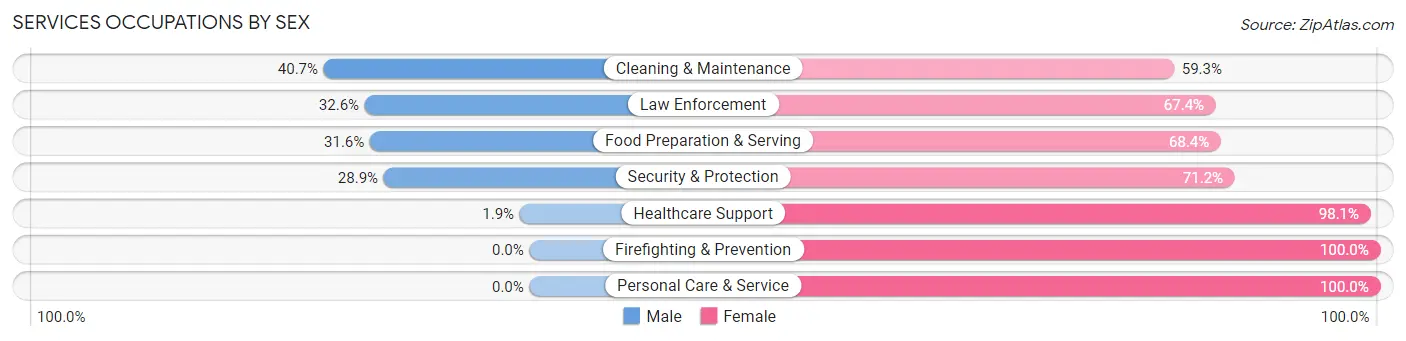
Services Occupations by Sex
Within the Services occupations in Chouteau County, the most male-oriented occupations are Cleaning & Maintenance (40.7%), Law Enforcement (32.6%), and Food Preparation & Serving (31.6%), while the most female-oriented occupations are Firefighting & Prevention (100.0%), Personal Care & Service (100.0%), and Healthcare Support (98.1%).
| Occupation | Male | Female |
| Healthcare Support | 3 (1.9%) | 153 (98.1%) |
| Security & Protection | 15 (28.8%) | 37 (71.2%) |
| Firefighting & Prevention | 0 (0.0%) | 6 (100.0%) |
| Law Enforcement | 15 (32.6%) | 31 (67.4%) |
| Food Preparation & Serving | 24 (31.6%) | 52 (68.4%) |
| Cleaning & Maintenance | 44 (40.7%) | 64 (59.3%) |
| Personal Care & Service | 0 (0.0%) | 30 (100.0%) |
| Total (Category) | 86 (20.4%) | 336 (79.6%) |
| Total (Overall) | 1,374 (55.3%) | 1,112 (44.7%) |
Sales and Office Occupations
The most common Sales and Office occupations in Chouteau County are Office & Administration (279 | 11.2%), and Sales & Related (93 | 3.7%).
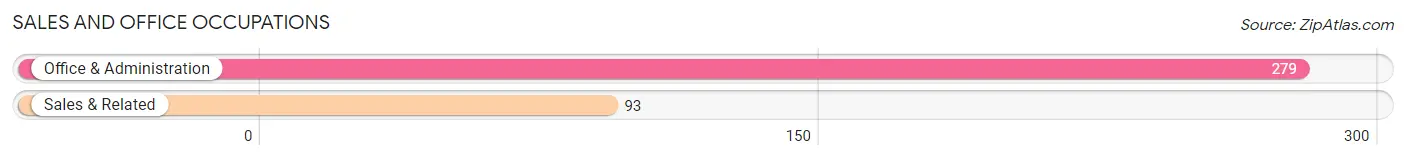
Sales and Office Occupations by Sex
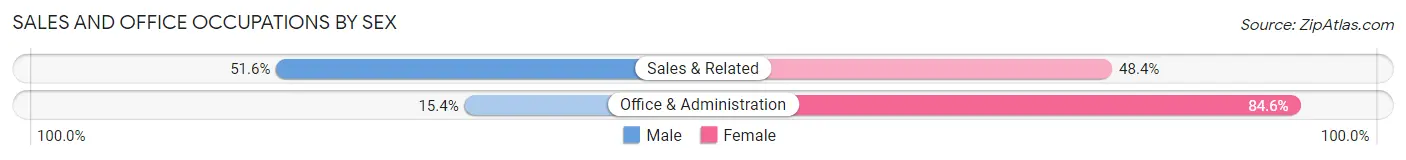
| Occupation | Male | Female |
| Sales & Related | 48 (51.6%) | 45 (48.4%) |
| Office & Administration | 43 (15.4%) | 236 (84.6%) |
| Total (Category) | 91 (24.5%) | 281 (75.5%) |
| Total (Overall) | 1,374 (55.3%) | 1,112 (44.7%) |
Natural Resources, Construction and Maintenance Occupations
The most common Natural Resources, Construction and Maintenance occupations in Chouteau County are Construction & Extraction (168 | 6.8%), Farming, Fishing & Forestry (124 | 5.0%), and Installation, Maintenance & Repair (52 | 2.1%).
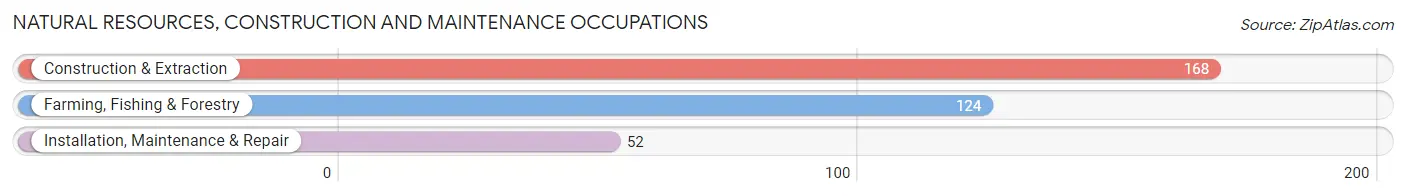
Natural Resources, Construction and Maintenance Occupations by Sex
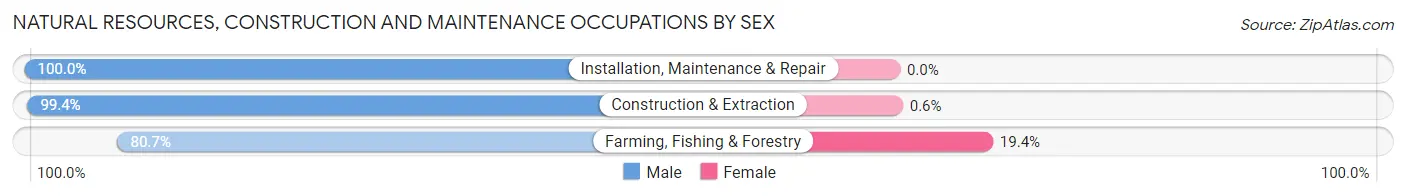
| Occupation | Male | Female |
| Farming, Fishing & Forestry | 100 (80.6%) | 24 (19.4%) |
| Construction & Extraction | 167 (99.4%) | 1 (0.6%) |
| Installation, Maintenance & Repair | 52 (100.0%) | 0 (0.0%) |
| Total (Category) | 319 (92.7%) | 25 (7.3%) |
| Total (Overall) | 1,374 (55.3%) | 1,112 (44.7%) |
Production, Transportation and Moving Occupations
The most common Production, Transportation and Moving occupations in Chouteau County are Transportation (94 | 3.8%), Material Moving (88 | 3.5%), and Production (75 | 3.0%).
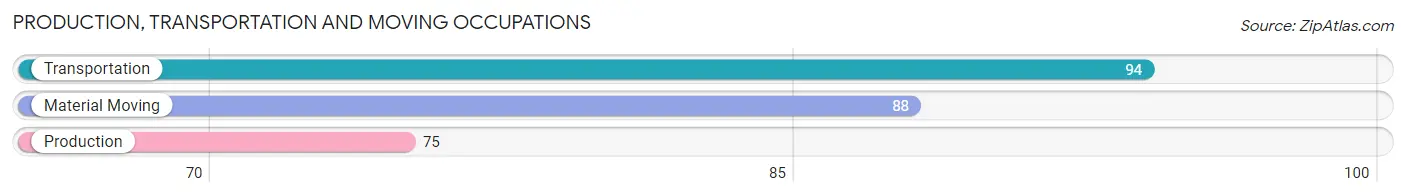
Production, Transportation and Moving Occupations by Sex
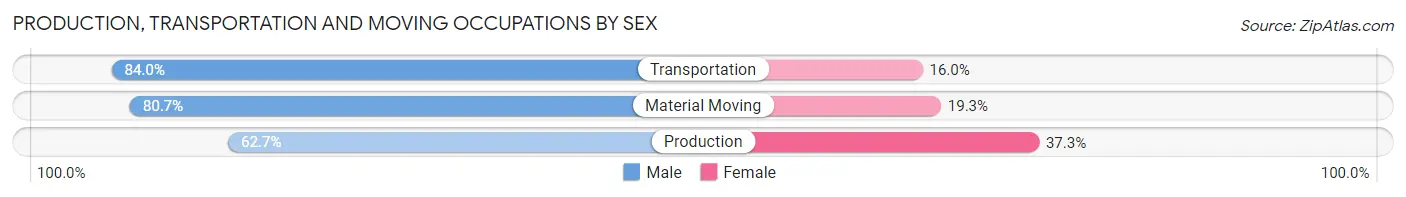
| Occupation | Male | Female |
| Production | 47 (62.7%) | 28 (37.3%) |
| Transportation | 79 (84.0%) | 15 (16.0%) |
| Material Moving | 71 (80.7%) | 17 (19.3%) |
| Total (Category) | 197 (76.6%) | 60 (23.4%) |
| Total (Overall) | 1,374 (55.3%) | 1,112 (44.7%) |
Employment Industries by Sex in Chouteau County
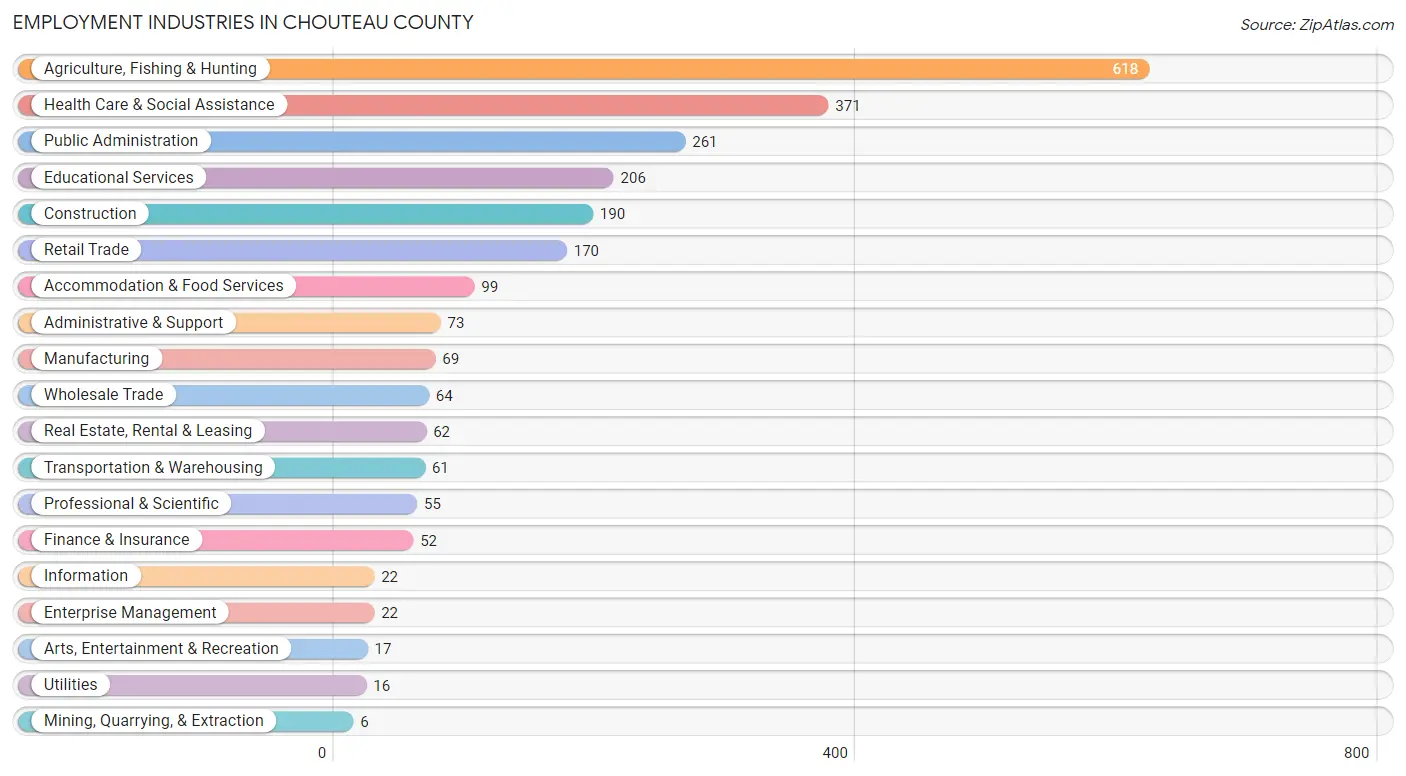
Employment Industries in Chouteau County
The major employment industries in Chouteau County include Agriculture, Fishing & Hunting (618 | 24.9%), Health Care & Social Assistance (371 | 14.9%), Public Administration (261 | 10.5%), Educational Services (206 | 8.3%), and Construction (190 | 7.6%).
Employment Industries by Sex in Chouteau County
The Chouteau County industries that see more men than women are Mining, Quarrying, & Extraction (100.0%), Construction (96.3%), and Wholesale Trade (89.1%), whereas the industries that tend to have a higher number of women are Enterprise Management (100.0%), Professional & Scientific (85.5%), and Real Estate, Rental & Leasing (83.9%).
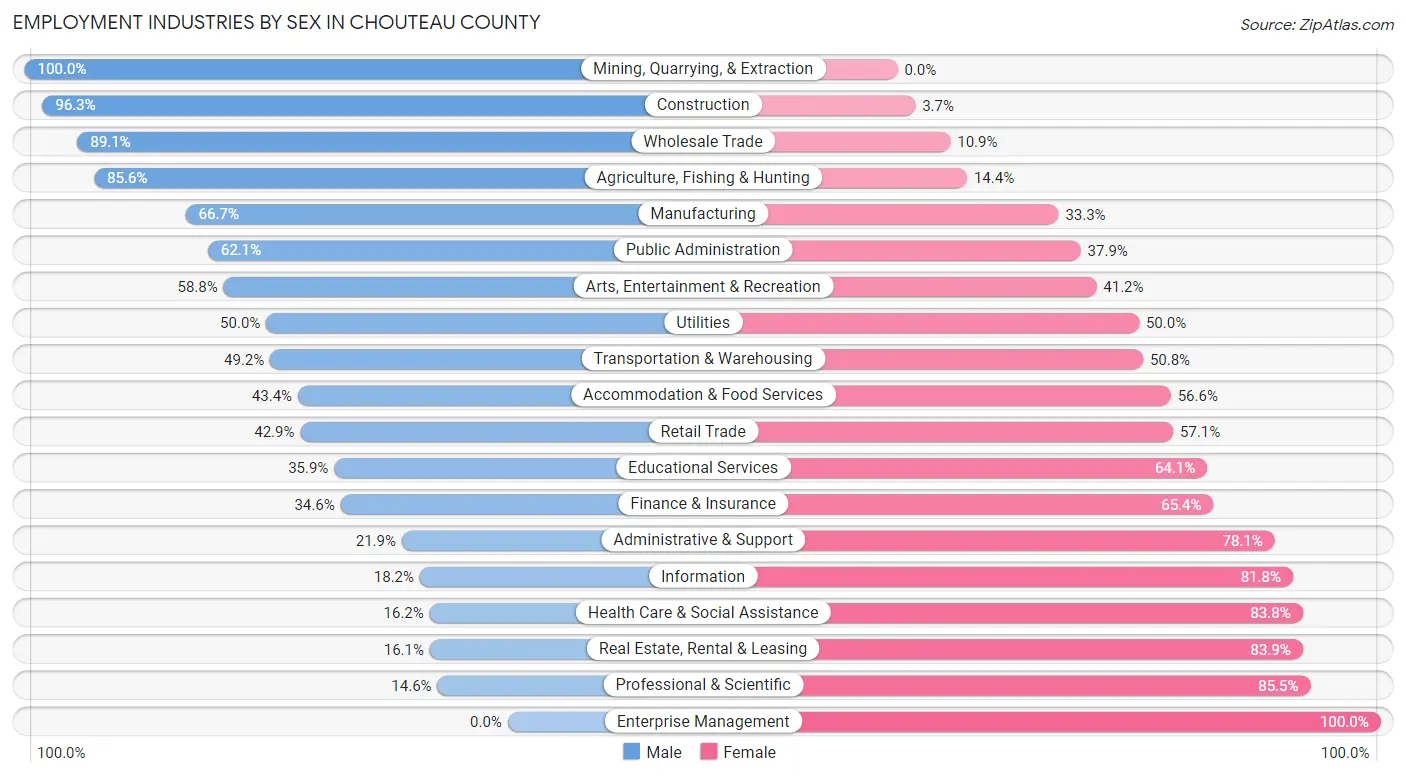
| Industry | Male | Female |
| Agriculture, Fishing & Hunting | 529 (85.6%) | 89 (14.4%) |
| Mining, Quarrying, & Extraction | 6 (100.0%) | 0 (0.0%) |
| Construction | 183 (96.3%) | 7 (3.7%) |
| Manufacturing | 46 (66.7%) | 23 (33.3%) |
| Wholesale Trade | 57 (89.1%) | 7 (10.9%) |
| Retail Trade | 73 (42.9%) | 97 (57.1%) |
| Transportation & Warehousing | 30 (49.2%) | 31 (50.8%) |
| Utilities | 8 (50.0%) | 8 (50.0%) |
| Information | 4 (18.2%) | 18 (81.8%) |
| Finance & Insurance | 18 (34.6%) | 34 (65.4%) |
| Real Estate, Rental & Leasing | 10 (16.1%) | 52 (83.9%) |
| Professional & Scientific | 8 (14.5%) | 47 (85.5%) |
| Enterprise Management | 0 (0.0%) | 22 (100.0%) |
| Administrative & Support | 16 (21.9%) | 57 (78.1%) |
| Educational Services | 74 (35.9%) | 132 (64.1%) |
| Health Care & Social Assistance | 60 (16.2%) | 311 (83.8%) |
| Arts, Entertainment & Recreation | 10 (58.8%) | 7 (41.2%) |
| Accommodation & Food Services | 43 (43.4%) | 56 (56.6%) |
| Public Administration | 162 (62.1%) | 99 (37.9%) |
| Total | 1,374 (55.3%) | 1,112 (44.7%) |
Education in Chouteau County
School Enrollment in Chouteau County
The most common levels of schooling among the 1,123 students in Chouteau County are elementary school (332 | 29.6%), high school (264 | 23.5%), and middle school (243 | 21.6%).
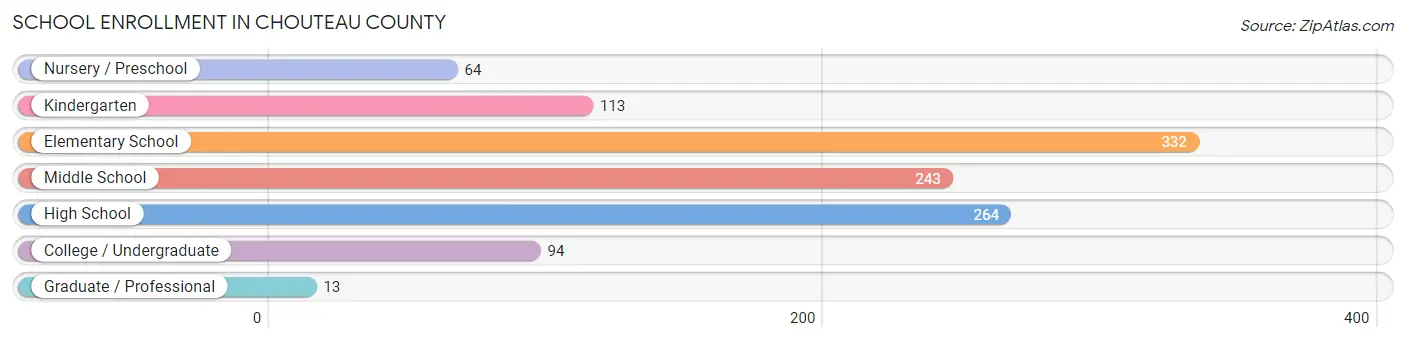
| School Level | # Students | % Students |
| Nursery / Preschool | 64 | 5.7% |
| Kindergarten | 113 | 10.1% |
| Elementary School | 332 | 29.6% |
| Middle School | 243 | 21.6% |
| High School | 264 | 23.5% |
| College / Undergraduate | 94 | 8.4% |
| Graduate / Professional | 13 | 1.2% |
| Total | 1,123 | 100.0% |
School Enrollment by Age by Funding Source in Chouteau County
Out of a total of 1,123 students who are enrolled in schools in Chouteau County, 77 (6.9%) attend a private institution, while the remaining 1,046 (93.1%) are enrolled in public schools. The age group of 35 years and over has the highest likelihood of being enrolled in private schools, with 7 (41.2% in the age bracket) enrolled. Conversely, the age group of 3 to 4 year olds has the lowest likelihood of being enrolled in a private school, with 23 (100.0% in the age bracket) attending a public institution.
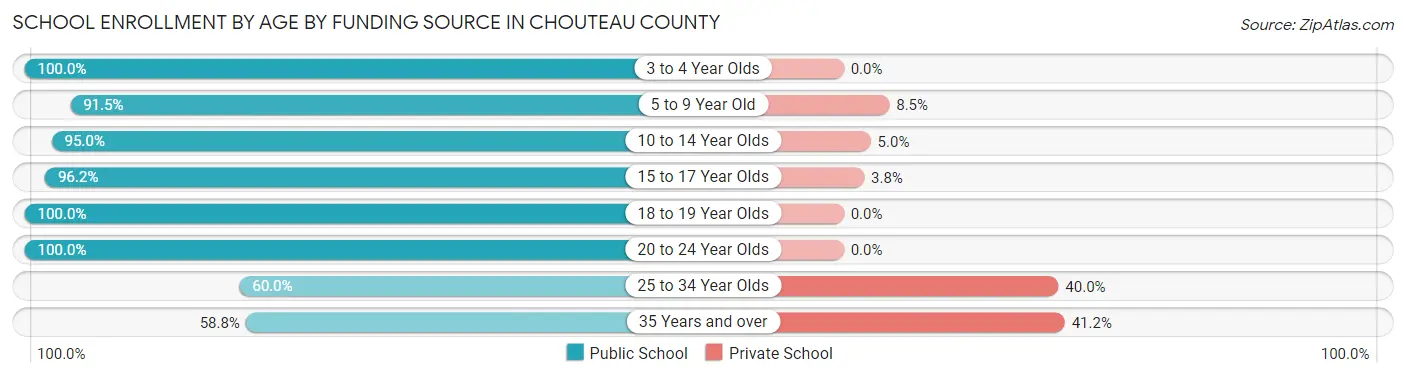
| Age Bracket | Public School | Private School |
| 3 to 4 Year Olds | 23 (100.0%) | 0 (0.0%) |
| 5 to 9 Year Old | 377 (91.5%) | 35 (8.5%) |
| 10 to 14 Year Olds | 283 (95.0%) | 15 (5.0%) |
| 15 to 17 Year Olds | 253 (96.2%) | 10 (3.8%) |
| 18 to 19 Year Olds | 20 (100.0%) | 0 (0.0%) |
| 20 to 24 Year Olds | 65 (100.0%) | 0 (0.0%) |
| 25 to 34 Year Olds | 15 (60.0%) | 10 (40.0%) |
| 35 Years and over | 10 (58.8%) | 7 (41.2%) |
| Total | 1,046 (93.1%) | 77 (6.9%) |
Educational Attainment by Field of Study in Chouteau County
Education (297 | 28.1%), bio, nature & agricultural (209 | 19.8%), science & technology (93 | 8.8%), business (92 | 8.7%), and social sciences (67 | 6.4%) are the most common fields of study among 1,055 individuals in Chouteau County who have obtained a bachelor's degree or higher.
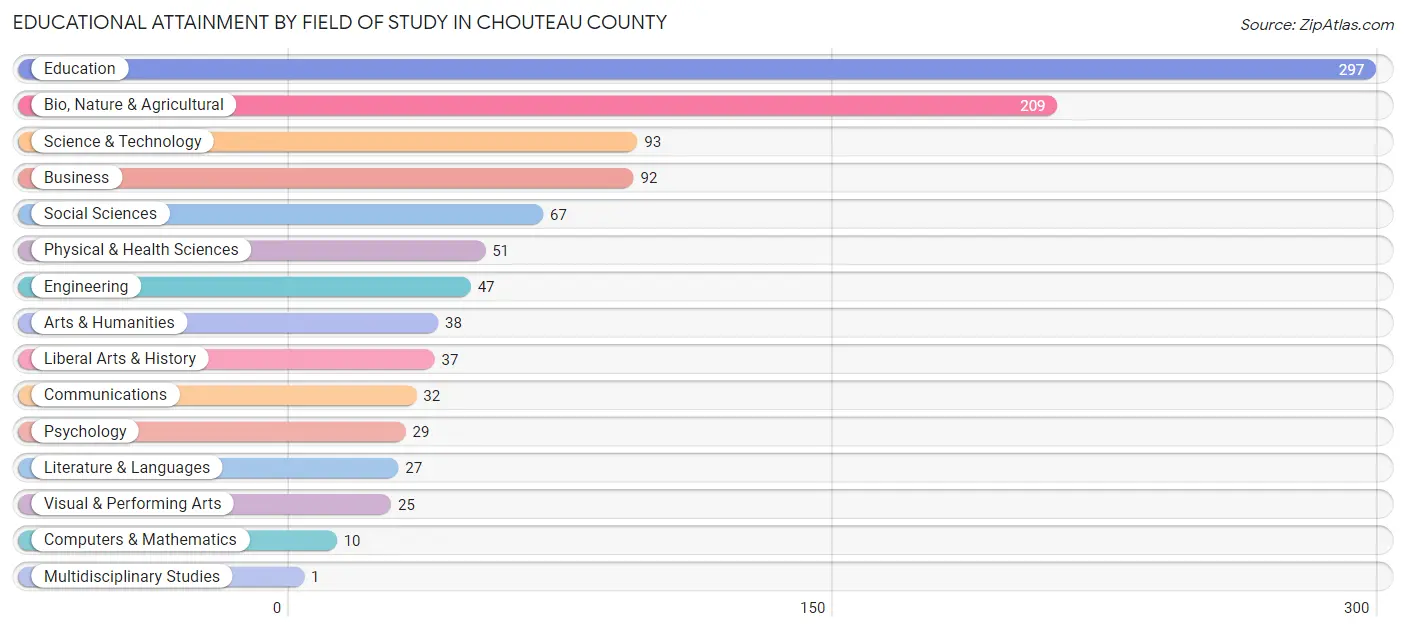
| Field of Study | # Graduates | % Graduates |
| Computers & Mathematics | 10 | 0.9% |
| Bio, Nature & Agricultural | 209 | 19.8% |
| Physical & Health Sciences | 51 | 4.8% |
| Psychology | 29 | 2.8% |
| Social Sciences | 67 | 6.4% |
| Engineering | 47 | 4.4% |
| Multidisciplinary Studies | 1 | 0.1% |
| Science & Technology | 93 | 8.8% |
| Business | 92 | 8.7% |
| Education | 297 | 28.1% |
| Literature & Languages | 27 | 2.6% |
| Liberal Arts & History | 37 | 3.5% |
| Visual & Performing Arts | 25 | 2.4% |
| Communications | 32 | 3.0% |
| Arts & Humanities | 38 | 3.6% |
| Total | 1,055 | 100.0% |
Transportation & Commute in Chouteau County
Vehicle Availability by Sex in Chouteau County
The most prevalent vehicle ownership categories in Chouteau County are males with 2 vehicles (501, accounting for 37.0%) and females with 2 vehicles (311, making up 45.8%).
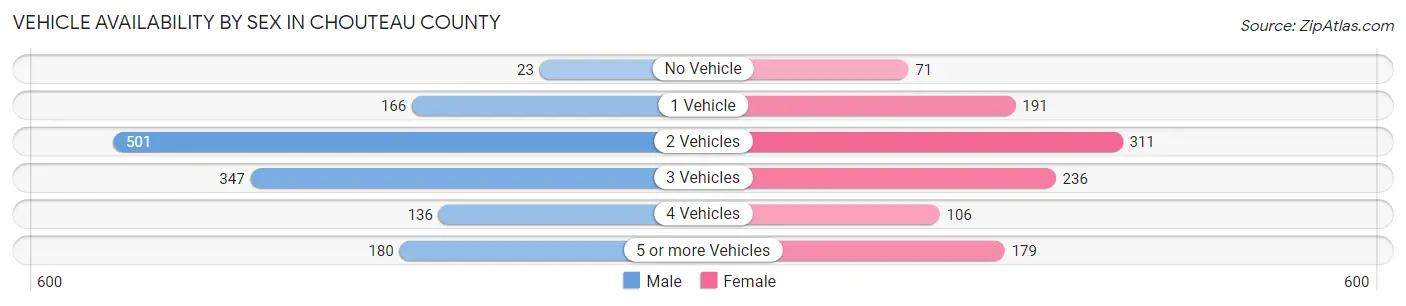
| Vehicles Available | Male | Female |
| No Vehicle | 23 (1.7%) | 71 (6.5%) |
| 1 Vehicle | 166 (12.3%) | 191 (17.5%) |
| 2 Vehicles | 501 (37.0%) | 311 (28.4%) |
| 3 Vehicles | 347 (25.7%) | 236 (21.6%) |
| 4 Vehicles | 136 (10.1%) | 106 (9.7%) |
| 5 or more Vehicles | 180 (13.3%) | 179 (16.4%) |
| Total | 1,353 (100.0%) | 1,094 (100.0%) |
Commute Time in Chouteau County
The most frequently occuring commute durations in Chouteau County are 15 to 19 minutes (408 commuters, 18.6%), less than 5 minutes (305 commuters, 13.9%), and 10 to 14 minutes (289 commuters, 13.2%).
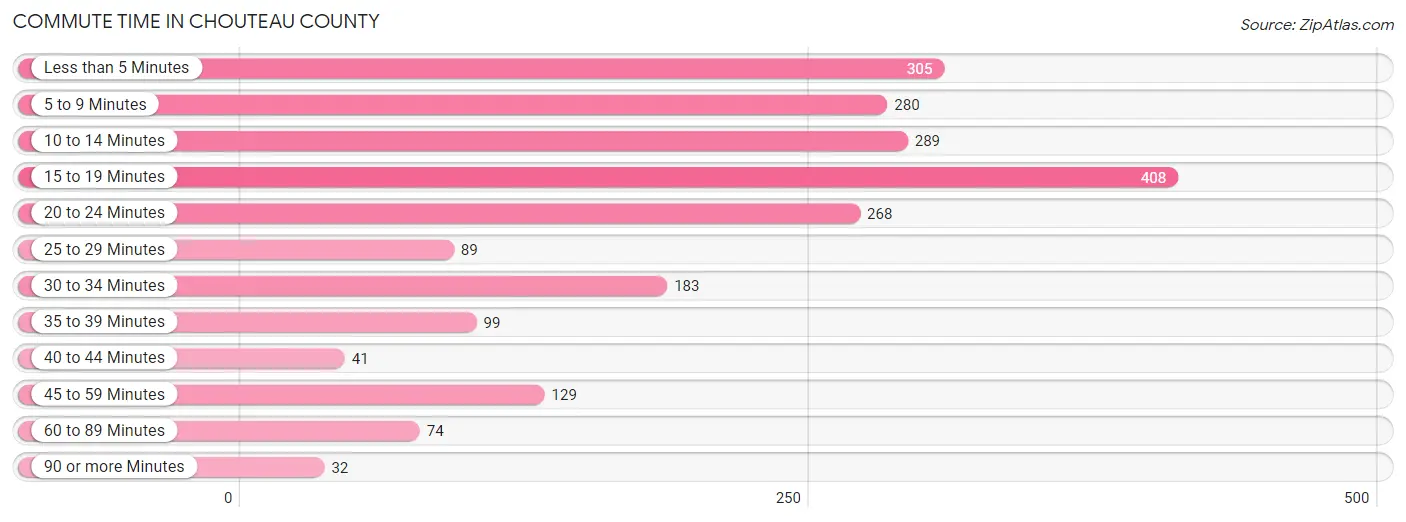
| Commute Time | # Commuters | % Commuters |
| Less than 5 Minutes | 305 | 13.9% |
| 5 to 9 Minutes | 280 | 12.7% |
| 10 to 14 Minutes | 289 | 13.2% |
| 15 to 19 Minutes | 408 | 18.6% |
| 20 to 24 Minutes | 268 | 12.2% |
| 25 to 29 Minutes | 89 | 4.1% |
| 30 to 34 Minutes | 183 | 8.3% |
| 35 to 39 Minutes | 99 | 4.5% |
| 40 to 44 Minutes | 41 | 1.9% |
| 45 to 59 Minutes | 129 | 5.9% |
| 60 to 89 Minutes | 74 | 3.4% |
| 90 or more Minutes | 32 | 1.5% |
Commute Time by Sex in Chouteau County
The most common commute times in Chouteau County are 15 to 19 minutes (258 commuters, 20.3%) for males and 15 to 19 minutes (150 commuters, 16.2%) for females.
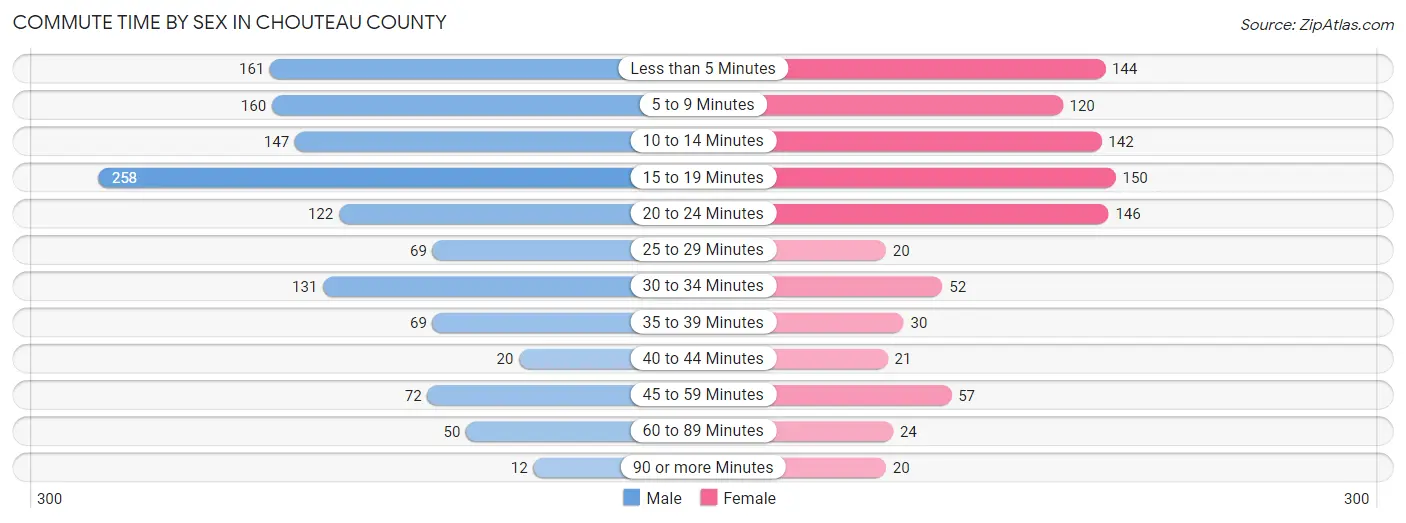
| Commute Time | Male | Female |
| Less than 5 Minutes | 161 (12.7%) | 144 (15.5%) |
| 5 to 9 Minutes | 160 (12.6%) | 120 (13.0%) |
| 10 to 14 Minutes | 147 (11.6%) | 142 (15.3%) |
| 15 to 19 Minutes | 258 (20.3%) | 150 (16.2%) |
| 20 to 24 Minutes | 122 (9.6%) | 146 (15.8%) |
| 25 to 29 Minutes | 69 (5.4%) | 20 (2.2%) |
| 30 to 34 Minutes | 131 (10.3%) | 52 (5.6%) |
| 35 to 39 Minutes | 69 (5.4%) | 30 (3.2%) |
| 40 to 44 Minutes | 20 (1.6%) | 21 (2.3%) |
| 45 to 59 Minutes | 72 (5.7%) | 57 (6.2%) |
| 60 to 89 Minutes | 50 (3.9%) | 24 (2.6%) |
| 90 or more Minutes | 12 (0.9%) | 20 (2.2%) |
Time of Departure to Work by Sex in Chouteau County
The most frequent times of departure to work in Chouteau County are 8:00 AM to 8:29 AM (308, 24.2%) for males and 7:30 AM to 7:59 AM (247, 26.7%) for females.
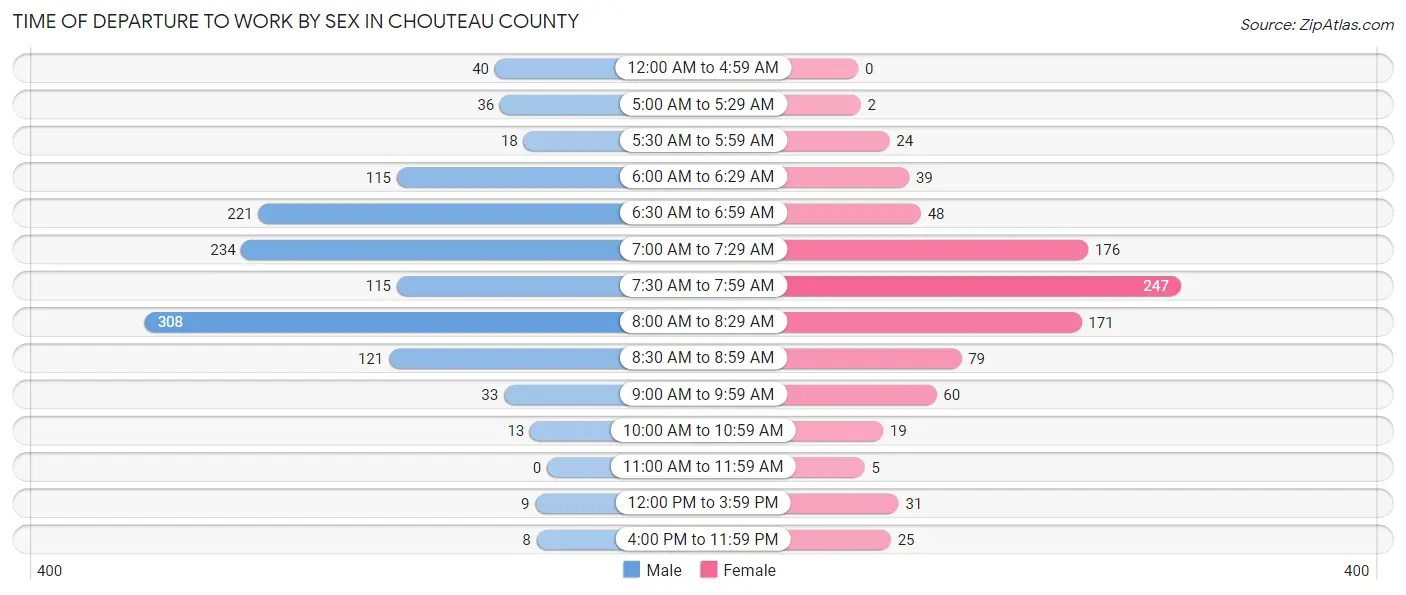
| Time of Departure | Male | Female |
| 12:00 AM to 4:59 AM | 40 (3.2%) | 0 (0.0%) |
| 5:00 AM to 5:29 AM | 36 (2.8%) | 2 (0.2%) |
| 5:30 AM to 5:59 AM | 18 (1.4%) | 24 (2.6%) |
| 6:00 AM to 6:29 AM | 115 (9.0%) | 39 (4.2%) |
| 6:30 AM to 6:59 AM | 221 (17.4%) | 48 (5.2%) |
| 7:00 AM to 7:29 AM | 234 (18.4%) | 176 (19.0%) |
| 7:30 AM to 7:59 AM | 115 (9.0%) | 247 (26.7%) |
| 8:00 AM to 8:29 AM | 308 (24.2%) | 171 (18.5%) |
| 8:30 AM to 8:59 AM | 121 (9.5%) | 79 (8.5%) |
| 9:00 AM to 9:59 AM | 33 (2.6%) | 60 (6.5%) |
| 10:00 AM to 10:59 AM | 13 (1.0%) | 19 (2.1%) |
| 11:00 AM to 11:59 AM | 0 (0.0%) | 5 (0.5%) |
| 12:00 PM to 3:59 PM | 9 (0.7%) | 31 (3.4%) |
| 4:00 PM to 11:59 PM | 8 (0.6%) | 25 (2.7%) |
| Total | 1,271 (100.0%) | 926 (100.0%) |
Housing Occupancy in Chouteau County
Occupancy by Ownership in Chouteau County
Of the total 2,184 dwellings in Chouteau County, owner-occupied units account for 1,495 (68.4%), while renter-occupied units make up 689 (31.6%).
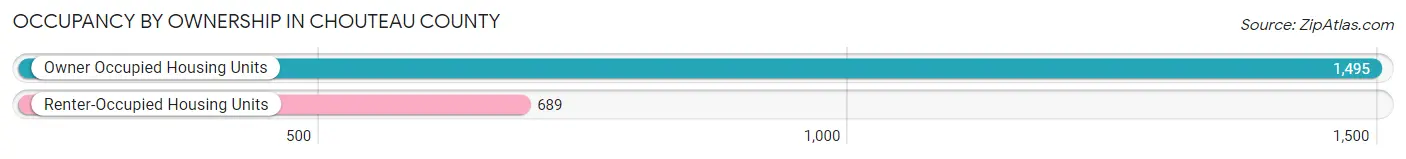
| Occupancy | # Housing Units | % Housing Units |
| Owner Occupied Housing Units | 1,495 | 68.4% |
| Renter-Occupied Housing Units | 689 | 31.6% |
| Total Occupied Housing Units | 2,184 | 100.0% |
Occupancy by Household Size in Chouteau County
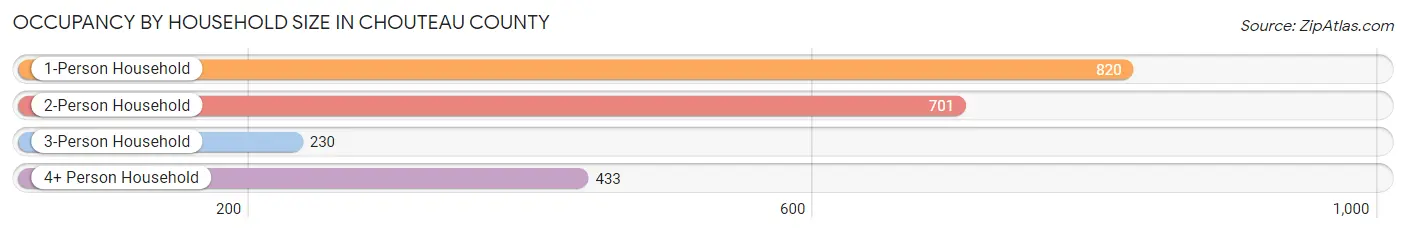
| Household Size | # Housing Units | % Housing Units |
| 1-Person Household | 820 | 37.6% |
| 2-Person Household | 701 | 32.1% |
| 3-Person Household | 230 | 10.5% |
| 4+ Person Household | 433 | 19.8% |
| Total Housing Units | 2,184 | 100.0% |
Occupancy by Ownership by Household Size in Chouteau County
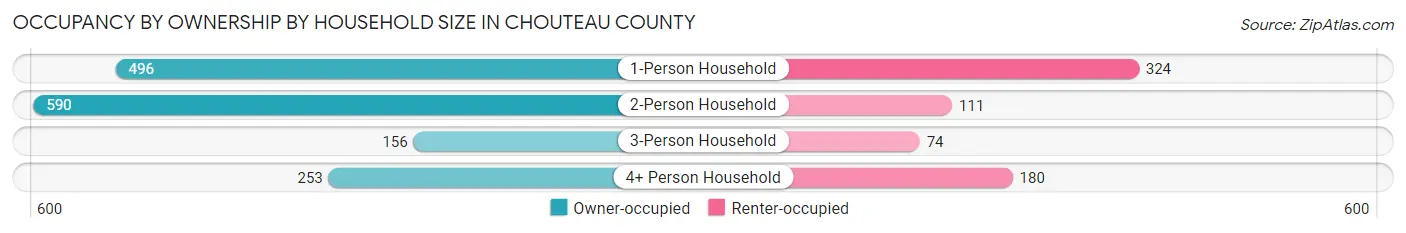
| Household Size | Owner-occupied | Renter-occupied |
| 1-Person Household | 496 (60.5%) | 324 (39.5%) |
| 2-Person Household | 590 (84.2%) | 111 (15.8%) |
| 3-Person Household | 156 (67.8%) | 74 (32.2%) |
| 4+ Person Household | 253 (58.4%) | 180 (41.6%) |
| Total Housing Units | 1,495 (68.4%) | 689 (31.6%) |
Occupancy by Educational Attainment in Chouteau County
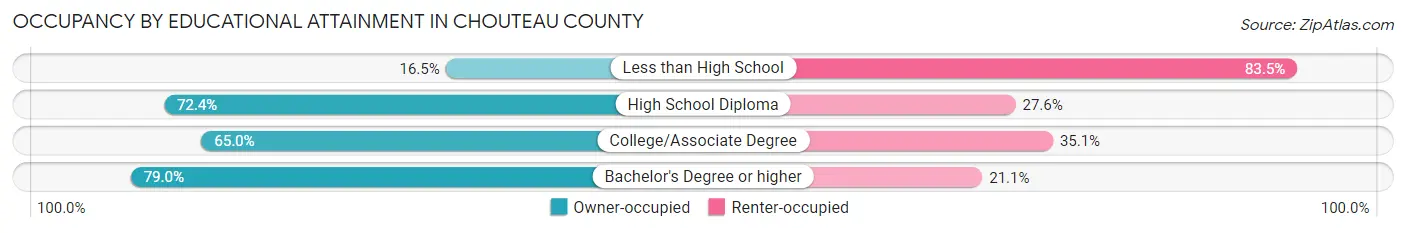
| Household Size | Owner-occupied | Renter-occupied |
| Less than High School | 21 (16.5%) | 106 (83.5%) |
| High School Diploma | 516 (72.4%) | 197 (27.6%) |
| College/Associate Degree | 478 (64.9%) | 258 (35.0%) |
| Bachelor's Degree or higher | 480 (78.9%) | 128 (21.0%) |
Occupancy by Age of Householder in Chouteau County
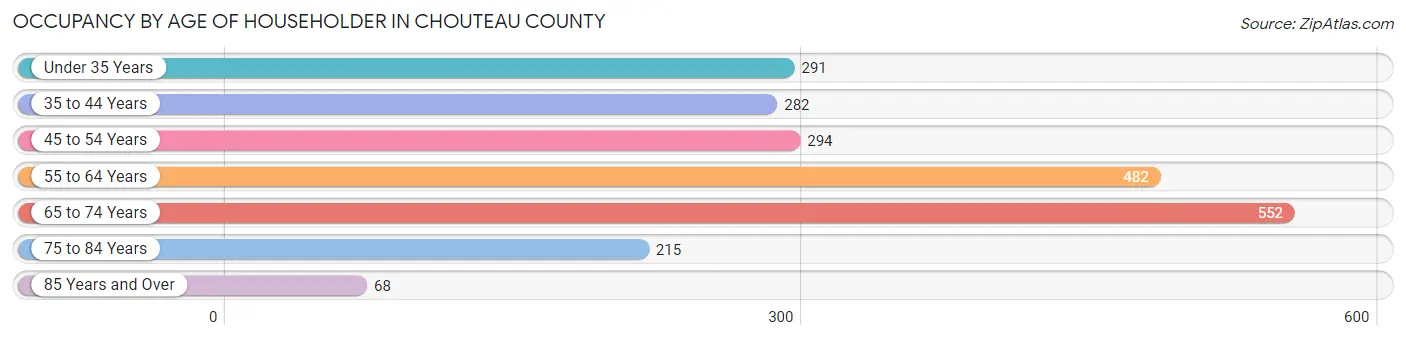
| Age Bracket | # Households | % Households |
| Under 35 Years | 291 | 13.3% |
| 35 to 44 Years | 282 | 12.9% |
| 45 to 54 Years | 294 | 13.5% |
| 55 to 64 Years | 482 | 22.1% |
| 65 to 74 Years | 552 | 25.3% |
| 75 to 84 Years | 215 | 9.8% |
| 85 Years and Over | 68 | 3.1% |
| Total | 2,184 | 100.0% |
Housing Finances in Chouteau County
Median Income by Occupancy in Chouteau County
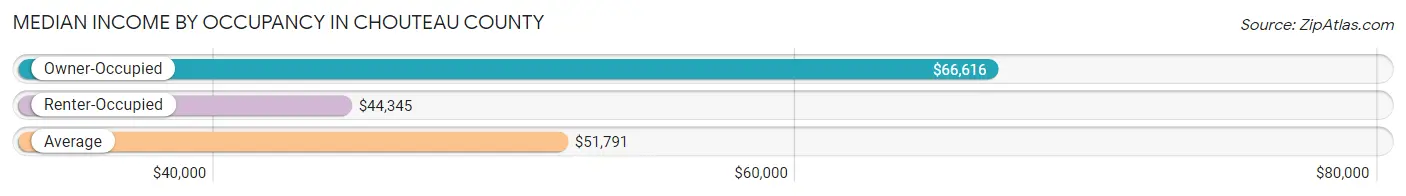
| Occupancy Type | # Households | Median Income |
| Owner-Occupied | 1,495 (68.4%) | $66,616 |
| Renter-Occupied | 689 (31.6%) | $44,345 |
| Average | 2,184 (100.0%) | $51,791 |
Occupancy by Householder Income Bracket in Chouteau County
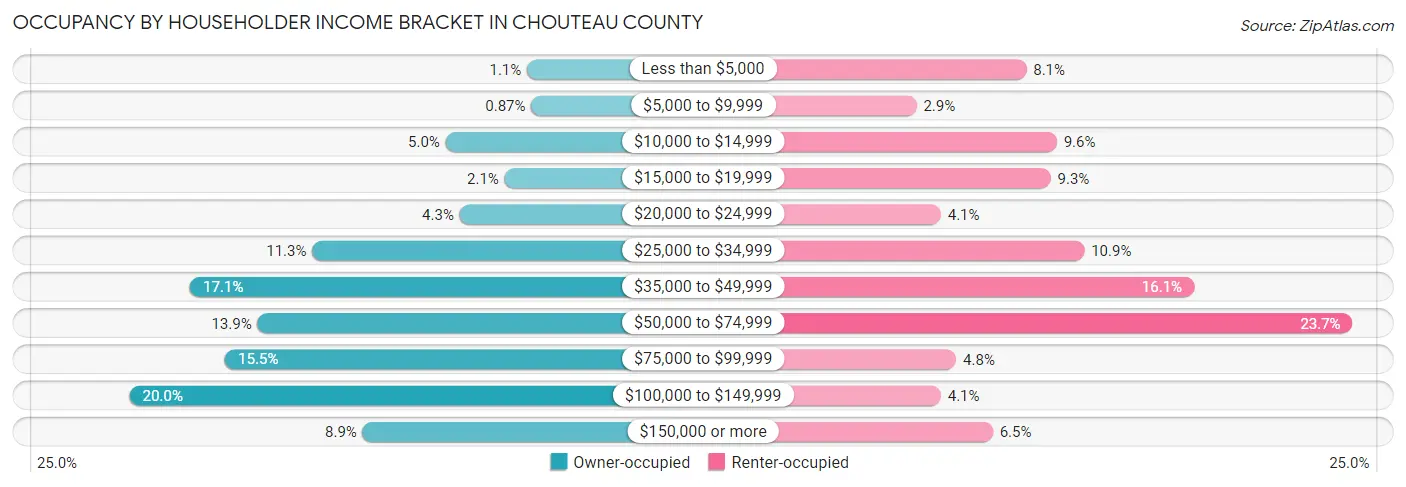
| Income Bracket | Owner-occupied | Renter-occupied |
| Less than $5,000 | 16 (1.1%) | 56 (8.1%) |
| $5,000 to $9,999 | 13 (0.9%) | 20 (2.9%) |
| $10,000 to $14,999 | 74 (5.0%) | 66 (9.6%) |
| $15,000 to $19,999 | 32 (2.1%) | 64 (9.3%) |
| $20,000 to $24,999 | 64 (4.3%) | 28 (4.1%) |
| $25,000 to $34,999 | 169 (11.3%) | 75 (10.9%) |
| $35,000 to $49,999 | 256 (17.1%) | 111 (16.1%) |
| $50,000 to $74,999 | 208 (13.9%) | 163 (23.7%) |
| $75,000 to $99,999 | 231 (15.4%) | 33 (4.8%) |
| $100,000 to $149,999 | 299 (20.0%) | 28 (4.1%) |
| $150,000 or more | 133 (8.9%) | 45 (6.5%) |
| Total | 1,495 (100.0%) | 689 (100.0%) |
Monthly Housing Cost Tiers in Chouteau County
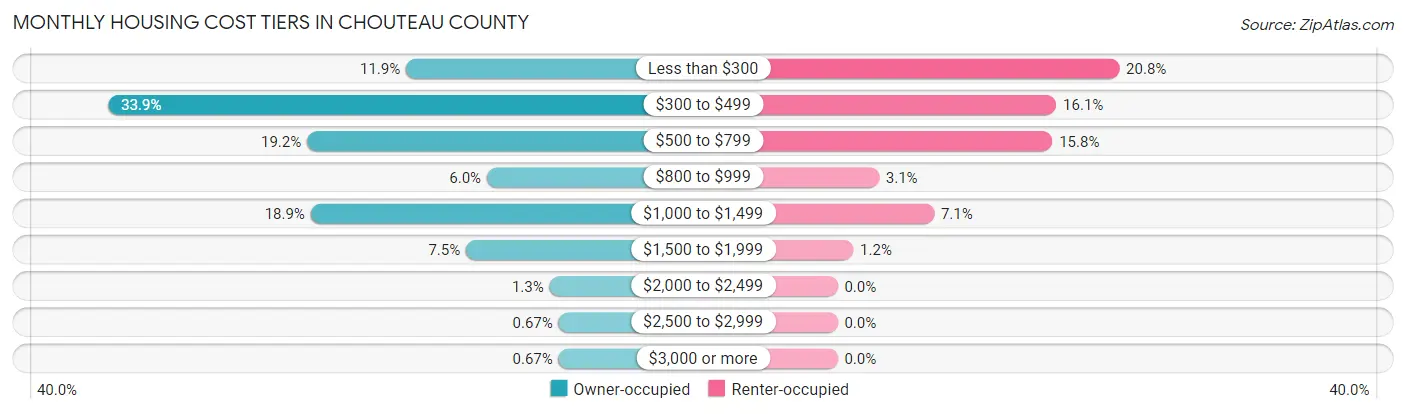
| Monthly Cost | Owner-occupied | Renter-occupied |
| Less than $300 | 178 (11.9%) | 143 (20.7%) |
| $300 to $499 | 506 (33.9%) | 111 (16.1%) |
| $500 to $799 | 287 (19.2%) | 109 (15.8%) |
| $800 to $999 | 89 (5.9%) | 21 (3.0%) |
| $1,000 to $1,499 | 283 (18.9%) | 49 (7.1%) |
| $1,500 to $1,999 | 112 (7.5%) | 8 (1.2%) |
| $2,000 to $2,499 | 20 (1.3%) | 0 (0.0%) |
| $2,500 to $2,999 | 10 (0.7%) | 0 (0.0%) |
| $3,000 or more | 10 (0.7%) | 0 (0.0%) |
| Total | 1,495 (100.0%) | 689 (100.0%) |
Physical Housing Characteristics in Chouteau County
Housing Structures in Chouteau County
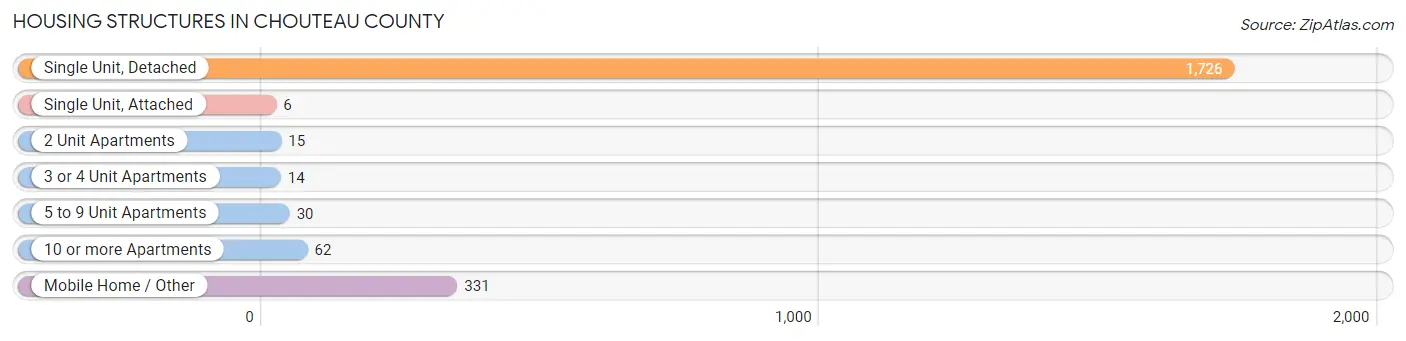
| Structure Type | # Housing Units | % Housing Units |
| Single Unit, Detached | 1,726 | 79.0% |
| Single Unit, Attached | 6 | 0.3% |
| 2 Unit Apartments | 15 | 0.7% |
| 3 or 4 Unit Apartments | 14 | 0.6% |
| 5 to 9 Unit Apartments | 30 | 1.4% |
| 10 or more Apartments | 62 | 2.8% |
| Mobile Home / Other | 331 | 15.2% |
| Total | 2,184 | 100.0% |
Housing Structures by Occupancy in Chouteau County
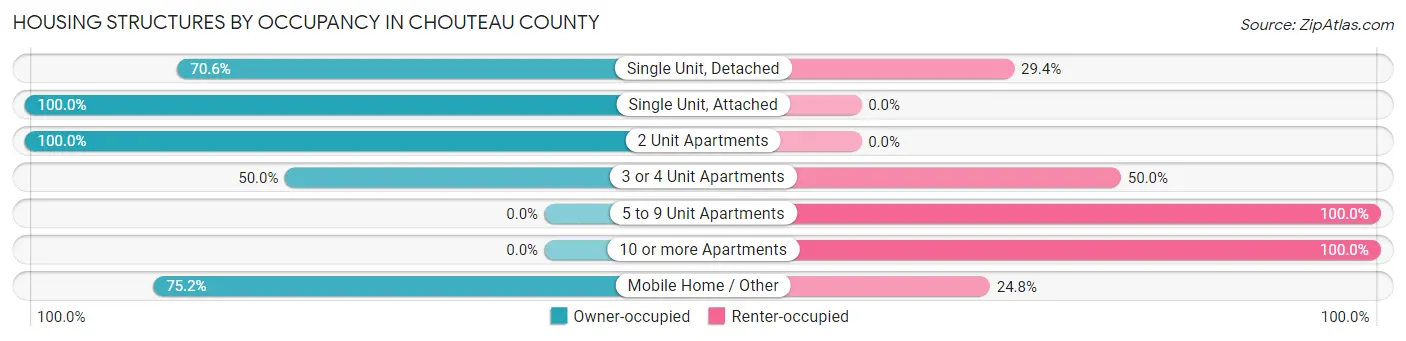
| Structure Type | Owner-occupied | Renter-occupied |
| Single Unit, Detached | 1,218 (70.6%) | 508 (29.4%) |
| Single Unit, Attached | 6 (100.0%) | 0 (0.0%) |
| 2 Unit Apartments | 15 (100.0%) | 0 (0.0%) |
| 3 or 4 Unit Apartments | 7 (50.0%) | 7 (50.0%) |
| 5 to 9 Unit Apartments | 0 (0.0%) | 30 (100.0%) |
| 10 or more Apartments | 0 (0.0%) | 62 (100.0%) |
| Mobile Home / Other | 249 (75.2%) | 82 (24.8%) |
| Total | 1,495 (68.4%) | 689 (31.6%) |
Housing Structures by Number of Rooms in Chouteau County
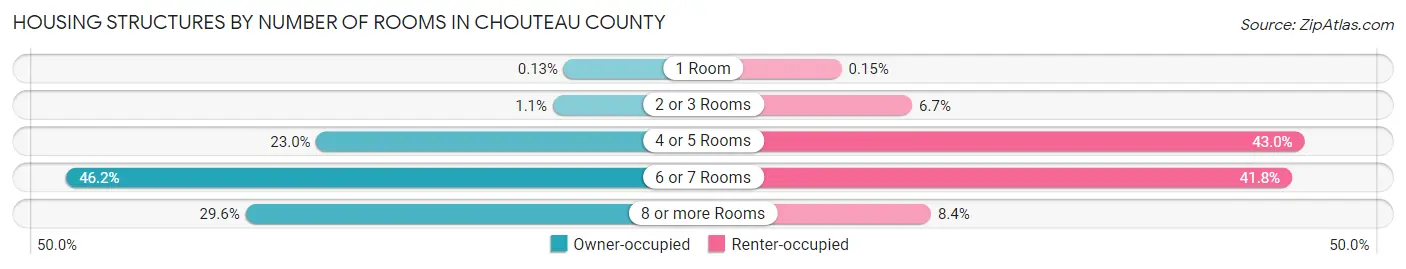
| Number of Rooms | Owner-occupied | Renter-occupied |
| 1 Room | 2 (0.1%) | 1 (0.2%) |
| 2 or 3 Rooms | 17 (1.1%) | 46 (6.7%) |
| 4 or 5 Rooms | 344 (23.0%) | 296 (43.0%) |
| 6 or 7 Rooms | 690 (46.2%) | 288 (41.8%) |
| 8 or more Rooms | 442 (29.6%) | 58 (8.4%) |
| Total | 1,495 (100.0%) | 689 (100.0%) |
Housing Structure by Heating Type in Chouteau County
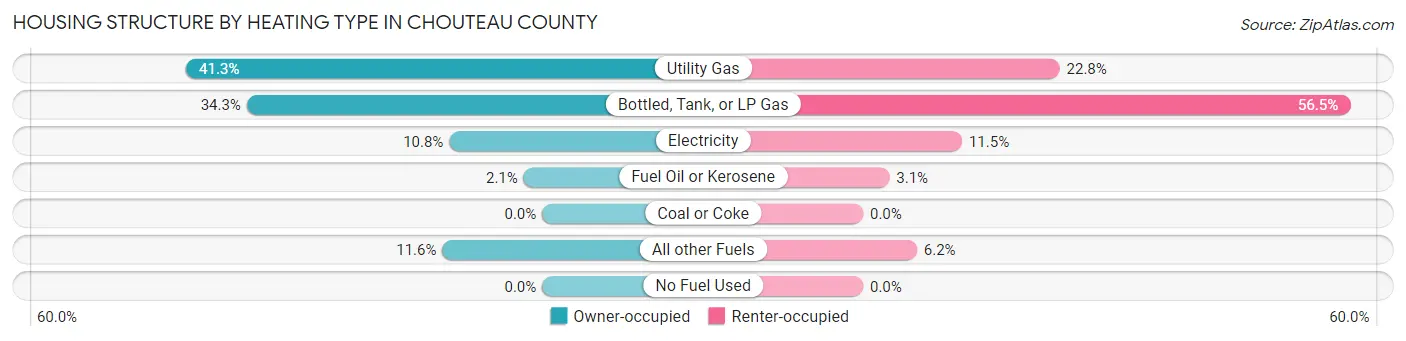
| Heating Type | Owner-occupied | Renter-occupied |
| Utility Gas | 617 (41.3%) | 157 (22.8%) |
| Bottled, Tank, or LP Gas | 512 (34.3%) | 389 (56.5%) |
| Electricity | 161 (10.8%) | 79 (11.5%) |
| Fuel Oil or Kerosene | 32 (2.1%) | 21 (3.0%) |
| Coal or Coke | 0 (0.0%) | 0 (0.0%) |
| All other Fuels | 173 (11.6%) | 43 (6.2%) |
| No Fuel Used | 0 (0.0%) | 0 (0.0%) |
| Total | 1,495 (100.0%) | 689 (100.0%) |
Household Vehicle Usage in Chouteau County
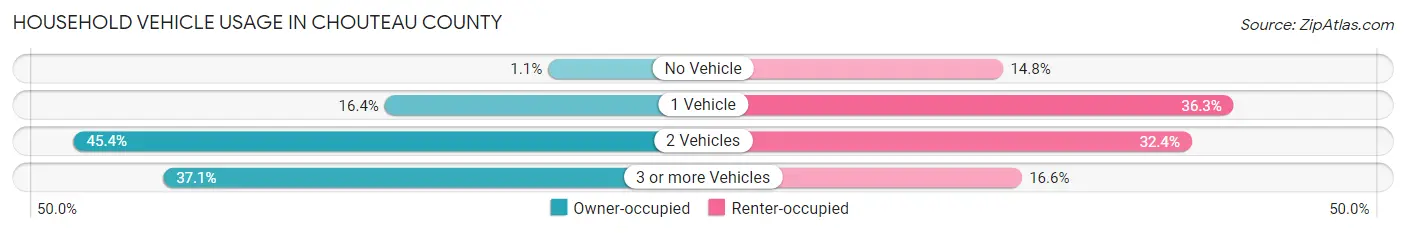
| Vehicles per Household | Owner-occupied | Renter-occupied |
| No Vehicle | 17 (1.1%) | 102 (14.8%) |
| 1 Vehicle | 245 (16.4%) | 250 (36.3%) |
| 2 Vehicles | 679 (45.4%) | 223 (32.4%) |
| 3 or more Vehicles | 554 (37.1%) | 114 (16.6%) |
| Total | 1,495 (100.0%) | 689 (100.0%) |
Real Estate & Mortgages in Chouteau County
Real Estate and Mortgage Overview in Chouteau County
| Characteristic | Without Mortgage | With Mortgage |
| Housing Units | 999 | 496 |
| Median Property Value | $155,000 | $191,700 |
| Median Household Income | $52,396 | $33 |
| Monthly Housing Costs | $424 | $10 |
| Real Estate Taxes | $1,303 | $1 |
Property Value by Mortgage Status in Chouteau County
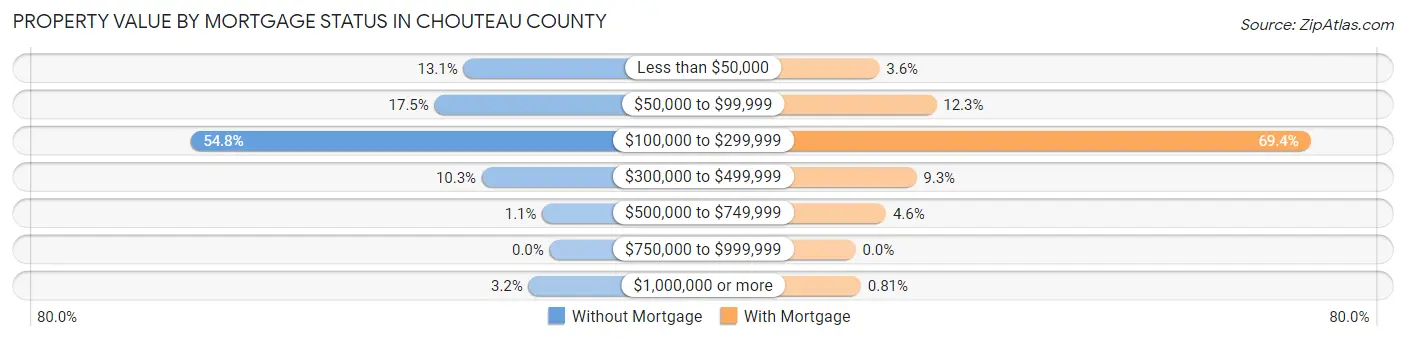
| Property Value | Without Mortgage | With Mortgage |
| Less than $50,000 | 131 (13.1%) | 18 (3.6%) |
| $50,000 to $99,999 | 175 (17.5%) | 61 (12.3%) |
| $100,000 to $299,999 | 547 (54.7%) | 344 (69.4%) |
| $300,000 to $499,999 | 103 (10.3%) | 46 (9.3%) |
| $500,000 to $749,999 | 11 (1.1%) | 23 (4.6%) |
| $750,000 to $999,999 | 0 (0.0%) | 0 (0.0%) |
| $1,000,000 or more | 32 (3.2%) | 4 (0.8%) |
| Total | 999 (100.0%) | 496 (100.0%) |
Household Income by Mortgage Status in Chouteau County
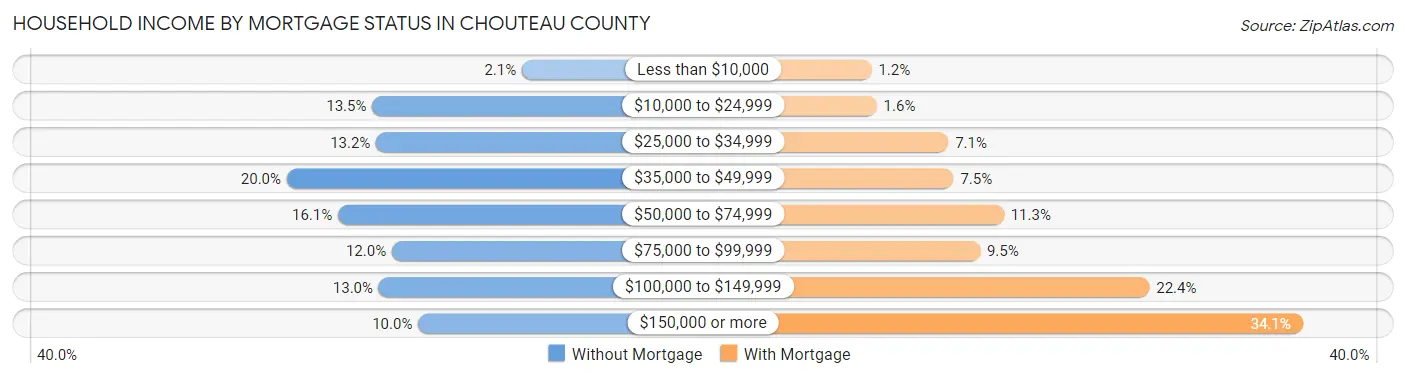
| Household Income | Without Mortgage | With Mortgage |
| Less than $10,000 | 21 (2.1%) | 6 (1.2%) |
| $10,000 to $24,999 | 135 (13.5%) | 8 (1.6%) |
| $25,000 to $34,999 | 132 (13.2%) | 35 (7.1%) |
| $35,000 to $49,999 | 200 (20.0%) | 37 (7.5%) |
| $50,000 to $74,999 | 161 (16.1%) | 56 (11.3%) |
| $75,000 to $99,999 | 120 (12.0%) | 47 (9.5%) |
| $100,000 to $149,999 | 130 (13.0%) | 111 (22.4%) |
| $150,000 or more | 100 (10.0%) | 169 (34.1%) |
| Total | 999 (100.0%) | 496 (100.0%) |
Property Value to Household Income Ratio in Chouteau County
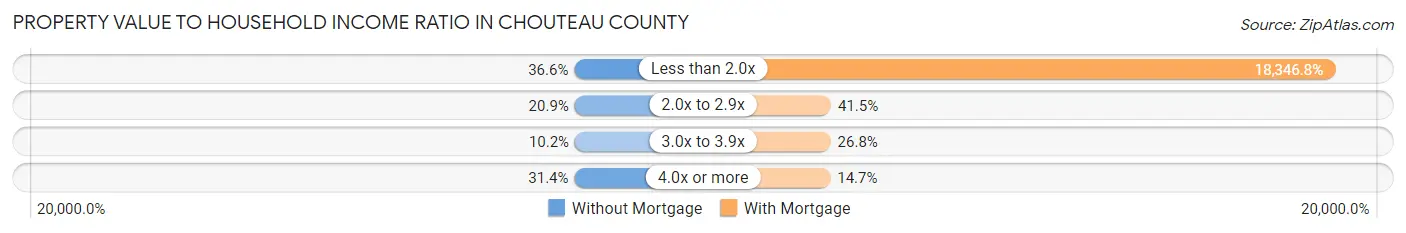
| Value-to-Income Ratio | Without Mortgage | With Mortgage |
| Less than 2.0x | 366 (36.6%) | 91,000 (18,346.8%) |
| 2.0x to 2.9x | 209 (20.9%) | 206 (41.5%) |
| 3.0x to 3.9x | 102 (10.2%) | 133 (26.8%) |
| 4.0x or more | 314 (31.4%) | 73 (14.7%) |
| Total | 999 (100.0%) | 496 (100.0%) |
Real Estate Taxes by Mortgage Status in Chouteau County
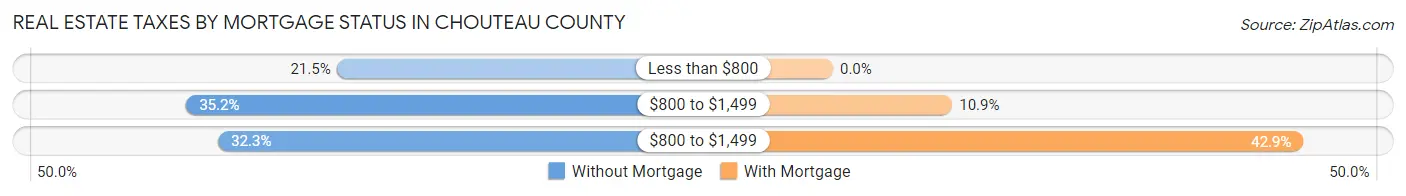
| Property Taxes | Without Mortgage | With Mortgage |
| Less than $800 | 215 (21.5%) | 0 (0.0%) |
| $800 to $1,499 | 352 (35.2%) | 54 (10.9%) |
| $800 to $1,499 | 323 (32.3%) | 213 (42.9%) |
| Total | 999 (100.0%) | 496 (100.0%) |
Health & Disability in Chouteau County
Health Insurance Coverage by Age in Chouteau County
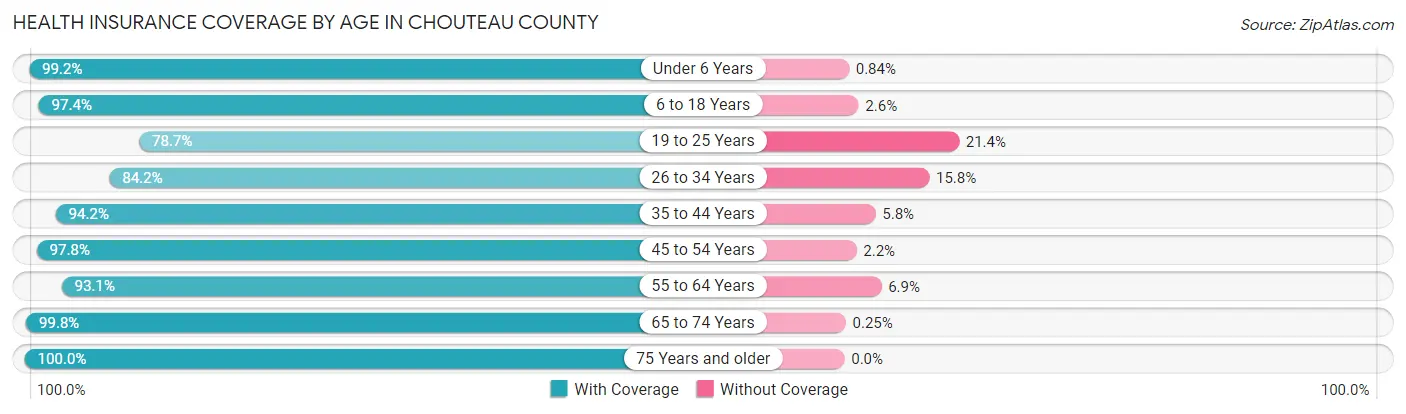
| Age Bracket | With Coverage | Without Coverage |
| Under 6 Years | 471 (99.2%) | 4 (0.8%) |
| 6 to 18 Years | 888 (97.4%) | 24 (2.6%) |
| 19 to 25 Years | 409 (78.6%) | 111 (21.3%) |
| 26 to 34 Years | 453 (84.2%) | 85 (15.8%) |
| 35 to 44 Years | 602 (94.2%) | 37 (5.8%) |
| 45 to 54 Years | 612 (97.8%) | 14 (2.2%) |
| 55 to 64 Years | 797 (93.1%) | 59 (6.9%) |
| 65 to 74 Years | 797 (99.8%) | 2 (0.3%) |
| 75 Years and older | 457 (100.0%) | 0 (0.0%) |
| Total | 5,486 (94.2%) | 336 (5.8%) |
Health Insurance Coverage by Citizenship Status in Chouteau County
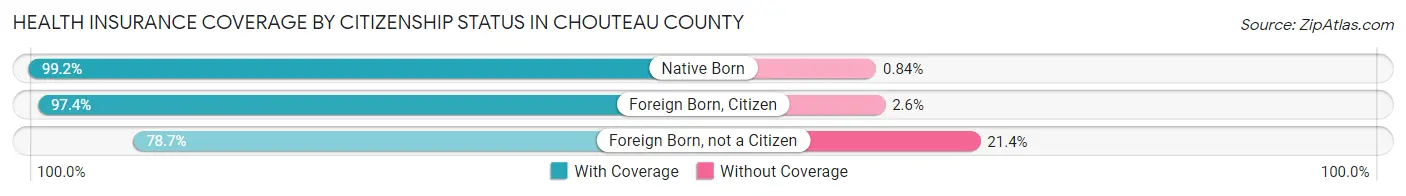
| Citizenship Status | With Coverage | Without Coverage |
| Native Born | 471 (99.2%) | 4 (0.8%) |
| Foreign Born, Citizen | 888 (97.4%) | 24 (2.6%) |
| Foreign Born, not a Citizen | 409 (78.6%) | 111 (21.3%) |
Health Insurance Coverage by Household Income in Chouteau County
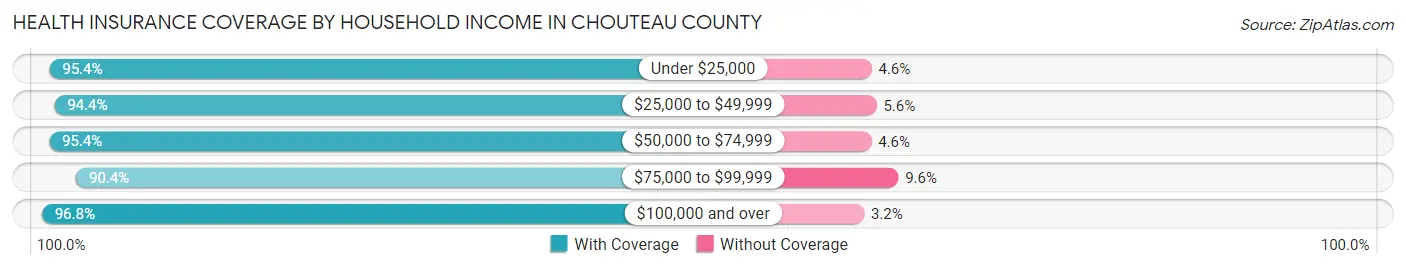
| Household Income | With Coverage | Without Coverage |
| Under $25,000 | 701 (95.4%) | 34 (4.6%) |
| $25,000 to $49,999 | 1,360 (94.4%) | 80 (5.6%) |
| $50,000 to $74,999 | 940 (95.4%) | 45 (4.6%) |
| $75,000 to $99,999 | 957 (90.4%) | 102 (9.6%) |
| $100,000 and over | 1,502 (96.8%) | 50 (3.2%) |
Public vs Private Health Insurance Coverage by Age in Chouteau County
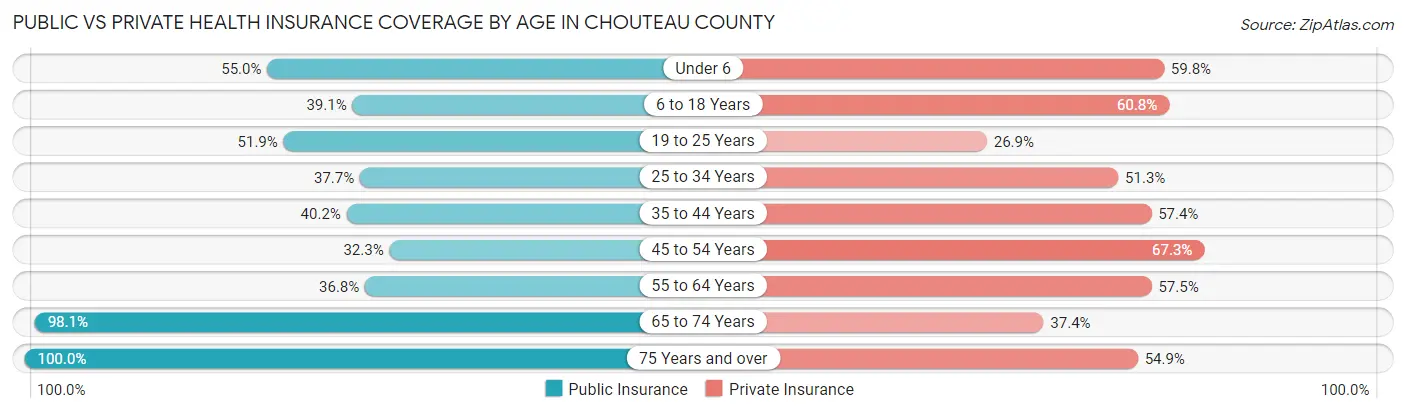
| Age Bracket | Public Insurance | Private Insurance |
| Under 6 | 261 (54.9%) | 284 (59.8%) |
| 6 to 18 Years | 357 (39.1%) | 554 (60.8%) |
| 19 to 25 Years | 270 (51.9%) | 140 (26.9%) |
| 25 to 34 Years | 203 (37.7%) | 276 (51.3%) |
| 35 to 44 Years | 257 (40.2%) | 367 (57.4%) |
| 45 to 54 Years | 202 (32.3%) | 421 (67.2%) |
| 55 to 64 Years | 315 (36.8%) | 492 (57.5%) |
| 65 to 74 Years | 784 (98.1%) | 299 (37.4%) |
| 75 Years and over | 457 (100.0%) | 251 (54.9%) |
| Total | 3,106 (53.3%) | 3,084 (53.0%) |
Disability Status by Sex by Age in Chouteau County
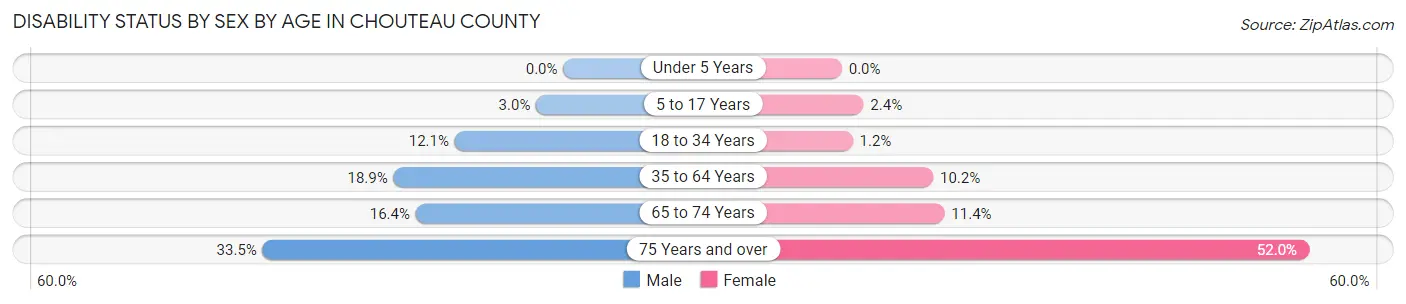
| Age Bracket | Male | Female |
| Under 5 Years | 0 (0.0%) | 0 (0.0%) |
| 5 to 17 Years | 14 (3.0%) | 13 (2.4%) |
| 18 to 34 Years | 70 (12.1%) | 6 (1.2%) |
| 35 to 64 Years | 202 (18.9%) | 107 (10.2%) |
| 65 to 74 Years | 68 (16.4%) | 44 (11.4%) |
| 75 Years and over | 70 (33.5%) | 129 (52.0%) |
Disability Class by Sex by Age in Chouteau County
Disability Class: Hearing Difficulty
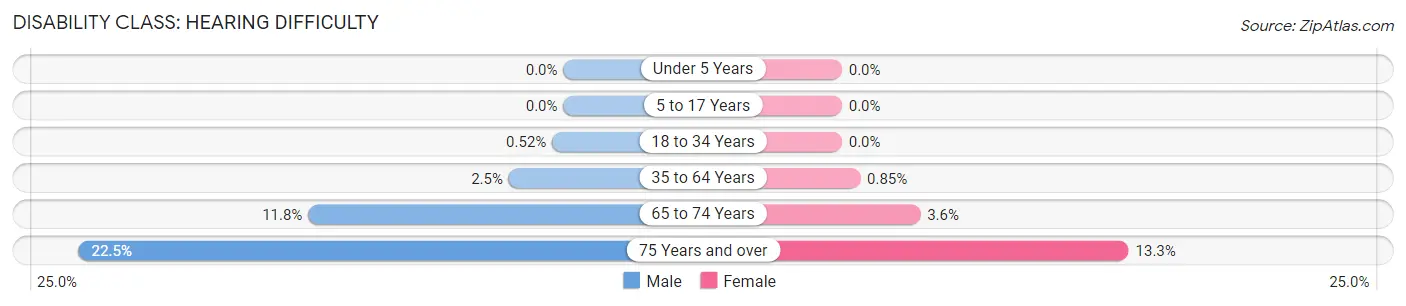
| Age Bracket | Male | Female |
| Under 5 Years | 0 (0.0%) | 0 (0.0%) |
| 5 to 17 Years | 0 (0.0%) | 0 (0.0%) |
| 18 to 34 Years | 3 (0.5%) | 0 (0.0%) |
| 35 to 64 Years | 27 (2.5%) | 9 (0.9%) |
| 65 to 74 Years | 49 (11.8%) | 14 (3.6%) |
| 75 Years and over | 47 (22.5%) | 33 (13.3%) |
Disability Class: Vision Difficulty
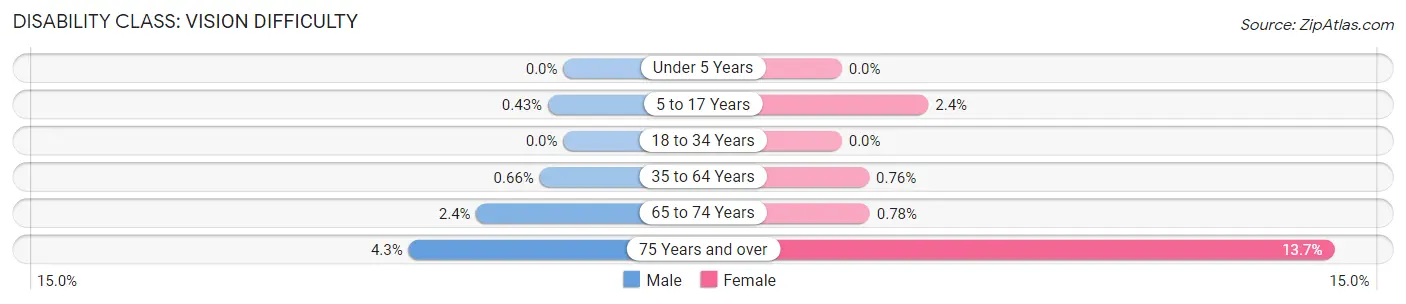
| Age Bracket | Male | Female |
| Under 5 Years | 0 (0.0%) | 0 (0.0%) |
| 5 to 17 Years | 2 (0.4%) | 13 (2.4%) |
| 18 to 34 Years | 0 (0.0%) | 0 (0.0%) |
| 35 to 64 Years | 7 (0.7%) | 8 (0.8%) |
| 65 to 74 Years | 10 (2.4%) | 3 (0.8%) |
| 75 Years and over | 9 (4.3%) | 34 (13.7%) |
Disability Class: Cognitive Difficulty
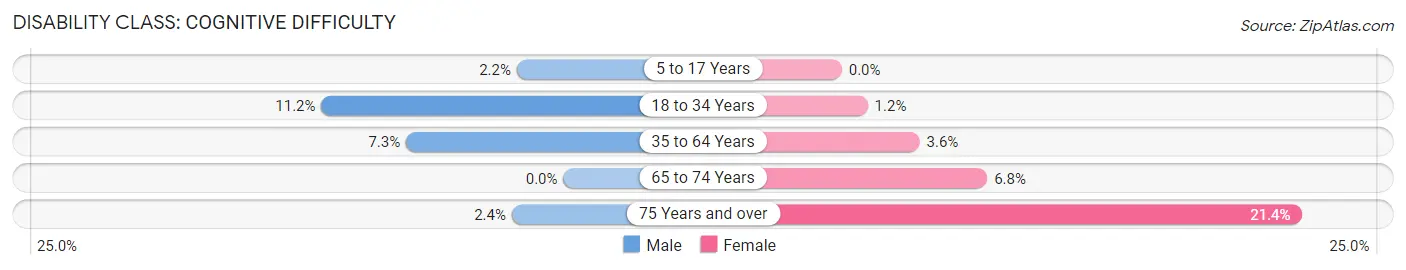
| Age Bracket | Male | Female |
| 5 to 17 Years | 10 (2.2%) | 0 (0.0%) |
| 18 to 34 Years | 65 (11.2%) | 6 (1.2%) |
| 35 to 64 Years | 78 (7.3%) | 38 (3.6%) |
| 65 to 74 Years | 0 (0.0%) | 26 (6.8%) |
| 75 Years and over | 5 (2.4%) | 53 (21.4%) |
Disability Class: Ambulatory Difficulty
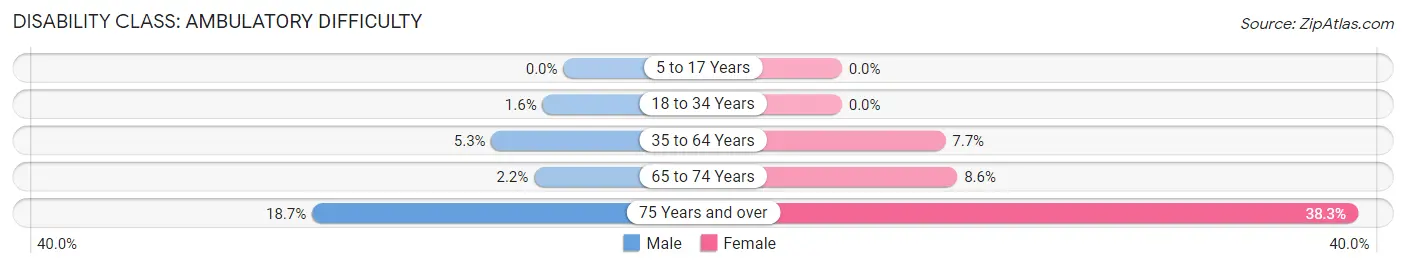
| Age Bracket | Male | Female |
| 5 to 17 Years | 0 (0.0%) | 0 (0.0%) |
| 18 to 34 Years | 9 (1.5%) | 0 (0.0%) |
| 35 to 64 Years | 57 (5.3%) | 81 (7.7%) |
| 65 to 74 Years | 9 (2.2%) | 33 (8.6%) |
| 75 Years and over | 39 (18.7%) | 95 (38.3%) |
Disability Class: Self-Care Difficulty
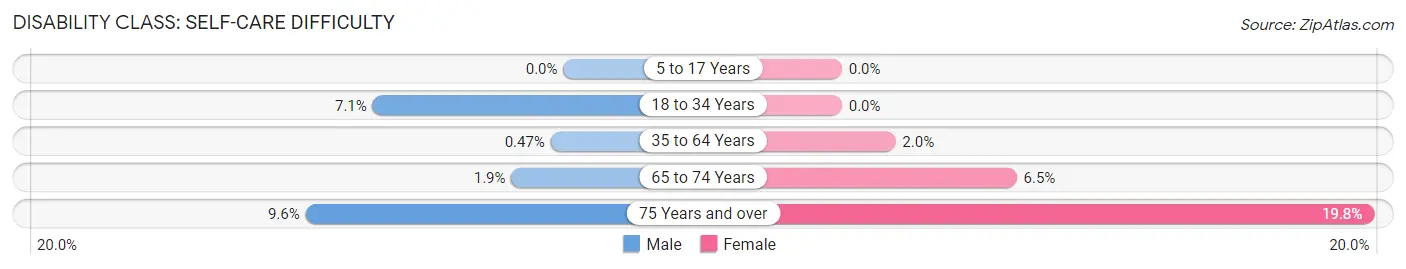
| Age Bracket | Male | Female |
| 5 to 17 Years | 0 (0.0%) | 0 (0.0%) |
| 18 to 34 Years | 41 (7.1%) | 0 (0.0%) |
| 35 to 64 Years | 5 (0.5%) | 21 (2.0%) |
| 65 to 74 Years | 8 (1.9%) | 25 (6.5%) |
| 75 Years and over | 20 (9.6%) | 49 (19.8%) |
Technology Access in Chouteau County
Computing Device Access in Chouteau County
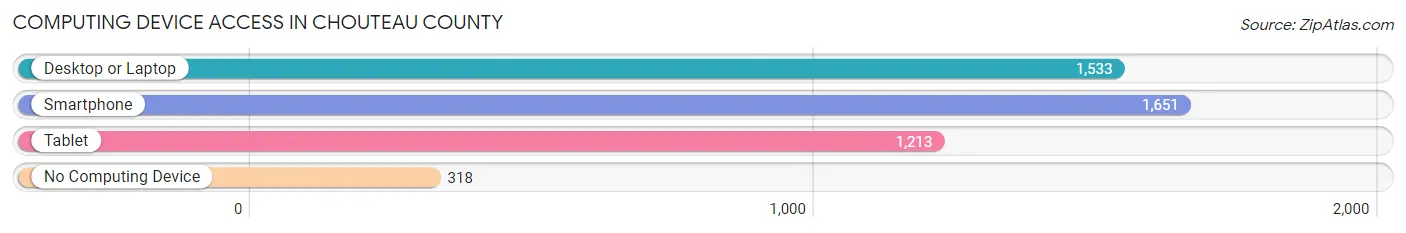
| Device Type | # Households | % Households |
| Desktop or Laptop | 1,533 | 70.2% |
| Smartphone | 1,651 | 75.6% |
| Tablet | 1,213 | 55.5% |
| No Computing Device | 318 | 14.6% |
| Total | 2,184 | 100.0% |
Internet Access in Chouteau County
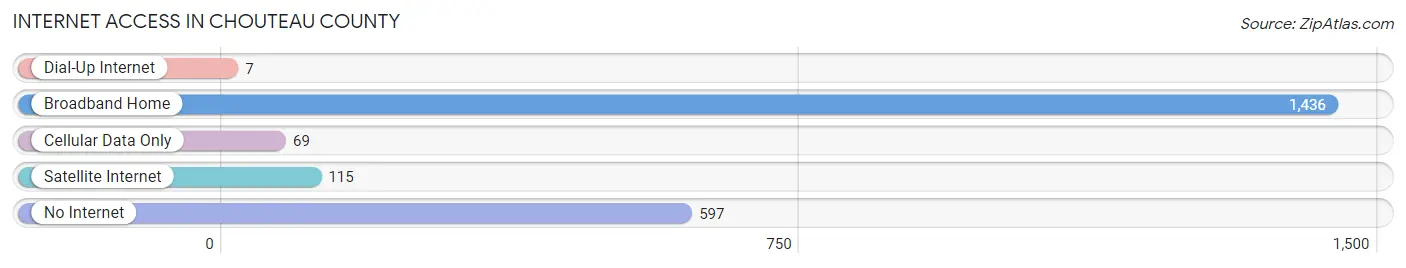
| Internet Type | # Households | % Households |
| Dial-Up Internet | 7 | 0.3% |
| Broadband Home | 1,436 | 65.7% |
| Cellular Data Only | 69 | 3.2% |
| Satellite Internet | 115 | 5.3% |
| No Internet | 597 | 27.3% |
| Total | 2,184 | 100.0% |
Chouteau County Summary
Chouteau County is located in the north-central region of Montana, and is bordered by Hill County to the east, Cascade County to the south, Teton County to the west, and Canada to the north. The county seat is Fort Benton, and the county has a total area of 1,845 square miles. As of the 2010 census, the population was 5,813.
History
Chouteau County was established in 1865, and was named after Pierre Chouteau, Jr., a prominent fur trader and founder of St. Louis. The county was originally part of the vast area of land known as the Louisiana Purchase, and was part of the original Montana Territory. The county was originally inhabited by the Blackfeet and Gros Ventre tribes, and was later settled by European-American settlers in the late 19th century.
Geography
Chouteau County is located in the north-central region of Montana, and is bordered by Hill County to the east, Cascade County to the south, Teton County to the west, and Canada to the north. The county has a total area of 1,845 square miles, and is mostly rural and agricultural. The terrain is mostly rolling hills and plains, with the Rocky Mountains to the west. The Missouri River runs through the county, and is a major source of recreation and economic activity.
Economy
The economy of Chouteau County is largely based on agriculture and ranching. The county is home to a number of large cattle ranches, and is also a major producer of wheat, barley, and hay. The county is also home to a number of small businesses, including retail stores, restaurants, and other services. The county is also home to a number of oil and gas wells, and is a major producer of oil and natural gas.
Demographics
As of the 2010 census, the population of Chouteau County was 5,813. The population is mostly white (94.3%), with small percentages of Native American (2.2%), Hispanic (1.3%), and African American (0.4%) populations. The median household income is $41,945, and the median age is 44.7 years. The county is home to a number of small towns and communities, including Fort Benton, Big Sandy, Highwood, and Loma.
Conclusion
Chouteau County is a rural county located in the north-central region of Montana. The county is home to a number of small towns and communities, and is largely based on agriculture and ranching. The county is also home to a number of oil and gas wells, and is a major producer of oil and natural gas. The population of Chouteau County is mostly white, with small percentages of Native American, Hispanic, and African American populations. The median household income is $41,945, and the median age is 44.7 years.
Common Questions
What is Per Capita Income in Chouteau County?
Per Capita income in Chouteau County is $28,980.
What is the Median Family Income in Chouteau County?
Median Family Income in Chouteau County is $76,058.
What is the Median Household income in Chouteau County?
Median Household Income in Chouteau County is $51,791.
What is Income or Wage Gap in Chouteau County?
Income or Wage Gap in Chouteau County is 39.1%.
Women in Chouteau County earn 60.9 cents for every dollar earned by a man.
What is Family Income Deficit in Chouteau County?
Family Income Deficit in Chouteau County is $12,006.
Families that are below poverty line in Chouteau County earn $12,006 less on average than the poverty threshold level.
What is Inequality or Gini Index in Chouteau County?
Inequality or Gini Index in Chouteau County is 0.44.
What is the Total Population of Chouteau County?
Total Population of Chouteau County is 5,897.
What is the Total Male Population of Chouteau County?
Total Male Population of Chouteau County is 2,956.
What is the Total Female Population of Chouteau County?
Total Female Population of Chouteau County is 2,941.
What is the Ratio of Males per 100 Females in Chouteau County?
There are 100.51 Males per 100 Females in Chouteau County.
What is the Ratio of Females per 100 Males in Chouteau County?
There are 99.49 Females per 100 Males in Chouteau County.
What is the Median Population Age in Chouteau County?
Median Population Age in Chouteau County is 42.4 Years.
What is the Average Family Size in Chouteau County
Average Family Size in Chouteau County is 3.5 People.
What is the Average Household Size in Chouteau County
Average Household Size in Chouteau County is 2.6 People.
How Large is the Labor Force in Chouteau County?
There are 2,641 People in the Labor Forcein in Chouteau County.
What is the Percentage of People in the Labor Force in Chouteau County?
55.7% of People are in the Labor Force in Chouteau County.
What is the Unemployment Rate in Chouteau County?
Unemployment Rate in Chouteau County is 5.2%.