Zip Codes with the Highest Percentage of Population with a Degree in Liberal Arts and History in Lees Summit, MO
RELATED REPORTS & OPTIONS
Liberal Arts and History
Lees Summit
Compare Zip Codes
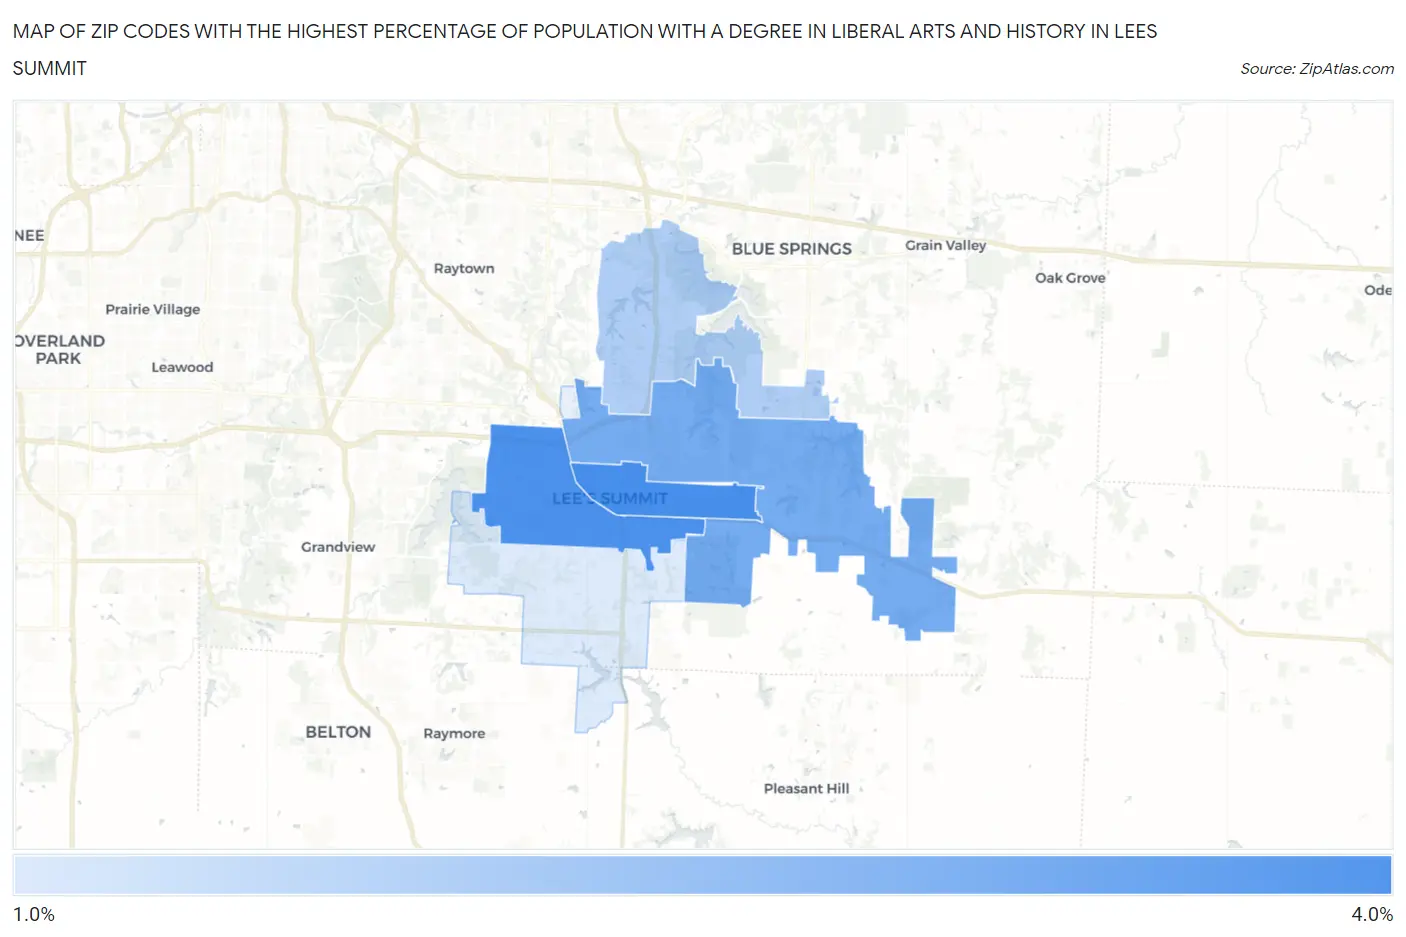
Map of Zip Codes with the Highest Percentage of Population with a Degree in Liberal Arts and History in Lees Summit
1.3%
3.3%
Zip Codes with the Highest Percentage of Population with a Degree in Liberal Arts and History in Lees Summit, MO
| Zip Code | % Graduates | vs State | vs National | |
| 1. | 64063 | 3.3% | 4.6%(-1.23)#443 | 4.9%(-1.53)#17,172 |
| 2. | 64081 | 3.3% | 4.6%(-1.28)#446 | 4.9%(-1.58)#17,348 |
| 3. | 64086 | 2.7% | 4.6%(-1.86)#498 | 4.9%(-2.16)#19,268 |
| 4. | 64064 | 2.0% | 4.6%(-2.62)#554 | 4.9%(-2.92)#21,493 |
| 5. | 64082 | 1.3% | 4.6%(-3.23)#591 | 4.9%(-3.53)#22,792 |
1
Common Questions
What are the Top 5 Zip Codes with the Highest Percentage of Population with a Degree in Liberal Arts and History in Lees Summit, MO?
Top 5 Zip Codes with the Highest Percentage of Population with a Degree in Liberal Arts and History in Lees Summit, MO are:
What zip code has the Highest Percentage of Population with a Degree in Liberal Arts and History in Lees Summit, MO?
64063 has the Highest Percentage of Population with a Degree in Liberal Arts and History in Lees Summit, MO with 3.3%.
What is the Percentage of Population with a Degree in Liberal Arts and History in Missouri?
Percentage of Population with a Degree in Liberal Arts and History in Missouri is 4.6%.
What is the Percentage of Population with a Degree in Liberal Arts and History in the United States?
Percentage of Population with a Degree in Liberal Arts and History in the United States is 4.9%.