Zip Codes with the Highest Percentage of Population Employed in Administrative & Support Services in Utica, MI
RELATED REPORTS & OPTIONS
Administrative & Support Services
Utica
Compare Zip Codes
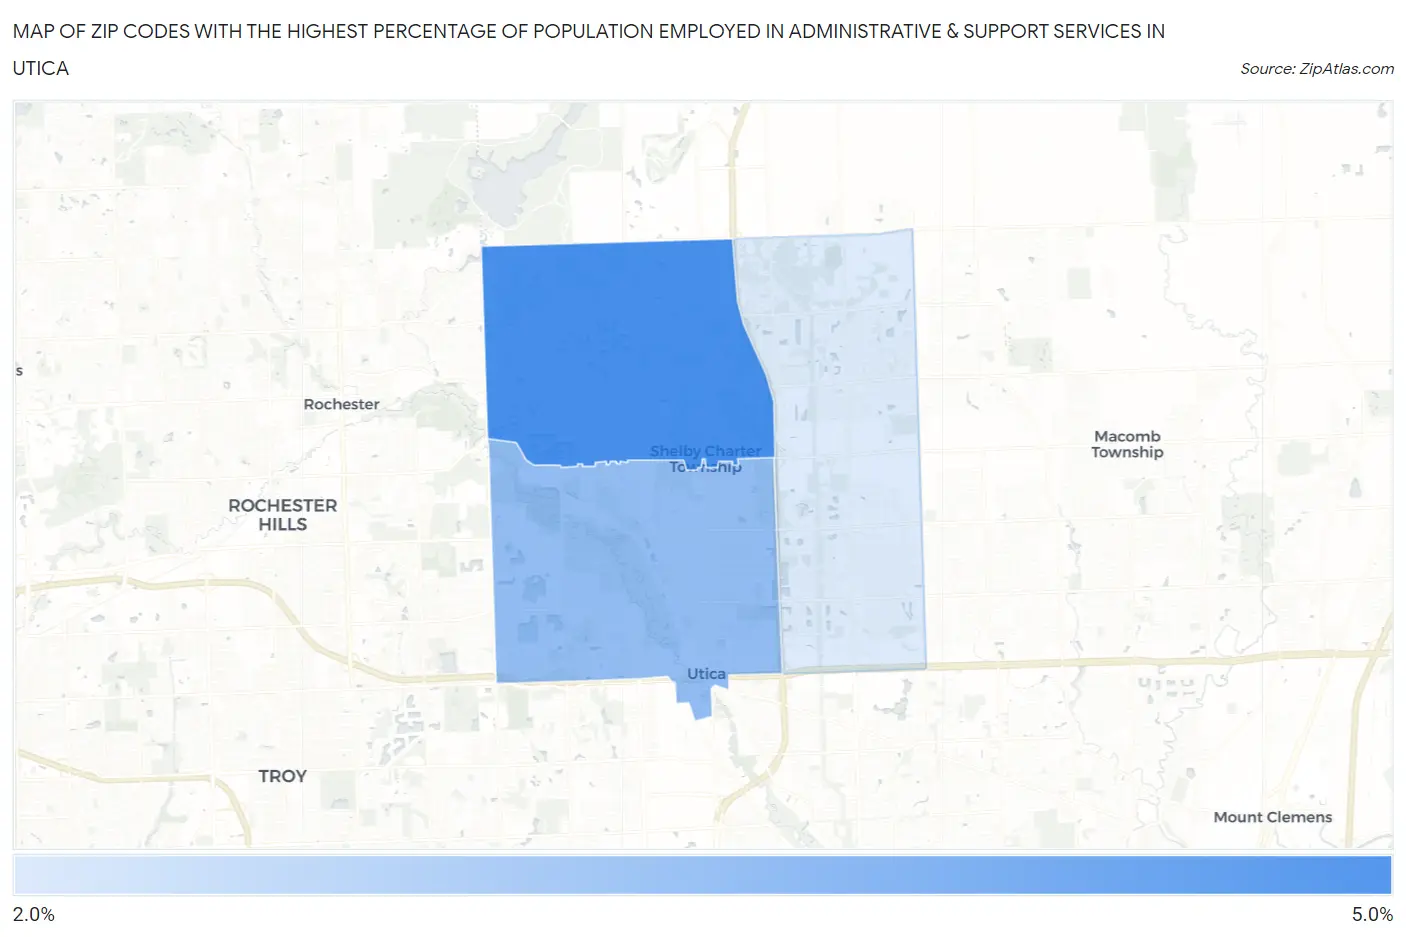
Map of Zip Codes with the Highest Percentage of Population Employed in Administrative & Support Services in Utica
2.9%
4.0%
Zip Codes with the Highest Percentage of Population Employed in Administrative & Support Services in Utica, MI
| Zip Code | % Employed | vs State | vs National | |
| 1. | 48316 | 4.0% | 3.7%(+0.304)#310 | 4.1%(-0.119)#10,552 |
| 2. | 48317 | 3.4% | 3.7%(-0.279)#412 | 4.1%(-0.701)#13,216 |
| 3. | 48315 | 2.9% | 3.7%(-0.843)#543 | 4.1%(-1.27)#16,075 |
1
Common Questions
What are the Top Zip Codes with the Highest Percentage of Population Employed in Administrative & Support Services in Utica, MI?
Top Zip Codes with the Highest Percentage of Population Employed in Administrative & Support Services in Utica, MI are:
What zip code has the Highest Percentage of Population Employed in Administrative & Support Services in Utica, MI?
48316 has the Highest Percentage of Population Employed in Administrative & Support Services in Utica, MI with 4.0%.
What is the Percentage of Population Employed in Administrative & Support Services in Utica, MI?
Percentage of Population Employed in Administrative & Support Services in Utica is 4.5%.
What is the Percentage of Population Employed in Administrative & Support Services in Michigan?
Percentage of Population Employed in Administrative & Support Services in Michigan is 3.7%.
What is the Percentage of Population Employed in Administrative & Support Services in the United States?
Percentage of Population Employed in Administrative & Support Services in the United States is 4.1%.