Zip Codes with the Highest Percentage of Population with a Degree in Computers and Mathematics in Clearwater, FL

RELATED REPORTS & OPTIONS

Computers and Mathematics
Population
Families and Households
Female Fertility
Female Fertility (Unmarried)
Race (Community Size)
Race (Percentage)
Ancestry (Community Size)
AfricanAlbanianAmericanApacheArabArgentineanArmenianAustralianAustrianBangladeshiBelgianBhutaneseBolivianBrazilianBritishBulgarianBurmeseCanadianCape VerdeanCarpatho RusynCentral AmericanCentral American IndianCherokeeChileanChippewaColombianCosta RicanCroatianCubanCzechCzechoslovakianDanishDominicanDutchEastern EuropeanEcuadorianEgyptianEnglishEuropeanFinnishFrenchFrench CanadianGermanGhanaianGreekGuamanian / ChamorroGuatemalanGuyaneseHaitianHonduranHungarianIndian (Asian)IranianIrishIsraeliItalianJamaicanJapaneseJordanianKoreanLebaneseLithuanianMacedonianMalaysianMexicanMexican American IndianMongolianMoroccanNative HawaiianNew ZealanderNicaraguanNigerianNorthern EuropeanNorwegianPakistaniPanamanianPennsylvania GermanPeruvianPolishPortuguesePuerto RicanRomanianRussianSalvadoranScandinavianScotch-IrishScottishSeminoleSerbianSlavicSlovakSloveneSouth AfricanSouth AmericanSpaniardSpanishSri LankanSubsaharan AfricanSwedishSwissSyrianThaiTrinidadian and TobagonianTurkishUkrainianUruguayanVenezuelanWelshWest IndianYugoslavian
Ancestry (Percentage)
AfricanAlbanianAmericanApacheArabArgentineanArmenianAustralianAustrianBangladeshiBelgianBhutaneseBolivianBrazilianBritishBulgarianBurmeseCanadianCape VerdeanCarpatho RusynCentral AmericanCentral American IndianCherokeeChileanChippewaColombianCosta RicanCroatianCubanCzechCzechoslovakianDanishDominicanDutchEastern EuropeanEcuadorianEgyptianEnglishEuropeanFinnishFrenchFrench CanadianGermanGhanaianGreekGuamanian / ChamorroGuatemalanGuyaneseHaitianHonduranHungarianIndian (Asian)IranianIrishIsraeliItalianJamaicanJapaneseJordanianKoreanLebaneseLithuanianMacedonianMalaysianMexicanMexican American IndianMongolianMoroccanNative HawaiianNew ZealanderNicaraguanNigerianNorthern EuropeanNorwegianPakistaniPanamanianPennsylvania GermanPeruvianPolishPortuguesePuerto RicanRomanianRussianSalvadoranScandinavianScotch-IrishScottishSeminoleSerbianSlavicSlovakSloveneSouth AfricanSouth AmericanSpaniardSpanishSri LankanSubsaharan AfricanSwedishSwissSyrianThaiTrinidadian and TobagonianTurkishUkrainianUruguayanVenezuelanWelshWest IndianYugoslavian
Immigrant Origin (Total)
Immigrant Origin (Percentage)
Income
Income (Families)
Income (Households)
Poverty
Poverty (Families)
Unemployment
Employment Occupations
Employment Industries
Employer Class
Commute Time
Commute Means
School Enrollment
Education by Degree Field
Occupancy
Finances
Physical Characteristics
Clearwater
States
Florida Cities
Altamonte SpringsApopkaArcadiaBoca RatonBonita SpringsBoynton BeachBradentonBrandonBrooksvilleCape CoralCasselberryClearwaterClermontCocoaCoral SpringsCrestviewCrystal RiverDade CityDavenportDaytona BeachDeerfield BeachDefuniak SpringsDelandDelray BeachDeltonaDunnellonEdgewaterEnglewoodEustisFort LauderdaleFort MyersFort PierceFort Walton BeachGainesvilleGulf BreezeHialeahHolidayHollywoodHomesteadHomosassaHudsonInvernessJacksonvilleJupiterKissimmeeLake CityLake WalesLake WorthLakelandLand O LakesLargoLeesburgLehigh AcresLive OakLongwoodLutzMelbourneMerritt IslandMiamiMiami BeachMiltonNaplesNew Port RicheyNew Smyrna BeachNorth Fort MyersNorth PortOcalaOkeechobeeOpa LockaOrange ParkOrlandoOrmond BeachOviedoPalm BayPalm Beach GardensPalm CoastPalm HarborPanama CityPanama City BeachPensacolaPinellas ParkPlant CityPompano BeachPort CharlottePort OrangePort Saint LuciePunta GordaQuincyRiverviewSaint AugustineSaint CloudSaint PetersburgSanfordSarasotaSebastianSebringSeminoleSpring HillStuartTallahasseeTampaTarpon SpringsThe VillagesTitusvilleValricoVeniceVero BeachWesley ChapelWest Palm BeachWinter HavenWinter ParkZephyrhills
Compare Zip Codes
Comparison Subject

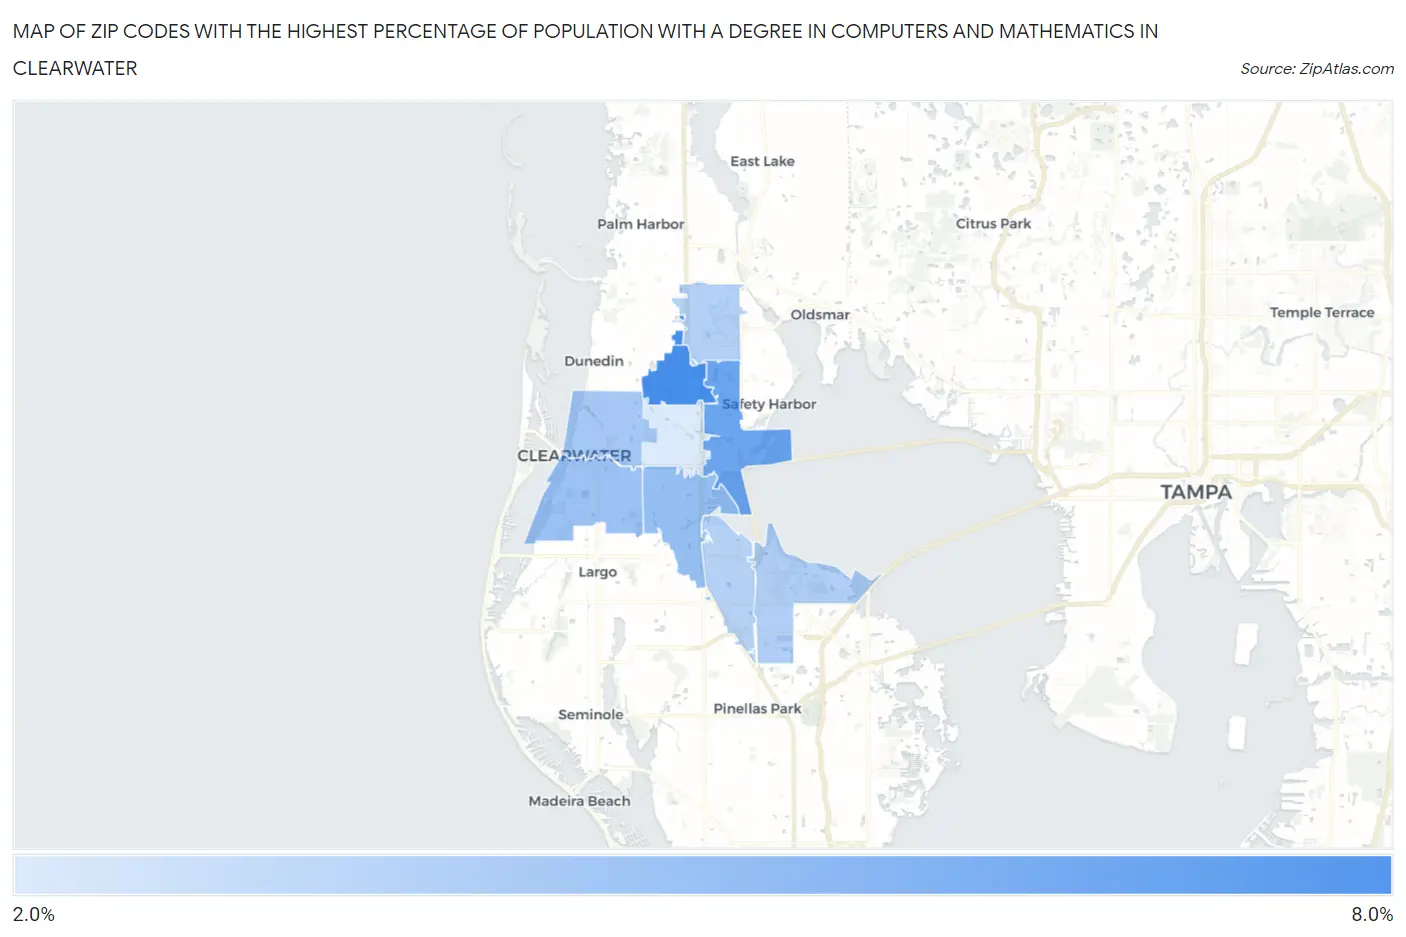
Map of Zip Codes with the Highest Percentage of Population with a Degree in Computers and Mathematics in Clearwater

0.0%
8.0%
Zip Codes with the Highest Percentage of Population with a Degree in Computers and Mathematics in Clearwater Map

Zip Codes with the Highest Percentage of Population with a Degree in Computers and Mathematics in Clearwater, FL

Zip Code % Graduates vs State vs National
1.337637.2%4.1%(+3.09)#784.9%(+2.33)#3,609
2.337596.0%4.1%(+1.84)#1344.9%(+1.08)#5,337
3.337644.5%4.1%(+0.416)#2914.9%(-0.348)#8,710
4.337564.3%4.1%(+0.219)#3264.9%(-0.544)#9,348
5.337554.0%4.1%(-0.108)#3684.9%(-0.872)#10,389
6.337623.6%4.1%(-0.523)#4724.9%(-1.29)#11,866
7.337613.5%4.1%(-0.606)#4824.9%(-1.37)#12,188
8.337603.5%4.1%(-0.652)#4964.9%(-1.42)#12,367
9.337652.2%4.1%(-1.98)#7244.9%(-2.74)#17,123

Common Questions

What are the Top 5 Zip Codes with the Highest Percentage of Population with a Degree in Computers and Mathematics in Clearwater, FL?
Top 5 Zip Codes with the Highest Percentage of Population with a Degree in Computers and Mathematics in Clearwater, FL are:
#1
7.2%
#2
6.0%
#3
4.5%
#4
4.3%
#5
4.0%
What zip code has the Highest Percentage of Population with a Degree in Computers and Mathematics in Clearwater, FL?
33763 has the Highest Percentage of Population with a Degree in Computers and Mathematics in Clearwater, FL with 7.2%.
What is the Percentage of Population with a Degree in Computers and Mathematics in Clearwater, FL?
Percentage of Population with a Degree in Computers and Mathematics in Clearwater is 4.3%.
What is the Percentage of Population with a Degree in Computers and Mathematics in Florida?
Percentage of Population with a Degree in Computers and Mathematics in Florida is 4.1%.
What is the Percentage of Population with a Degree in Computers and Mathematics in the United States?
Percentage of Population with a Degree in Computers and Mathematics in the United States is 4.9%.