West Indian vs Finnish College, Under 1 year
COMPARE
West Indian
Finnish
College, Under 1 year
College, Under 1 year Comparison
West Indians
Finns
61.5%
COLLEGE, UNDER 1 YEAR
0.4/ 100
METRIC RATING
252nd/ 347
METRIC RANK
66.9%
COLLEGE, UNDER 1 YEAR
88.6/ 100
METRIC RATING
131st/ 347
METRIC RANK
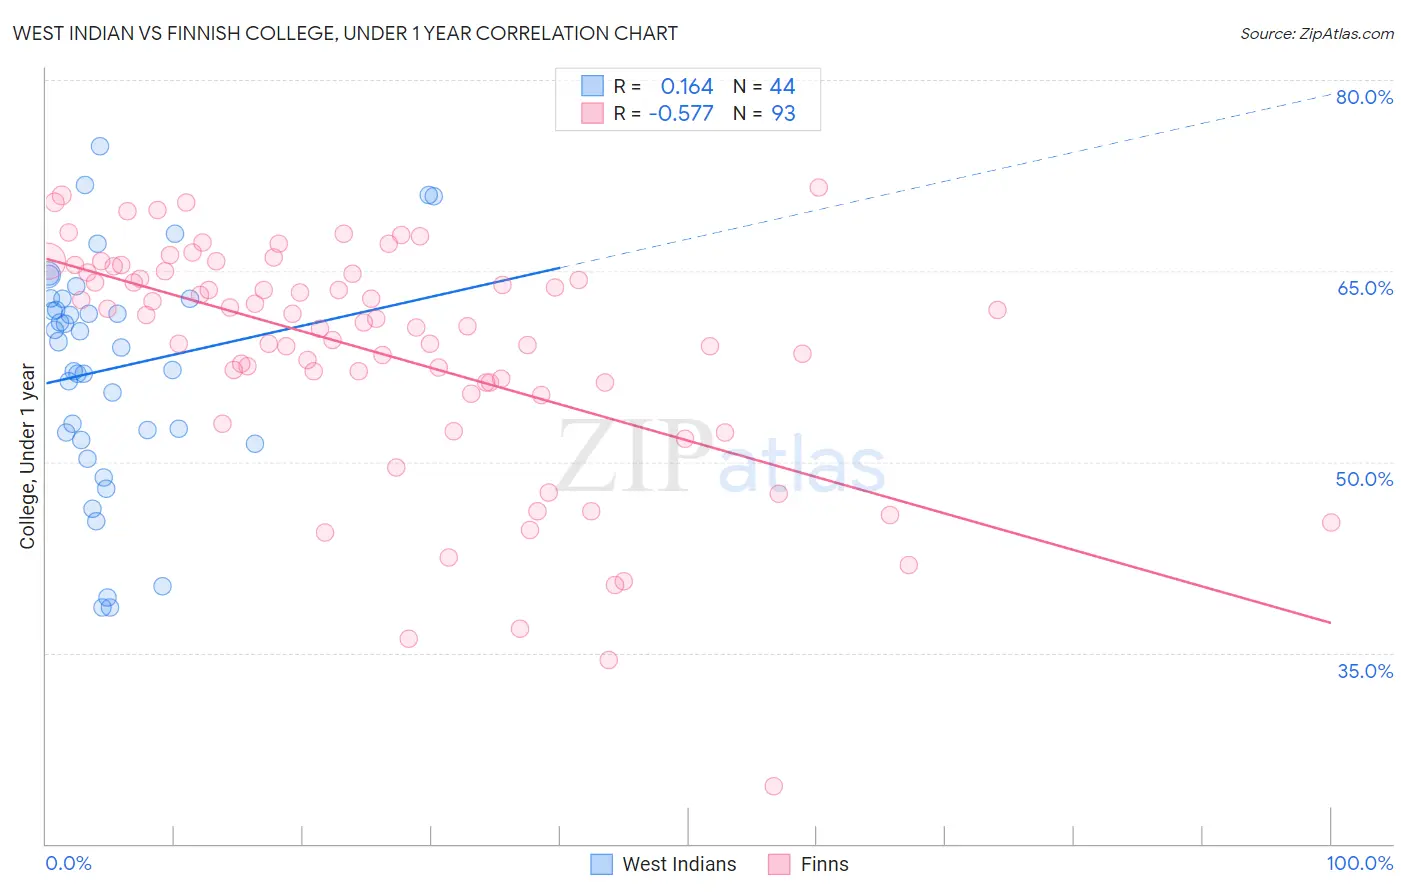
West Indian vs Finnish College, Under 1 year Correlation Chart
The statistical analysis conducted on geographies consisting of 254,063,654 people shows a poor positive correlation between the proportion of West Indians and percentage of population with at least college, under 1 year education in the United States with a correlation coefficient (R) of 0.164 and weighted average of 61.5%. Similarly, the statistical analysis conducted on geographies consisting of 404,673,530 people shows a substantial negative correlation between the proportion of Finns and percentage of population with at least college, under 1 year education in the United States with a correlation coefficient (R) of -0.577 and weighted average of 66.9%, a difference of 8.8%.
College, Under 1 year Correlation Summary
| Measurement | West Indian | Finnish |
| Minimum | 38.5% | 24.5% |
| Maximum | 74.8% | 71.6% |
| Range | 36.3% | 47.0% |
| Mean | 57.4% | 58.5% |
| Median | 59.2% | 60.9% |
| Interquartile 25% (IQ1) | 52.0% | 55.8% |
| Interquartile 75% (IQ3) | 62.9% | 64.9% |
| Interquartile Range (IQR) | 10.8% | 9.1% |
| Standard Deviation (Sample) | 8.9% | 9.3% |
| Standard Deviation (Population) | 8.8% | 9.2% |
Similar Demographics by College, Under 1 year
Demographics Similar to West Indians by College, Under 1 year
In terms of college, under 1 year, the demographic groups most similar to West Indians are Japanese (61.5%, a difference of 0.0%), Immigrants from Cambodia (61.5%, a difference of 0.0%), Immigrants from Micronesia (61.5%, a difference of 0.11%), Comanche (61.4%, a difference of 0.13%), and Bangladeshi (61.4%, a difference of 0.17%).
| Demographics | Rating | Rank | College, Under 1 year |
| Delaware | 0.9 /100 | #245 | Tragic 62.1% |
| Marshallese | 0.8 /100 | #246 | Tragic 61.9% |
| Immigrants | Liberia | 0.8 /100 | #247 | Tragic 61.9% |
| Potawatomi | 0.6 /100 | #248 | Tragic 61.8% |
| Vietnamese | 0.5 /100 | #249 | Tragic 61.7% |
| Immigrants | Congo | 0.5 /100 | #250 | Tragic 61.7% |
| Immigrants | Micronesia | 0.5 /100 | #251 | Tragic 61.5% |
| West Indians | 0.4 /100 | #252 | Tragic 61.5% |
| Japanese | 0.4 /100 | #253 | Tragic 61.5% |
| Immigrants | Cambodia | 0.4 /100 | #254 | Tragic 61.5% |
| Comanche | 0.4 /100 | #255 | Tragic 61.4% |
| Bangladeshis | 0.4 /100 | #256 | Tragic 61.4% |
| Immigrants | Laos | 0.3 /100 | #257 | Tragic 61.3% |
| Immigrants | Bangladesh | 0.3 /100 | #258 | Tragic 61.3% |
| Indonesians | 0.3 /100 | #259 | Tragic 61.2% |
Demographics Similar to Finns by College, Under 1 year
In terms of college, under 1 year, the demographic groups most similar to Finns are Polish (66.9%, a difference of 0.020%), Immigrants from Brazil (66.9%, a difference of 0.030%), Immigrants from Syria (66.9%, a difference of 0.040%), Iraqi (66.8%, a difference of 0.060%), and Canadian (66.8%, a difference of 0.070%).
| Demographics | Rating | Rank | College, Under 1 year |
| Arabs | 92.6 /100 | #124 | Exceptional 67.2% |
| Italians | 91.8 /100 | #125 | Exceptional 67.2% |
| Alsatians | 91.3 /100 | #126 | Exceptional 67.1% |
| Czechs | 90.8 /100 | #127 | Exceptional 67.1% |
| Scottish | 90.2 /100 | #128 | Exceptional 67.0% |
| Immigrants | Eastern Africa | 89.5 /100 | #129 | Excellent 67.0% |
| Immigrants | Syria | 89.0 /100 | #130 | Excellent 66.9% |
| Finns | 88.6 /100 | #131 | Excellent 66.9% |
| Poles | 88.4 /100 | #132 | Excellent 66.9% |
| Immigrants | Brazil | 88.3 /100 | #133 | Excellent 66.9% |
| Iraqis | 88.0 /100 | #134 | Excellent 66.8% |
| Canadians | 87.9 /100 | #135 | Excellent 66.8% |
| Ugandans | 87.8 /100 | #136 | Excellent 66.8% |
| Immigrants | Chile | 87.4 /100 | #137 | Excellent 66.8% |
| Immigrants | Italy | 86.9 /100 | #138 | Excellent 66.8% |