West Indian vs Immigrants from West Indies College, Under 1 year
COMPARE
West Indian
Immigrants from West Indies
College, Under 1 year
College, Under 1 year Comparison
West Indians
Immigrants from West Indies
61.5%
COLLEGE, UNDER 1 YEAR
0.4/ 100
METRIC RATING
252nd/ 347
METRIC RANK
60.6%
COLLEGE, UNDER 1 YEAR
0.1/ 100
METRIC RATING
269th/ 347
METRIC RANK
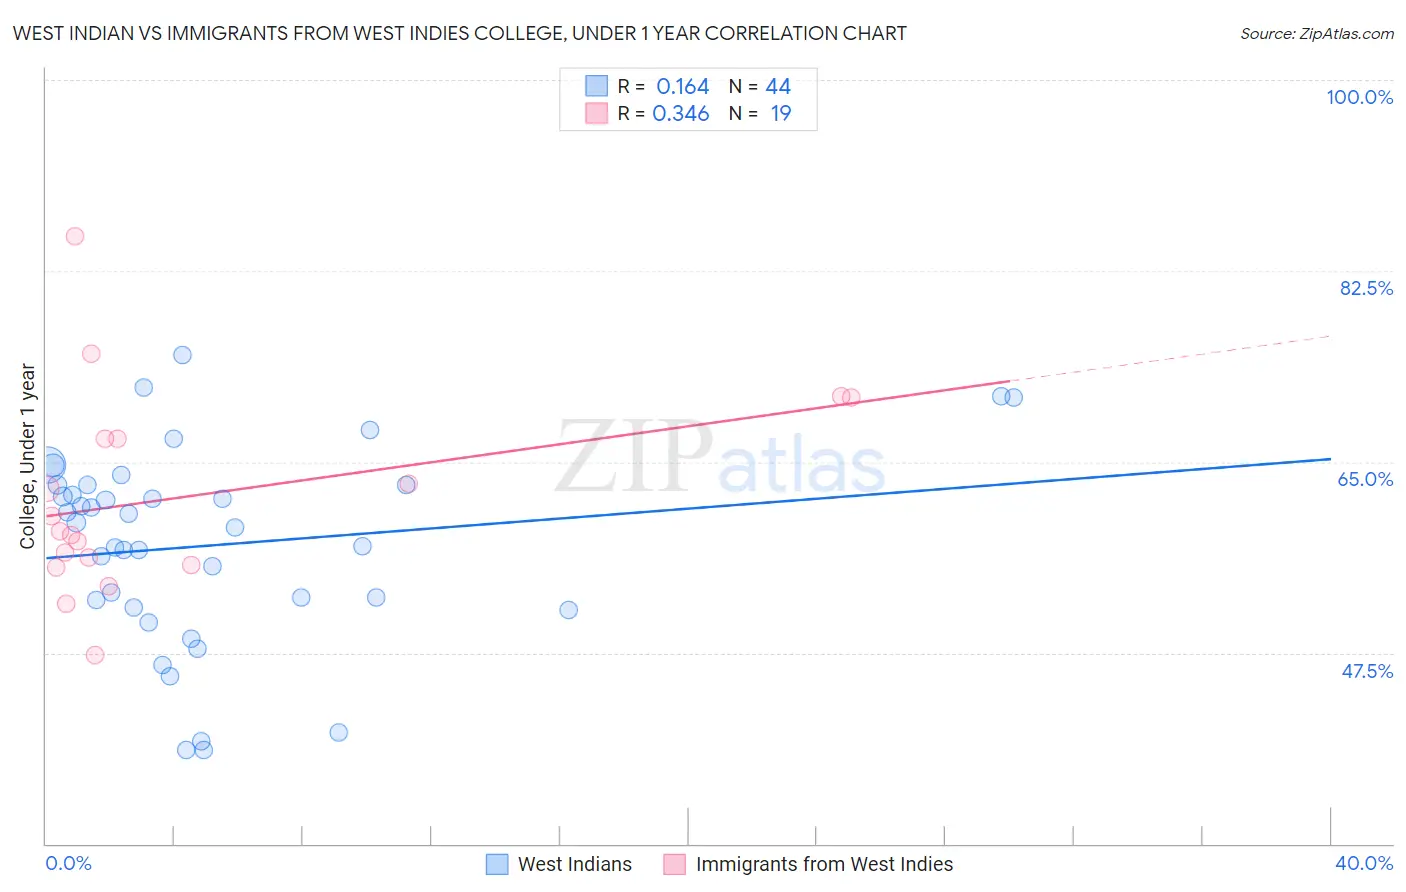
West Indian vs Immigrants from West Indies College, Under 1 year Correlation Chart
The statistical analysis conducted on geographies consisting of 254,063,654 people shows a poor positive correlation between the proportion of West Indians and percentage of population with at least college, under 1 year education in the United States with a correlation coefficient (R) of 0.164 and weighted average of 61.5%. Similarly, the statistical analysis conducted on geographies consisting of 72,457,514 people shows a mild positive correlation between the proportion of Immigrants from West Indies and percentage of population with at least college, under 1 year education in the United States with a correlation coefficient (R) of 0.346 and weighted average of 60.6%, a difference of 1.4%.
College, Under 1 year Correlation Summary
| Measurement | West Indian | Immigrants from West Indies |
| Minimum | 38.5% | 47.3% |
| Maximum | 74.8% | 85.6% |
| Range | 36.3% | 38.3% |
| Mean | 57.4% | 61.8% |
| Median | 59.2% | 58.6% |
| Interquartile 25% (IQ1) | 52.0% | 55.5% |
| Interquartile 75% (IQ3) | 62.9% | 67.2% |
| Interquartile Range (IQR) | 10.8% | 11.6% |
| Standard Deviation (Sample) | 8.9% | 9.2% |
| Standard Deviation (Population) | 8.8% | 8.9% |
Demographics Similar to West Indians and Immigrants from West Indies by College, Under 1 year
In terms of college, under 1 year, the demographic groups most similar to West Indians are Japanese (61.5%, a difference of 0.0%), Immigrants from Cambodia (61.5%, a difference of 0.0%), Immigrants from Micronesia (61.5%, a difference of 0.11%), Comanche (61.4%, a difference of 0.13%), and Bangladeshi (61.4%, a difference of 0.17%). Similarly, the demographic groups most similar to Immigrants from West Indies are Cheyenne (60.6%, a difference of 0.11%), Immigrants from Trinidad and Tobago (60.7%, a difference of 0.12%), American (61.0%, a difference of 0.57%), Alaskan Athabascan (61.0%, a difference of 0.58%), and Trinidadian and Tobagonian (61.1%, a difference of 0.70%).
| Demographics | Rating | Rank | College, Under 1 year |
| Immigrants | Congo | 0.5 /100 | #250 | Tragic 61.7% |
| Immigrants | Micronesia | 0.5 /100 | #251 | Tragic 61.5% |
| West Indians | 0.4 /100 | #252 | Tragic 61.5% |
| Japanese | 0.4 /100 | #253 | Tragic 61.5% |
| Immigrants | Cambodia | 0.4 /100 | #254 | Tragic 61.5% |
| Comanche | 0.4 /100 | #255 | Tragic 61.4% |
| Bangladeshis | 0.4 /100 | #256 | Tragic 61.4% |
| Immigrants | Laos | 0.3 /100 | #257 | Tragic 61.3% |
| Immigrants | Bangladesh | 0.3 /100 | #258 | Tragic 61.3% |
| Indonesians | 0.3 /100 | #259 | Tragic 61.2% |
| Blackfeet | 0.3 /100 | #260 | Tragic 61.1% |
| Africans | 0.3 /100 | #261 | Tragic 61.1% |
| Barbadians | 0.2 /100 | #262 | Tragic 61.1% |
| Shoshone | 0.2 /100 | #263 | Tragic 61.1% |
| Trinidadians and Tobagonians | 0.2 /100 | #264 | Tragic 61.1% |
| Immigrants | Bahamas | 0.2 /100 | #265 | Tragic 61.1% |
| Alaskan Athabascans | 0.2 /100 | #266 | Tragic 61.0% |
| Americans | 0.2 /100 | #267 | Tragic 61.0% |
| Immigrants | Trinidad and Tobago | 0.1 /100 | #268 | Tragic 60.7% |
| Immigrants | West Indies | 0.1 /100 | #269 | Tragic 60.6% |
| Cheyenne | 0.1 /100 | #270 | Tragic 60.6% |