Tlingit-Haida vs Hungarian Ambulatory Disability
COMPARE
Tlingit-Haida
Hungarian
Ambulatory Disability
Ambulatory Disability Comparison
Tlingit-Haida
Hungarians
6.5%
AMBULATORY DISABILITY
1.5/ 100
METRIC RATING
245th/ 347
METRIC RANK
6.3%
AMBULATORY DISABILITY
9.6/ 100
METRIC RATING
221st/ 347
METRIC RANK
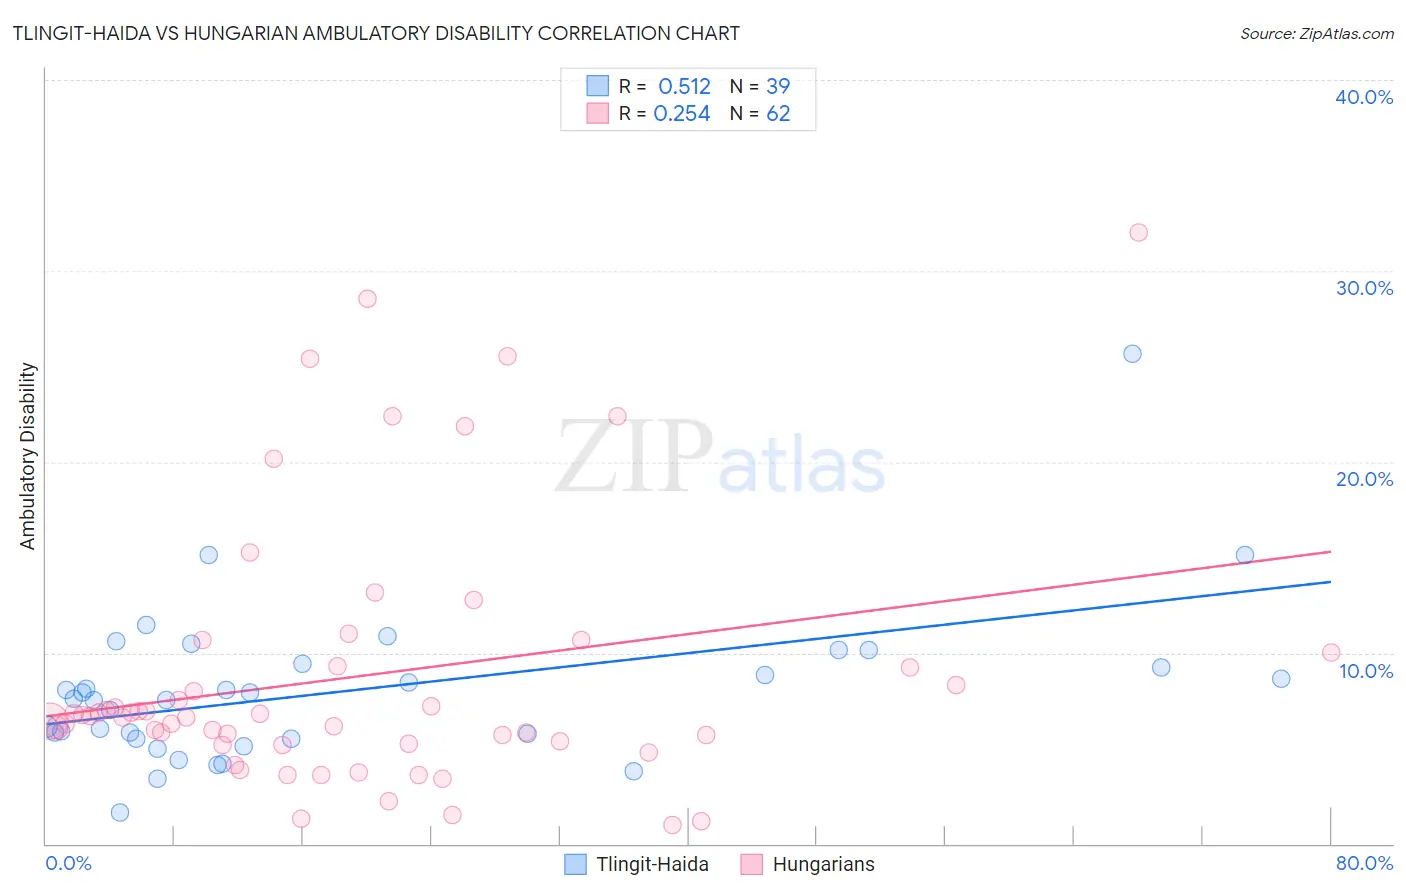
Tlingit-Haida vs Hungarian Ambulatory Disability Correlation Chart
The statistical analysis conducted on geographies consisting of 60,848,336 people shows a substantial positive correlation between the proportion of Tlingit-Haida and percentage of population with ambulatory disability in the United States with a correlation coefficient (R) of 0.512 and weighted average of 6.5%. Similarly, the statistical analysis conducted on geographies consisting of 486,018,761 people shows a weak positive correlation between the proportion of Hungarians and percentage of population with ambulatory disability in the United States with a correlation coefficient (R) of 0.254 and weighted average of 6.3%, a difference of 2.5%.
Ambulatory Disability Correlation Summary
| Measurement | Tlingit-Haida | Hungarian |
| Minimum | 1.6% | 1.0% |
| Maximum | 25.7% | 32.0% |
| Range | 24.0% | 31.0% |
| Mean | 8.0% | 8.8% |
| Median | 7.6% | 6.7% |
| Interquartile 25% (IQ1) | 5.5% | 5.2% |
| Interquartile 75% (IQ3) | 9.5% | 9.3% |
| Interquartile Range (IQR) | 4.0% | 4.1% |
| Standard Deviation (Sample) | 4.1% | 6.9% |
| Standard Deviation (Population) | 4.1% | 6.8% |
Similar Demographics by Ambulatory Disability
Demographics Similar to Tlingit-Haida by Ambulatory Disability
In terms of ambulatory disability, the demographic groups most similar to Tlingit-Haida are Armenian (6.5%, a difference of 0.020%), Immigrants from Panama (6.5%, a difference of 0.030%), German (6.5%, a difference of 0.040%), Spaniard (6.5%, a difference of 0.060%), and Immigrants from Cuba (6.5%, a difference of 0.070%).
| Demographics | Rating | Rank | Ambulatory Disability |
| Haitians | 1.8 /100 | #238 | Tragic 6.4% |
| Senegalese | 1.7 /100 | #239 | Tragic 6.4% |
| Immigrants | Senegal | 1.7 /100 | #240 | Tragic 6.4% |
| Immigrants | Haiti | 1.6 /100 | #241 | Tragic 6.5% |
| Spaniards | 1.6 /100 | #242 | Tragic 6.5% |
| Germans | 1.5 /100 | #243 | Tragic 6.5% |
| Immigrants | Panama | 1.5 /100 | #244 | Tragic 6.5% |
| Tlingit-Haida | 1.5 /100 | #245 | Tragic 6.5% |
| Armenians | 1.5 /100 | #246 | Tragic 6.5% |
| Immigrants | Cuba | 1.4 /100 | #247 | Tragic 6.5% |
| Immigrants | Portugal | 1.4 /100 | #248 | Tragic 6.5% |
| Native Hawaiians | 1.1 /100 | #249 | Tragic 6.5% |
| Chinese | 1.0 /100 | #250 | Tragic 6.5% |
| Hawaiians | 0.9 /100 | #251 | Tragic 6.5% |
| Immigrants | Bahamas | 0.8 /100 | #252 | Tragic 6.5% |
Demographics Similar to Hungarians by Ambulatory Disability
In terms of ambulatory disability, the demographic groups most similar to Hungarians are Immigrants from Albania (6.3%, a difference of 0.010%), German Russian (6.3%, a difference of 0.030%), Indonesian (6.3%, a difference of 0.050%), Guamanian/Chamorro (6.3%, a difference of 0.14%), and Yugoslavian (6.3%, a difference of 0.18%).
| Demographics | Rating | Rank | Ambulatory Disability |
| Immigrants | Mexico | 11.0 /100 | #214 | Poor 6.3% |
| Immigrants | Latin America | 11.0 /100 | #215 | Poor 6.3% |
| Canadians | 10.9 /100 | #216 | Poor 6.3% |
| Yugoslavians | 10.9 /100 | #217 | Poor 6.3% |
| Guamanians/Chamorros | 10.6 /100 | #218 | Poor 6.3% |
| Indonesians | 9.9 /100 | #219 | Tragic 6.3% |
| Immigrants | Albania | 9.6 /100 | #220 | Tragic 6.3% |
| Hungarians | 9.6 /100 | #221 | Tragic 6.3% |
| German Russians | 9.4 /100 | #222 | Tragic 6.3% |
| Immigrants | Honduras | 7.6 /100 | #223 | Tragic 6.3% |
| Liberians | 7.1 /100 | #224 | Tragic 6.3% |
| Hondurans | 6.3 /100 | #225 | Tragic 6.3% |
| Slavs | 5.1 /100 | #226 | Tragic 6.4% |
| Cubans | 4.0 /100 | #227 | Tragic 6.4% |
| Portuguese | 4.0 /100 | #228 | Tragic 6.4% |