Spaniard vs Immigrants from Panama Male Disability
COMPARE
Spaniard
Immigrants from Panama
Male Disability
Male Disability Comparison
Spaniards
Immigrants from Panama
12.3%
MALE DISABILITY
0.1/ 100
METRIC RATING
270th/ 347
METRIC RANK
11.5%
MALE DISABILITY
13.0/ 100
METRIC RATING
201st/ 347
METRIC RANK
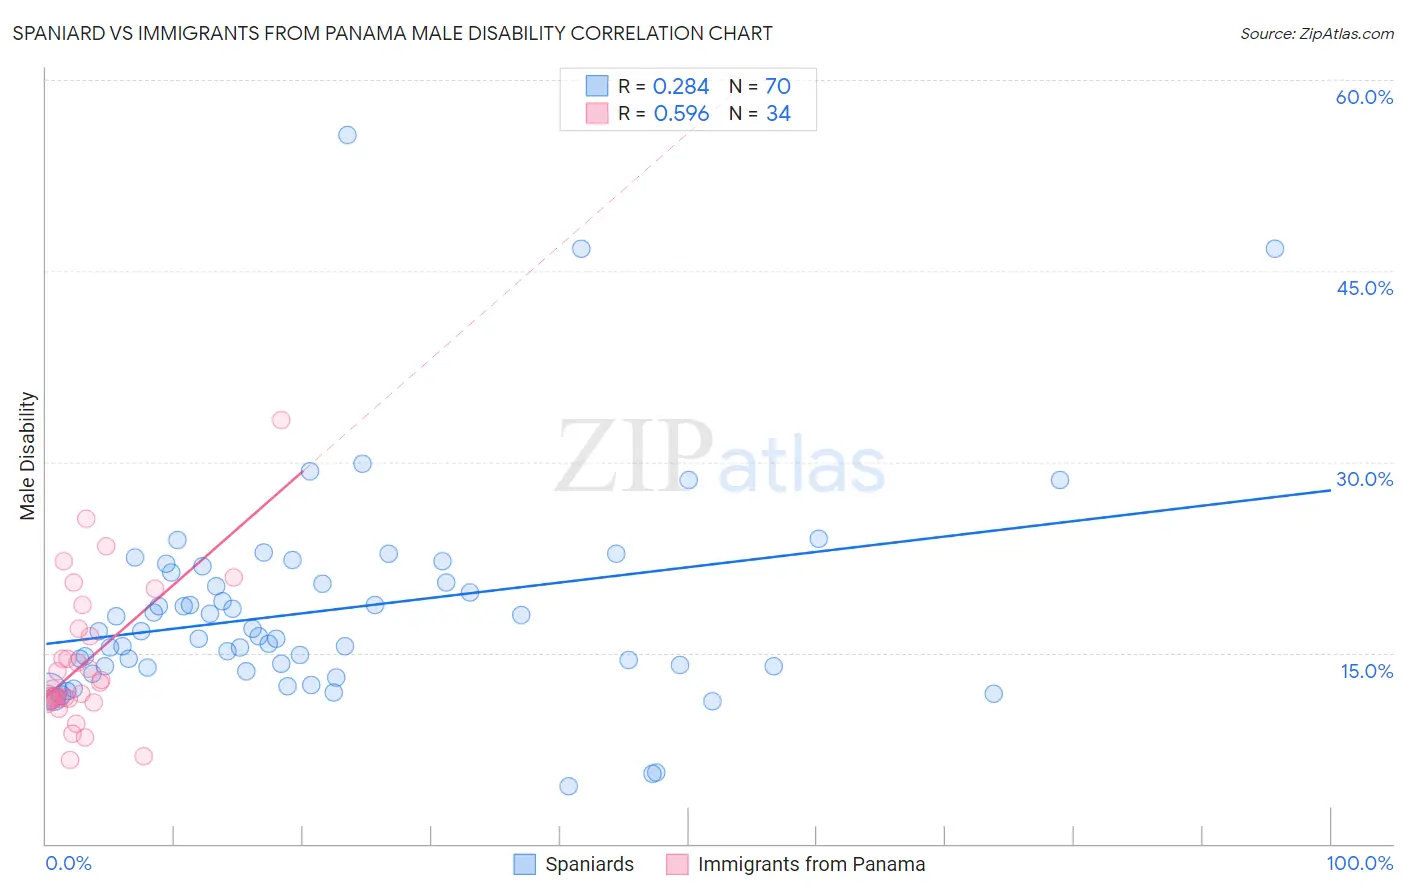
Spaniard vs Immigrants from Panama Male Disability Correlation Chart
The statistical analysis conducted on geographies consisting of 443,401,909 people shows a weak positive correlation between the proportion of Spaniards and percentage of males with a disability in the United States with a correlation coefficient (R) of 0.284 and weighted average of 12.3%. Similarly, the statistical analysis conducted on geographies consisting of 221,177,932 people shows a substantial positive correlation between the proportion of Immigrants from Panama and percentage of males with a disability in the United States with a correlation coefficient (R) of 0.596 and weighted average of 11.5%, a difference of 6.8%.
Male Disability Correlation Summary
| Measurement | Spaniard | Immigrants from Panama |
| Minimum | 4.5% | 6.6% |
| Maximum | 55.7% | 33.3% |
| Range | 51.2% | 26.7% |
| Mean | 18.4% | 14.4% |
| Median | 16.5% | 12.4% |
| Interquartile 25% (IQ1) | 13.9% | 11.4% |
| Interquartile 75% (IQ3) | 21.3% | 16.9% |
| Interquartile Range (IQR) | 7.4% | 5.5% |
| Standard Deviation (Sample) | 8.5% | 5.7% |
| Standard Deviation (Population) | 8.4% | 5.7% |
Similar Demographics by Male Disability
Demographics Similar to Spaniards by Male Disability
In terms of male disability, the demographic groups most similar to Spaniards are Czechoslovakian (12.3%, a difference of 0.080%), Portuguese (12.3%, a difference of 0.090%), Scandinavian (12.3%, a difference of 0.19%), Immigrants from Germany (12.3%, a difference of 0.21%), and Hawaiian (12.3%, a difference of 0.26%).
| Demographics | Rating | Rank | Male Disability |
| Canadians | 0.2 /100 | #263 | Tragic 12.2% |
| Nepalese | 0.2 /100 | #264 | Tragic 12.2% |
| Immigrants | Portugal | 0.1 /100 | #265 | Tragic 12.3% |
| Hawaiians | 0.1 /100 | #266 | Tragic 12.3% |
| Immigrants | Germany | 0.1 /100 | #267 | Tragic 12.3% |
| Portuguese | 0.1 /100 | #268 | Tragic 12.3% |
| Czechoslovakians | 0.1 /100 | #269 | Tragic 12.3% |
| Spaniards | 0.1 /100 | #270 | Tragic 12.3% |
| Scandinavians | 0.1 /100 | #271 | Tragic 12.3% |
| Hmong | 0.0 /100 | #272 | Tragic 12.5% |
| Native Hawaiians | 0.0 /100 | #273 | Tragic 12.5% |
| Hopi | 0.0 /100 | #274 | Tragic 12.5% |
| Fijians | 0.0 /100 | #275 | Tragic 12.6% |
| Africans | 0.0 /100 | #276 | Tragic 12.6% |
| Finns | 0.0 /100 | #277 | Tragic 12.6% |
Demographics Similar to Immigrants from Panama by Male Disability
In terms of male disability, the demographic groups most similar to Immigrants from Panama are Immigrants from Iraq (11.5%, a difference of 0.0%), Immigrants from Mexico (11.5%, a difference of 0.040%), Lebanese (11.5%, a difference of 0.27%), Jamaican (11.5%, a difference of 0.27%), and Immigrants from Cambodia (11.5%, a difference of 0.29%).
| Demographics | Rating | Rank | Male Disability |
| Belizeans | 21.2 /100 | #194 | Fair 11.4% |
| Immigrants | Oceania | 20.9 /100 | #195 | Fair 11.4% |
| West Indians | 18.4 /100 | #196 | Poor 11.4% |
| Somalis | 18.2 /100 | #197 | Poor 11.4% |
| Immigrants | Jamaica | 16.3 /100 | #198 | Poor 11.5% |
| Lebanese | 15.4 /100 | #199 | Poor 11.5% |
| Immigrants | Iraq | 13.0 /100 | #200 | Poor 11.5% |
| Immigrants | Panama | 13.0 /100 | #201 | Poor 11.5% |
| Immigrants | Mexico | 12.6 /100 | #202 | Poor 11.5% |
| Jamaicans | 10.9 /100 | #203 | Poor 11.5% |
| Immigrants | Cambodia | 10.8 /100 | #204 | Poor 11.5% |
| Serbians | 10.7 /100 | #205 | Poor 11.5% |
| Ukrainians | 10.6 /100 | #206 | Poor 11.5% |
| Immigrants | Somalia | 10.4 /100 | #207 | Poor 11.5% |
| Icelanders | 10.1 /100 | #208 | Poor 11.6% |