Spaniard vs Basque Male Disability
COMPARE
Spaniard
Basque
Male Disability
Male Disability Comparison
Spaniards
Basques
12.3%
MALE DISABILITY
0.1/ 100
METRIC RATING
270th/ 347
METRIC RANK
12.1%
MALE DISABILITY
0.3/ 100
METRIC RATING
258th/ 347
METRIC RANK
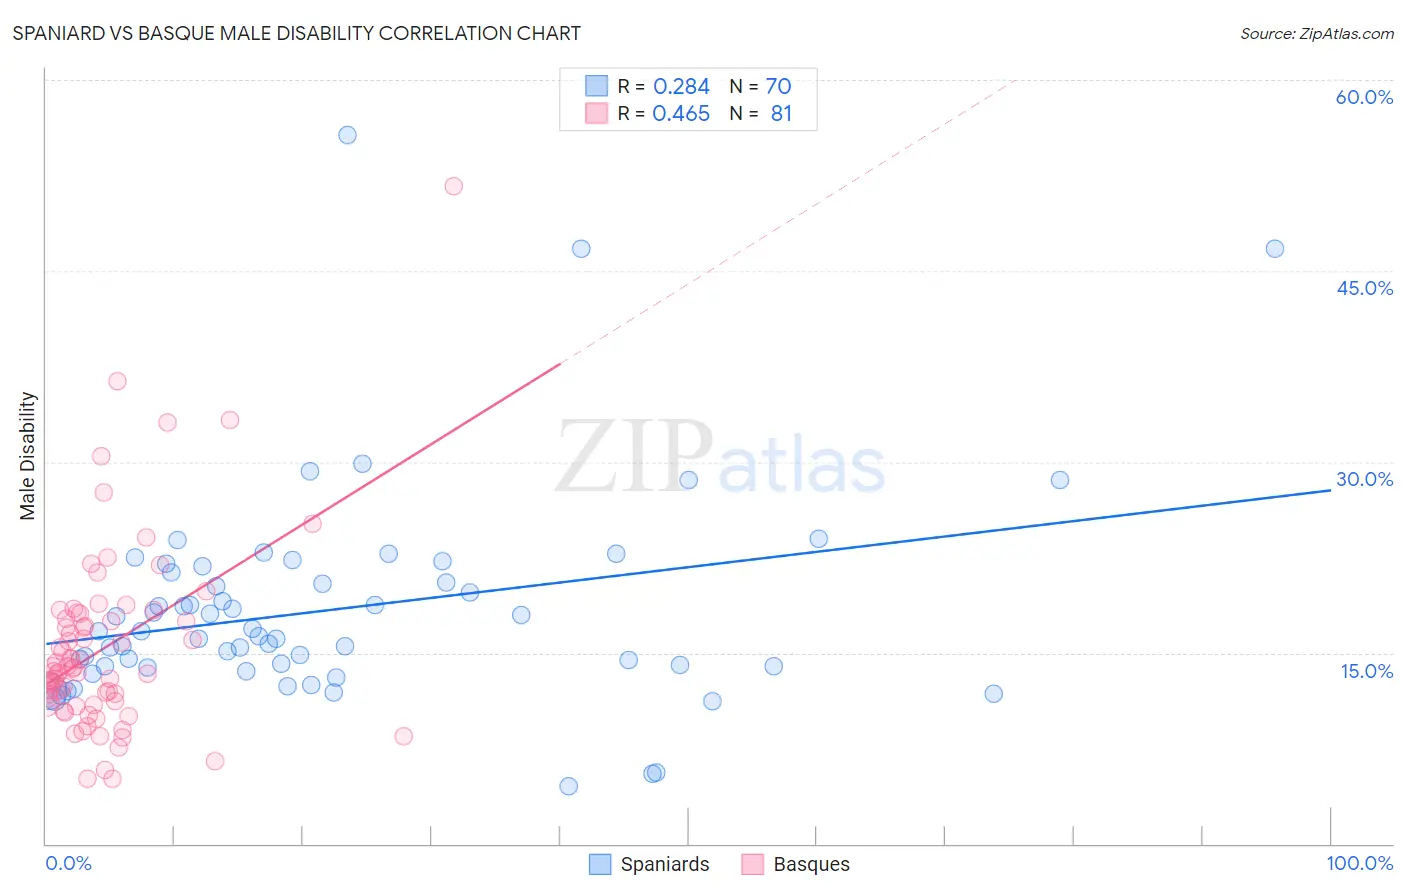
Spaniard vs Basque Male Disability Correlation Chart
The statistical analysis conducted on geographies consisting of 443,401,909 people shows a weak positive correlation between the proportion of Spaniards and percentage of males with a disability in the United States with a correlation coefficient (R) of 0.284 and weighted average of 12.3%. Similarly, the statistical analysis conducted on geographies consisting of 165,777,747 people shows a moderate positive correlation between the proportion of Basques and percentage of males with a disability in the United States with a correlation coefficient (R) of 0.465 and weighted average of 12.1%, a difference of 1.5%.
Male Disability Correlation Summary
| Measurement | Spaniard | Basque |
| Minimum | 4.5% | 5.1% |
| Maximum | 55.7% | 51.7% |
| Range | 51.2% | 46.6% |
| Mean | 18.4% | 15.4% |
| Median | 16.5% | 13.8% |
| Interquartile 25% (IQ1) | 13.9% | 11.1% |
| Interquartile 75% (IQ3) | 21.3% | 17.9% |
| Interquartile Range (IQR) | 7.4% | 6.7% |
| Standard Deviation (Sample) | 8.5% | 7.4% |
| Standard Deviation (Population) | 8.4% | 7.3% |
Demographics Similar to Spaniards and Basques by Male Disability
In terms of male disability, the demographic groups most similar to Spaniards are Czechoslovakian (12.3%, a difference of 0.080%), Portuguese (12.3%, a difference of 0.090%), Scandinavian (12.3%, a difference of 0.19%), Immigrants from Germany (12.3%, a difference of 0.21%), and Hawaiian (12.3%, a difference of 0.26%). Similarly, the demographic groups most similar to Basques are Belgian (12.1%, a difference of 0.040%), Swedish (12.1%, a difference of 0.12%), Swiss (12.1%, a difference of 0.19%), European (12.1%, a difference of 0.19%), and Chinese (12.1%, a difference of 0.44%).
| Demographics | Rating | Rank | Male Disability |
| British | 0.4 /100 | #254 | Tragic 12.1% |
| Chinese | 0.4 /100 | #255 | Tragic 12.1% |
| Swiss | 0.3 /100 | #256 | Tragic 12.1% |
| Europeans | 0.3 /100 | #257 | Tragic 12.1% |
| Basques | 0.3 /100 | #258 | Tragic 12.1% |
| Belgians | 0.3 /100 | #259 | Tragic 12.1% |
| Swedes | 0.3 /100 | #260 | Tragic 12.1% |
| Slavs | 0.2 /100 | #261 | Tragic 12.2% |
| Norwegians | 0.2 /100 | #262 | Tragic 12.2% |
| Canadians | 0.2 /100 | #263 | Tragic 12.2% |
| Nepalese | 0.2 /100 | #264 | Tragic 12.2% |
| Immigrants | Portugal | 0.1 /100 | #265 | Tragic 12.3% |
| Hawaiians | 0.1 /100 | #266 | Tragic 12.3% |
| Immigrants | Germany | 0.1 /100 | #267 | Tragic 12.3% |
| Portuguese | 0.1 /100 | #268 | Tragic 12.3% |
| Czechoslovakians | 0.1 /100 | #269 | Tragic 12.3% |
| Spaniards | 0.1 /100 | #270 | Tragic 12.3% |
| Scandinavians | 0.1 /100 | #271 | Tragic 12.3% |
| Hmong | 0.0 /100 | #272 | Tragic 12.5% |
| Native Hawaiians | 0.0 /100 | #273 | Tragic 12.5% |
| Hopi | 0.0 /100 | #274 | Tragic 12.5% |