Spaniard vs Hispanic or Latino Male Disability
COMPARE
Spaniard
Hispanic or Latino
Male Disability
Male Disability Comparison
Spaniards
Hispanics or Latinos
12.3%
MALE DISABILITY
0.1/ 100
METRIC RATING
270th/ 347
METRIC RANK
11.8%
MALE DISABILITY
2.3/ 100
METRIC RATING
228th/ 347
METRIC RANK
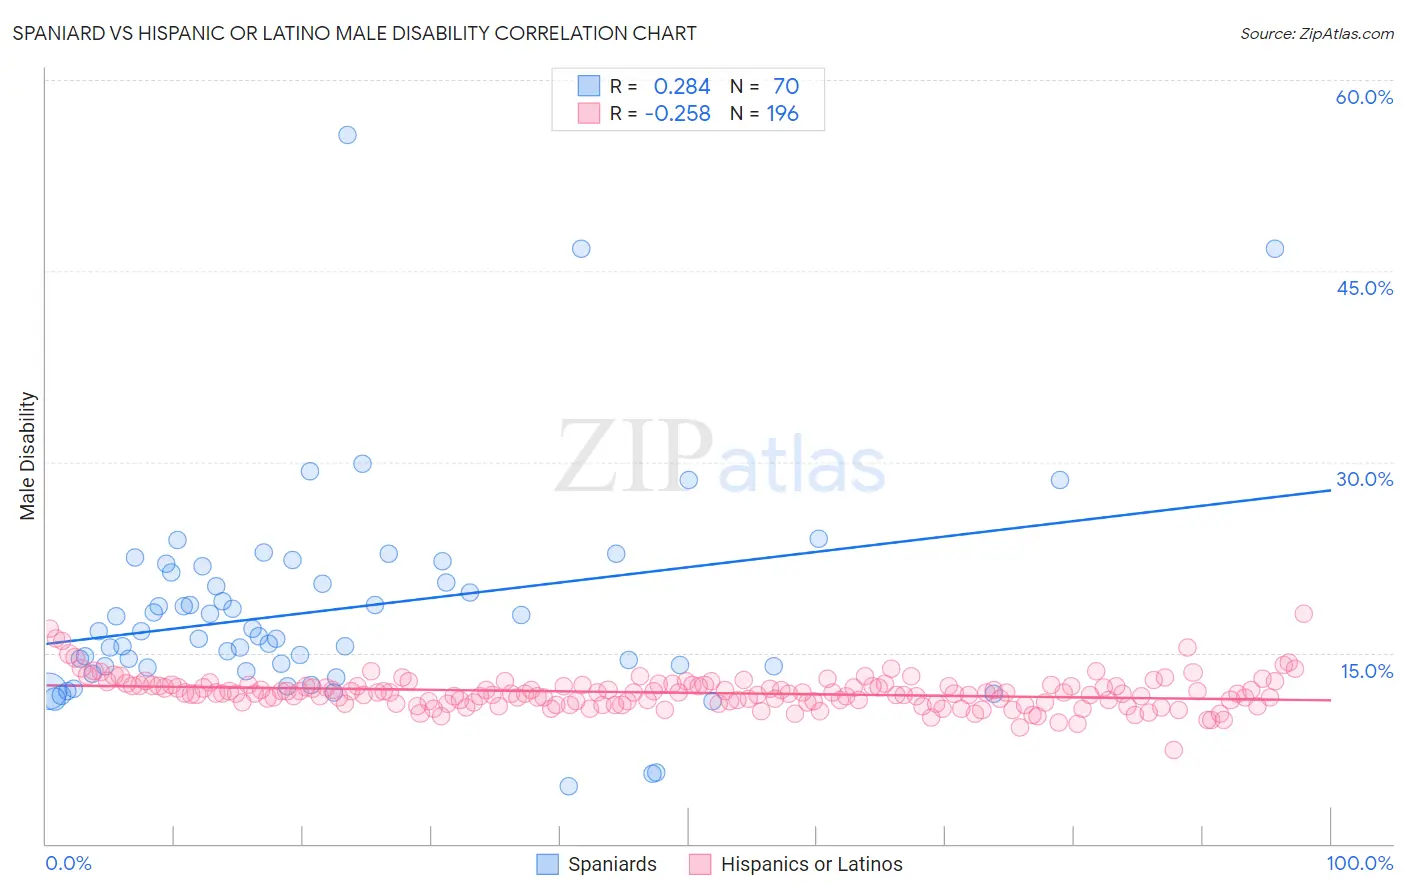
Spaniard vs Hispanic or Latino Male Disability Correlation Chart
The statistical analysis conducted on geographies consisting of 443,401,909 people shows a weak positive correlation between the proportion of Spaniards and percentage of males with a disability in the United States with a correlation coefficient (R) of 0.284 and weighted average of 12.3%. Similarly, the statistical analysis conducted on geographies consisting of 573,649,400 people shows a weak negative correlation between the proportion of Hispanics or Latinos and percentage of males with a disability in the United States with a correlation coefficient (R) of -0.258 and weighted average of 11.8%, a difference of 4.2%.
Male Disability Correlation Summary
| Measurement | Spaniard | Hispanic or Latino |
| Minimum | 4.5% | 7.3% |
| Maximum | 55.7% | 18.1% |
| Range | 51.2% | 10.7% |
| Mean | 18.4% | 11.9% |
| Median | 16.5% | 11.8% |
| Interquartile 25% (IQ1) | 13.9% | 11.1% |
| Interquartile 75% (IQ3) | 21.3% | 12.4% |
| Interquartile Range (IQR) | 7.4% | 1.3% |
| Standard Deviation (Sample) | 8.5% | 1.3% |
| Standard Deviation (Population) | 8.4% | 1.3% |
Similar Demographics by Male Disability
Demographics Similar to Spaniards by Male Disability
In terms of male disability, the demographic groups most similar to Spaniards are Czechoslovakian (12.3%, a difference of 0.080%), Portuguese (12.3%, a difference of 0.090%), Scandinavian (12.3%, a difference of 0.19%), Immigrants from Germany (12.3%, a difference of 0.21%), and Hawaiian (12.3%, a difference of 0.26%).
| Demographics | Rating | Rank | Male Disability |
| Canadians | 0.2 /100 | #263 | Tragic 12.2% |
| Nepalese | 0.2 /100 | #264 | Tragic 12.2% |
| Immigrants | Portugal | 0.1 /100 | #265 | Tragic 12.3% |
| Hawaiians | 0.1 /100 | #266 | Tragic 12.3% |
| Immigrants | Germany | 0.1 /100 | #267 | Tragic 12.3% |
| Portuguese | 0.1 /100 | #268 | Tragic 12.3% |
| Czechoslovakians | 0.1 /100 | #269 | Tragic 12.3% |
| Spaniards | 0.1 /100 | #270 | Tragic 12.3% |
| Scandinavians | 0.1 /100 | #271 | Tragic 12.3% |
| Hmong | 0.0 /100 | #272 | Tragic 12.5% |
| Native Hawaiians | 0.0 /100 | #273 | Tragic 12.5% |
| Hopi | 0.0 /100 | #274 | Tragic 12.5% |
| Fijians | 0.0 /100 | #275 | Tragic 12.6% |
| Africans | 0.0 /100 | #276 | Tragic 12.6% |
| Finns | 0.0 /100 | #277 | Tragic 12.6% |
Demographics Similar to Hispanics or Latinos by Male Disability
In terms of male disability, the demographic groups most similar to Hispanics or Latinos are Bermudan (11.8%, a difference of 0.030%), Austrian (11.8%, a difference of 0.080%), Croatian (11.8%, a difference of 0.12%), Subsaharan African (11.8%, a difference of 0.26%), and Dominican (11.8%, a difference of 0.32%).
| Demographics | Rating | Rank | Male Disability |
| Immigrants | Congo | 3.7 /100 | #221 | Tragic 11.7% |
| Alsatians | 3.3 /100 | #222 | Tragic 11.7% |
| Immigrants | Bahamas | 3.2 /100 | #223 | Tragic 11.7% |
| Japanese | 3.1 /100 | #224 | Tragic 11.7% |
| Liberians | 3.1 /100 | #225 | Tragic 11.8% |
| Sub-Saharan Africans | 2.8 /100 | #226 | Tragic 11.8% |
| Austrians | 2.5 /100 | #227 | Tragic 11.8% |
| Hispanics or Latinos | 2.3 /100 | #228 | Tragic 11.8% |
| Bermudans | 2.3 /100 | #229 | Tragic 11.8% |
| Croatians | 2.1 /100 | #230 | Tragic 11.8% |
| Dominicans | 1.8 /100 | #231 | Tragic 11.8% |
| Malaysians | 1.8 /100 | #232 | Tragic 11.8% |
| Mexicans | 1.7 /100 | #233 | Tragic 11.8% |
| Immigrants | Canada | 1.6 /100 | #234 | Tragic 11.9% |
| Immigrants | North America | 1.5 /100 | #235 | Tragic 11.9% |