Italian vs South American Indian Female Disability
COMPARE
Italian
South American Indian
Female Disability
Female Disability Comparison
Italians
South American Indians
12.4%
FEMALE DISABILITY
10.7/ 100
METRIC RATING
222nd/ 347
METRIC RANK
11.8%
FEMALE DISABILITY
95.8/ 100
METRIC RATING
127th/ 347
METRIC RANK
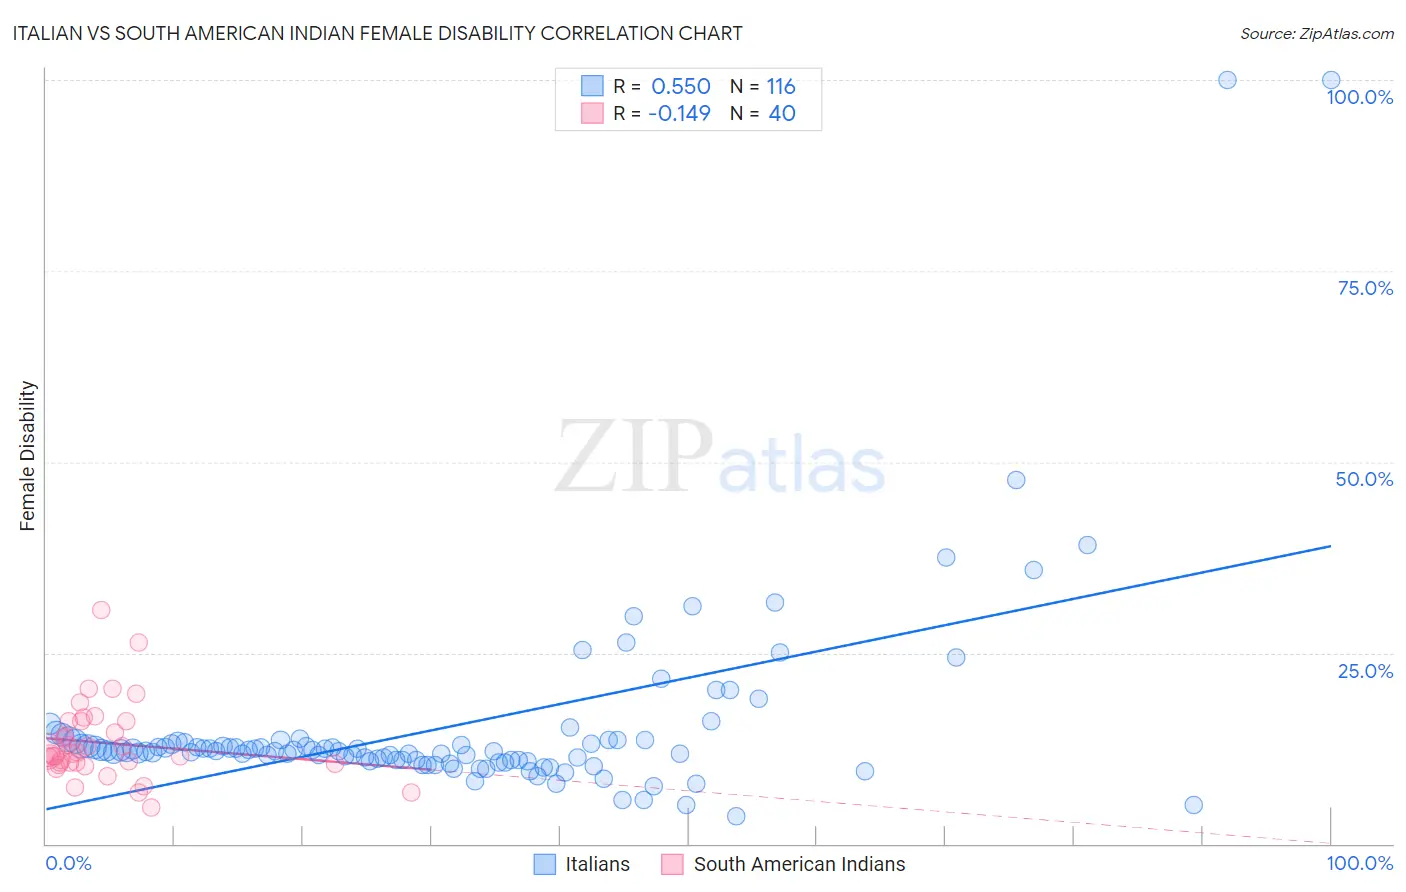
Italian vs South American Indian Female Disability Correlation Chart
The statistical analysis conducted on geographies consisting of 574,730,286 people shows a substantial positive correlation between the proportion of Italians and percentage of females with a disability in the United States with a correlation coefficient (R) of 0.550 and weighted average of 12.4%. Similarly, the statistical analysis conducted on geographies consisting of 164,561,575 people shows a poor negative correlation between the proportion of South American Indians and percentage of females with a disability in the United States with a correlation coefficient (R) of -0.149 and weighted average of 11.8%, a difference of 5.1%.
Female Disability Correlation Summary
| Measurement | Italian | South American Indian |
| Minimum | 3.6% | 4.7% |
| Maximum | 100.0% | 30.6% |
| Range | 96.4% | 25.9% |
| Mean | 15.2% | 13.2% |
| Median | 12.2% | 11.8% |
| Interquartile 25% (IQ1) | 11.0% | 10.5% |
| Interquartile 75% (IQ3) | 13.4% | 16.0% |
| Interquartile Range (IQR) | 2.4% | 5.5% |
| Standard Deviation (Sample) | 13.2% | 5.1% |
| Standard Deviation (Population) | 13.1% | 5.1% |
Similar Demographics by Female Disability
Demographics Similar to Italians by Female Disability
In terms of female disability, the demographic groups most similar to Italians are Native Hawaiian (12.4%, a difference of 0.010%), Bahamian (12.4%, a difference of 0.040%), European (12.4%, a difference of 0.13%), Guamanian/Chamorro (12.5%, a difference of 0.13%), and Belizean (12.5%, a difference of 0.14%).
| Demographics | Rating | Rank | Female Disability |
| Samoans | 13.4 /100 | #215 | Poor 12.4% |
| Immigrants | Burma/Myanmar | 13.3 /100 | #216 | Poor 12.4% |
| British | 12.7 /100 | #217 | Poor 12.4% |
| Immigrants | Bahamas | 12.5 /100 | #218 | Poor 12.4% |
| Europeans | 12.1 /100 | #219 | Poor 12.4% |
| Bahamians | 11.1 /100 | #220 | Poor 12.4% |
| Native Hawaiians | 10.8 /100 | #221 | Poor 12.4% |
| Italians | 10.7 /100 | #222 | Poor 12.4% |
| Guamanians/Chamorros | 9.5 /100 | #223 | Tragic 12.5% |
| Belizeans | 9.3 /100 | #224 | Tragic 12.5% |
| Poles | 8.4 /100 | #225 | Tragic 12.5% |
| Hispanics or Latinos | 8.0 /100 | #226 | Tragic 12.5% |
| Assyrians/Chaldeans/Syriacs | 8.0 /100 | #227 | Tragic 12.5% |
| Immigrants | Cambodia | 7.8 /100 | #228 | Tragic 12.5% |
| Hungarians | 7.2 /100 | #229 | Tragic 12.5% |
Demographics Similar to South American Indians by Female Disability
In terms of female disability, the demographic groups most similar to South American Indians are Immigrants from Latvia (11.8%, a difference of 0.040%), Macedonian (11.8%, a difference of 0.070%), Immigrants from Europe (11.8%, a difference of 0.10%), Nicaraguan (11.9%, a difference of 0.13%), and Arab (11.9%, a difference of 0.16%).
| Demographics | Rating | Rank | Female Disability |
| Immigrants | Kazakhstan | 97.0 /100 | #120 | Exceptional 11.8% |
| Immigrants | Netherlands | 96.9 /100 | #121 | Exceptional 11.8% |
| Immigrants | North Macedonia | 96.8 /100 | #122 | Exceptional 11.8% |
| Immigrants | Croatia | 96.7 /100 | #123 | Exceptional 11.8% |
| Russians | 96.5 /100 | #124 | Exceptional 11.8% |
| Immigrants | Italy | 96.4 /100 | #125 | Exceptional 11.8% |
| Immigrants | Europe | 96.2 /100 | #126 | Exceptional 11.8% |
| South American Indians | 95.8 /100 | #127 | Exceptional 11.8% |
| Immigrants | Latvia | 95.6 /100 | #128 | Exceptional 11.8% |
| Macedonians | 95.5 /100 | #129 | Exceptional 11.8% |
| Nicaraguans | 95.2 /100 | #130 | Exceptional 11.9% |
| Arabs | 95.1 /100 | #131 | Exceptional 11.9% |
| Immigrants | Syria | 94.6 /100 | #132 | Exceptional 11.9% |
| Kenyans | 94.5 /100 | #133 | Exceptional 11.9% |
| Immigrants | Nicaragua | 94.5 /100 | #134 | Exceptional 11.9% |