Italian vs Romanian Female Disability
COMPARE
Italian
Romanian
Female Disability
Female Disability Comparison
Italians
Romanians
12.4%
FEMALE DISABILITY
10.7/ 100
METRIC RATING
222nd/ 347
METRIC RANK
11.9%
FEMALE DISABILITY
91.6/ 100
METRIC RATING
140th/ 347
METRIC RANK
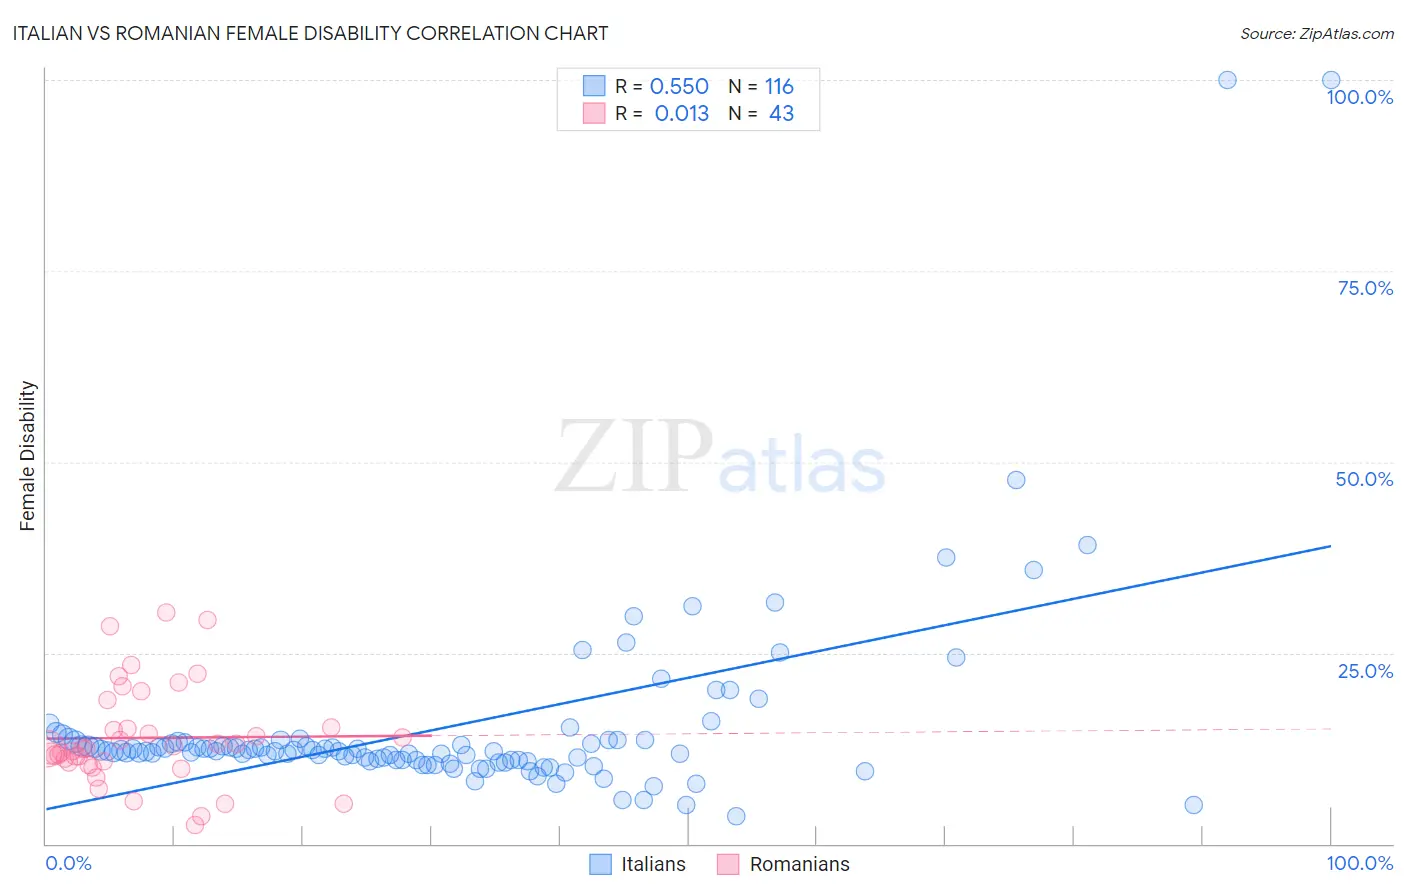
Italian vs Romanian Female Disability Correlation Chart
The statistical analysis conducted on geographies consisting of 574,730,286 people shows a substantial positive correlation between the proportion of Italians and percentage of females with a disability in the United States with a correlation coefficient (R) of 0.550 and weighted average of 12.4%. Similarly, the statistical analysis conducted on geographies consisting of 377,864,949 people shows no correlation between the proportion of Romanians and percentage of females with a disability in the United States with a correlation coefficient (R) of 0.013 and weighted average of 11.9%, a difference of 4.3%.
Female Disability Correlation Summary
| Measurement | Italian | Romanian |
| Minimum | 3.6% | 2.4% |
| Maximum | 100.0% | 30.3% |
| Range | 96.4% | 27.9% |
| Mean | 15.2% | 13.9% |
| Median | 12.2% | 12.5% |
| Interquartile 25% (IQ1) | 11.0% | 10.7% |
| Interquartile 75% (IQ3) | 13.4% | 15.2% |
| Interquartile Range (IQR) | 2.4% | 4.4% |
| Standard Deviation (Sample) | 13.2% | 6.5% |
| Standard Deviation (Population) | 13.1% | 6.4% |
Similar Demographics by Female Disability
Demographics Similar to Italians by Female Disability
In terms of female disability, the demographic groups most similar to Italians are Native Hawaiian (12.4%, a difference of 0.010%), Bahamian (12.4%, a difference of 0.040%), European (12.4%, a difference of 0.13%), Guamanian/Chamorro (12.5%, a difference of 0.13%), and Belizean (12.5%, a difference of 0.14%).
| Demographics | Rating | Rank | Female Disability |
| Samoans | 13.4 /100 | #215 | Poor 12.4% |
| Immigrants | Burma/Myanmar | 13.3 /100 | #216 | Poor 12.4% |
| British | 12.7 /100 | #217 | Poor 12.4% |
| Immigrants | Bahamas | 12.5 /100 | #218 | Poor 12.4% |
| Europeans | 12.1 /100 | #219 | Poor 12.4% |
| Bahamians | 11.1 /100 | #220 | Poor 12.4% |
| Native Hawaiians | 10.8 /100 | #221 | Poor 12.4% |
| Italians | 10.7 /100 | #222 | Poor 12.4% |
| Guamanians/Chamorros | 9.5 /100 | #223 | Tragic 12.5% |
| Belizeans | 9.3 /100 | #224 | Tragic 12.5% |
| Poles | 8.4 /100 | #225 | Tragic 12.5% |
| Hispanics or Latinos | 8.0 /100 | #226 | Tragic 12.5% |
| Assyrians/Chaldeans/Syriacs | 8.0 /100 | #227 | Tragic 12.5% |
| Immigrants | Cambodia | 7.8 /100 | #228 | Tragic 12.5% |
| Hungarians | 7.2 /100 | #229 | Tragic 12.5% |
Demographics Similar to Romanians by Female Disability
In terms of female disability, the demographic groups most similar to Romanians are Immigrants from Ecuador (11.9%, a difference of 0.020%), Immigrants from Hungary (11.9%, a difference of 0.16%), Immigrants from Africa (11.9%, a difference of 0.19%), Immigrants from Sudan (11.9%, a difference of 0.23%), and Ecuadorian (11.9%, a difference of 0.25%).
| Demographics | Rating | Rank | Female Disability |
| Kenyans | 94.5 /100 | #133 | Exceptional 11.9% |
| Immigrants | Nicaragua | 94.5 /100 | #134 | Exceptional 11.9% |
| Central Americans | 94.2 /100 | #135 | Exceptional 11.9% |
| Ugandans | 94.0 /100 | #136 | Exceptional 11.9% |
| Immigrants | Norway | 93.8 /100 | #137 | Exceptional 11.9% |
| Ecuadorians | 93.4 /100 | #138 | Exceptional 11.9% |
| Immigrants | Hungary | 92.8 /100 | #139 | Exceptional 11.9% |
| Romanians | 91.6 /100 | #140 | Exceptional 11.9% |
| Immigrants | Ecuador | 91.5 /100 | #141 | Exceptional 11.9% |
| Immigrants | Africa | 90.0 /100 | #142 | Excellent 11.9% |
| Immigrants | Sudan | 89.6 /100 | #143 | Excellent 11.9% |
| Immigrants | Austria | 87.9 /100 | #144 | Excellent 12.0% |
| Estonians | 87.8 /100 | #145 | Excellent 12.0% |
| Pakistanis | 84.6 /100 | #146 | Excellent 12.0% |
| Nigerians | 84.0 /100 | #147 | Excellent 12.0% |