Italian vs Immigrants from Zimbabwe Female Disability
COMPARE
Italian
Immigrants from Zimbabwe
Female Disability
Female Disability Comparison
Italians
Immigrants from Zimbabwe
12.4%
FEMALE DISABILITY
10.7/ 100
METRIC RATING
222nd/ 347
METRIC RANK
11.6%
FEMALE DISABILITY
99.5/ 100
METRIC RATING
91st/ 347
METRIC RANK
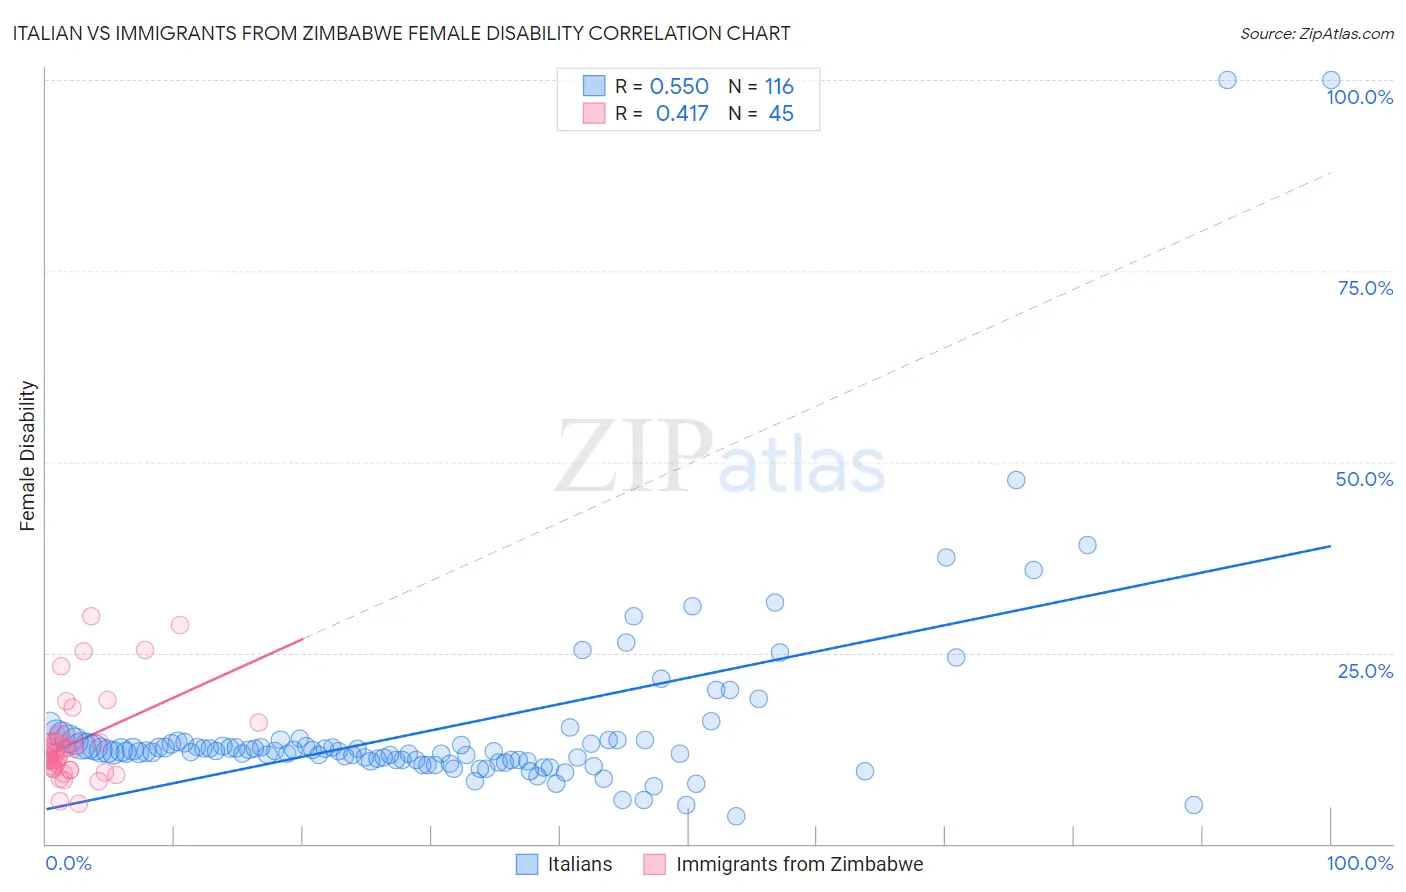
Italian vs Immigrants from Zimbabwe Female Disability Correlation Chart
The statistical analysis conducted on geographies consisting of 574,730,286 people shows a substantial positive correlation between the proportion of Italians and percentage of females with a disability in the United States with a correlation coefficient (R) of 0.550 and weighted average of 12.4%. Similarly, the statistical analysis conducted on geographies consisting of 117,810,271 people shows a moderate positive correlation between the proportion of Immigrants from Zimbabwe and percentage of females with a disability in the United States with a correlation coefficient (R) of 0.417 and weighted average of 11.6%, a difference of 7.3%.
Female Disability Correlation Summary
| Measurement | Italian | Immigrants from Zimbabwe |
| Minimum | 3.6% | 5.2% |
| Maximum | 100.0% | 29.8% |
| Range | 96.4% | 24.6% |
| Mean | 15.2% | 13.2% |
| Median | 12.2% | 11.9% |
| Interquartile 25% (IQ1) | 11.0% | 9.8% |
| Interquartile 75% (IQ3) | 13.4% | 13.9% |
| Interquartile Range (IQR) | 2.4% | 4.0% |
| Standard Deviation (Sample) | 13.2% | 5.5% |
| Standard Deviation (Population) | 13.1% | 5.5% |
Similar Demographics by Female Disability
Demographics Similar to Italians by Female Disability
In terms of female disability, the demographic groups most similar to Italians are Native Hawaiian (12.4%, a difference of 0.010%), Bahamian (12.4%, a difference of 0.040%), European (12.4%, a difference of 0.13%), Guamanian/Chamorro (12.5%, a difference of 0.13%), and Belizean (12.5%, a difference of 0.14%).
| Demographics | Rating | Rank | Female Disability |
| Samoans | 13.4 /100 | #215 | Poor 12.4% |
| Immigrants | Burma/Myanmar | 13.3 /100 | #216 | Poor 12.4% |
| British | 12.7 /100 | #217 | Poor 12.4% |
| Immigrants | Bahamas | 12.5 /100 | #218 | Poor 12.4% |
| Europeans | 12.1 /100 | #219 | Poor 12.4% |
| Bahamians | 11.1 /100 | #220 | Poor 12.4% |
| Native Hawaiians | 10.8 /100 | #221 | Poor 12.4% |
| Italians | 10.7 /100 | #222 | Poor 12.4% |
| Guamanians/Chamorros | 9.5 /100 | #223 | Tragic 12.5% |
| Belizeans | 9.3 /100 | #224 | Tragic 12.5% |
| Poles | 8.4 /100 | #225 | Tragic 12.5% |
| Hispanics or Latinos | 8.0 /100 | #226 | Tragic 12.5% |
| Assyrians/Chaldeans/Syriacs | 8.0 /100 | #227 | Tragic 12.5% |
| Immigrants | Cambodia | 7.8 /100 | #228 | Tragic 12.5% |
| Hungarians | 7.2 /100 | #229 | Tragic 12.5% |
Demographics Similar to Immigrants from Zimbabwe by Female Disability
In terms of female disability, the demographic groups most similar to Immigrants from Zimbabwe are Vietnamese (11.6%, a difference of 0.010%), Immigrants from Romania (11.6%, a difference of 0.010%), Immigrants from Czechoslovakia (11.6%, a difference of 0.010%), Immigrants from Denmark (11.6%, a difference of 0.11%), and Yup'ik (11.6%, a difference of 0.11%).
| Demographics | Rating | Rank | Female Disability |
| Immigrants | Poland | 99.6 /100 | #84 | Exceptional 11.6% |
| Palestinians | 99.6 /100 | #85 | Exceptional 11.6% |
| Immigrants | Cameroon | 99.6 /100 | #86 | Exceptional 11.6% |
| Immigrants | Denmark | 99.5 /100 | #87 | Exceptional 11.6% |
| Yup'ik | 99.5 /100 | #88 | Exceptional 11.6% |
| Vietnamese | 99.5 /100 | #89 | Exceptional 11.6% |
| Immigrants | Romania | 99.5 /100 | #90 | Exceptional 11.6% |
| Immigrants | Zimbabwe | 99.5 /100 | #91 | Exceptional 11.6% |
| Immigrants | Czechoslovakia | 99.5 /100 | #92 | Exceptional 11.6% |
| Immigrants | Sierra Leone | 99.4 /100 | #93 | Exceptional 11.6% |
| Immigrants | Brazil | 99.4 /100 | #94 | Exceptional 11.6% |
| Immigrants | Northern Europe | 99.4 /100 | #95 | Exceptional 11.6% |
| Immigrants | Russia | 99.0 /100 | #96 | Exceptional 11.7% |
| Koreans | 99.0 /100 | #97 | Exceptional 11.7% |
| Uruguayans | 98.8 /100 | #98 | Exceptional 11.7% |