Hopi vs Immigrants from Dominica Male Disability
COMPARE
Hopi
Immigrants from Dominica
Male Disability
Male Disability Comparison
Hopi
Immigrants from Dominica
12.5%
MALE DISABILITY
0.0/ 100
METRIC RATING
274th/ 347
METRIC RANK
11.7%
MALE DISABILITY
4.6/ 100
METRIC RATING
217th/ 347
METRIC RANK
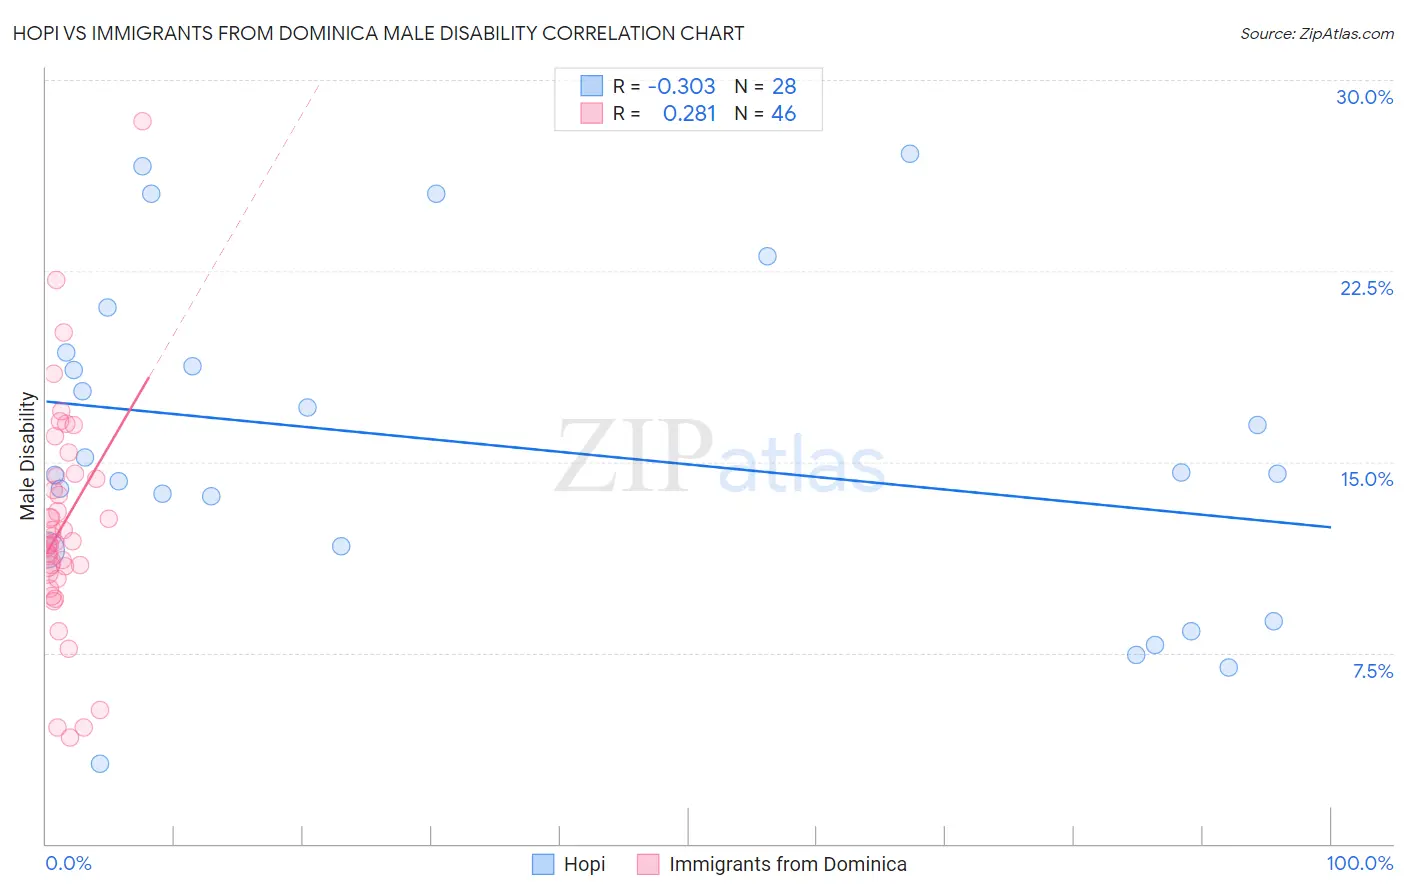
Hopi vs Immigrants from Dominica Male Disability Correlation Chart
The statistical analysis conducted on geographies consisting of 74,731,740 people shows a mild negative correlation between the proportion of Hopi and percentage of males with a disability in the United States with a correlation coefficient (R) of -0.303 and weighted average of 12.5%. Similarly, the statistical analysis conducted on geographies consisting of 83,789,752 people shows a weak positive correlation between the proportion of Immigrants from Dominica and percentage of males with a disability in the United States with a correlation coefficient (R) of 0.281 and weighted average of 11.7%, a difference of 7.1%.
Male Disability Correlation Summary
| Measurement | Hopi | Immigrants from Dominica |
| Minimum | 3.2% | 4.2% |
| Maximum | 27.1% | 28.4% |
| Range | 24.0% | 24.2% |
| Mean | 15.6% | 12.5% |
| Median | 14.5% | 11.9% |
| Interquartile 25% (IQ1) | 11.6% | 10.6% |
| Interquartile 75% (IQ3) | 19.0% | 14.4% |
| Interquartile Range (IQR) | 7.4% | 3.8% |
| Standard Deviation (Sample) | 6.3% | 4.4% |
| Standard Deviation (Population) | 6.2% | 4.4% |
Similar Demographics by Male Disability
Demographics Similar to Hopi by Male Disability
In terms of male disability, the demographic groups most similar to Hopi are Native Hawaiian (12.5%, a difference of 0.33%), Fijian (12.6%, a difference of 0.35%), Hmong (12.5%, a difference of 0.39%), African (12.6%, a difference of 0.40%), and Finnish (12.6%, a difference of 0.72%).
| Demographics | Rating | Rank | Male Disability |
| Immigrants | Germany | 0.1 /100 | #267 | Tragic 12.3% |
| Portuguese | 0.1 /100 | #268 | Tragic 12.3% |
| Czechoslovakians | 0.1 /100 | #269 | Tragic 12.3% |
| Spaniards | 0.1 /100 | #270 | Tragic 12.3% |
| Scandinavians | 0.1 /100 | #271 | Tragic 12.3% |
| Hmong | 0.0 /100 | #272 | Tragic 12.5% |
| Native Hawaiians | 0.0 /100 | #273 | Tragic 12.5% |
| Hopi | 0.0 /100 | #274 | Tragic 12.5% |
| Fijians | 0.0 /100 | #275 | Tragic 12.6% |
| Africans | 0.0 /100 | #276 | Tragic 12.6% |
| Finns | 0.0 /100 | #277 | Tragic 12.6% |
| Central American Indians | 0.0 /100 | #278 | Tragic 12.7% |
| Slovaks | 0.0 /100 | #279 | Tragic 12.7% |
| Dutch | 0.0 /100 | #280 | Tragic 12.7% |
| Sioux | 0.0 /100 | #281 | Tragic 12.7% |
Demographics Similar to Immigrants from Dominica by Male Disability
In terms of male disability, the demographic groups most similar to Immigrants from Dominica are Immigrants from Dominican Republic (11.7%, a difference of 0.070%), Immigrants from England (11.7%, a difference of 0.21%), Panamanian (11.7%, a difference of 0.27%), Immigrants from Western Europe (11.7%, a difference of 0.28%), and Immigrants from Congo (11.7%, a difference of 0.29%).
| Demographics | Rating | Rank | Male Disability |
| Ute | 9.4 /100 | #210 | Tragic 11.6% |
| Immigrants | Thailand | 8.4 /100 | #211 | Tragic 11.6% |
| Immigrants | Scotland | 8.2 /100 | #212 | Tragic 11.6% |
| Mexican American Indians | 7.8 /100 | #213 | Tragic 11.6% |
| Lithuanians | 6.6 /100 | #214 | Tragic 11.6% |
| Indonesians | 5.9 /100 | #215 | Tragic 11.6% |
| Immigrants | Dominican Republic | 4.9 /100 | #216 | Tragic 11.7% |
| Immigrants | Dominica | 4.6 /100 | #217 | Tragic 11.7% |
| Immigrants | England | 4.0 /100 | #218 | Tragic 11.7% |
| Panamanians | 3.8 /100 | #219 | Tragic 11.7% |
| Immigrants | Western Europe | 3.8 /100 | #220 | Tragic 11.7% |
| Immigrants | Congo | 3.7 /100 | #221 | Tragic 11.7% |
| Alsatians | 3.3 /100 | #222 | Tragic 11.7% |
| Immigrants | Bahamas | 3.2 /100 | #223 | Tragic 11.7% |
| Japanese | 3.1 /100 | #224 | Tragic 11.7% |