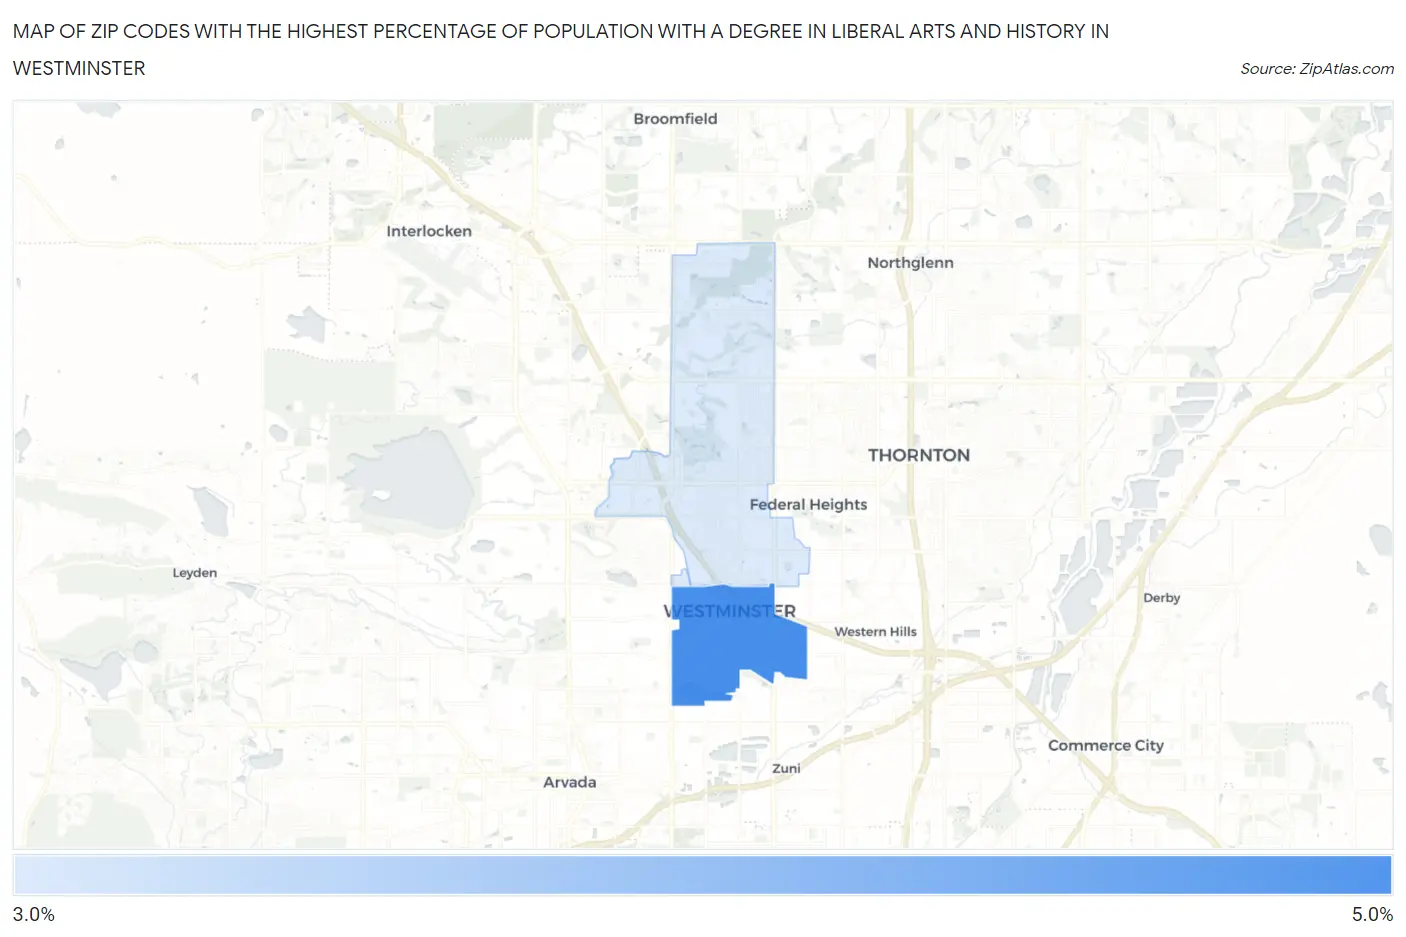
Zip Codes with the Highest Percentage of Population with a Degree in Liberal Arts and History in Westminster, CO
RELATED REPORTS & OPTIONS
Liberal Arts and History
Westminster
Compare Zip Codes
Map of Zip Codes with the Highest Percentage of Population with a Degree in Liberal Arts and History in Westminster
3.5%
4.7%
Zip Codes with the Highest Percentage of Population with a Degree in Liberal Arts and History in Westminster, CO
| Zip Code | % Graduates | vs State | vs National | |
| 1. | 80030 | 4.7% | 4.6%(+0.092)#172 | 4.9%(-0.150)#12,247 |
| 2. | 80031 | 3.5% | 4.6%(-1.12)#271 | 4.9%(-1.36)#16,555 |
1
Common Questions
What are the Top Zip Codes with the Highest Percentage of Population with a Degree in Liberal Arts and History in Westminster, CO?
Top Zip Codes with the Highest Percentage of Population with a Degree in Liberal Arts and History in Westminster, CO are:
What zip code has the Highest Percentage of Population with a Degree in Liberal Arts and History in Westminster, CO?
80030 has the Highest Percentage of Population with a Degree in Liberal Arts and History in Westminster, CO with 4.7%.
What is the Percentage of Population with a Degree in Liberal Arts and History in Westminster, CO?
Percentage of Population with a Degree in Liberal Arts and History in Westminster is 3.5%.
What is the Percentage of Population with a Degree in Liberal Arts and History in Colorado?
Percentage of Population with a Degree in Liberal Arts and History in Colorado is 4.6%.
What is the Percentage of Population with a Degree in Liberal Arts and History in the United States?
Percentage of Population with a Degree in Liberal Arts and History in the United States is 4.9%.