Zip Codes with the Highest Percentage of Population with a Degree in Liberal Arts and History in Montrose, CO
RELATED REPORTS & OPTIONS
Liberal Arts and History
Montrose
Compare Zip Codes
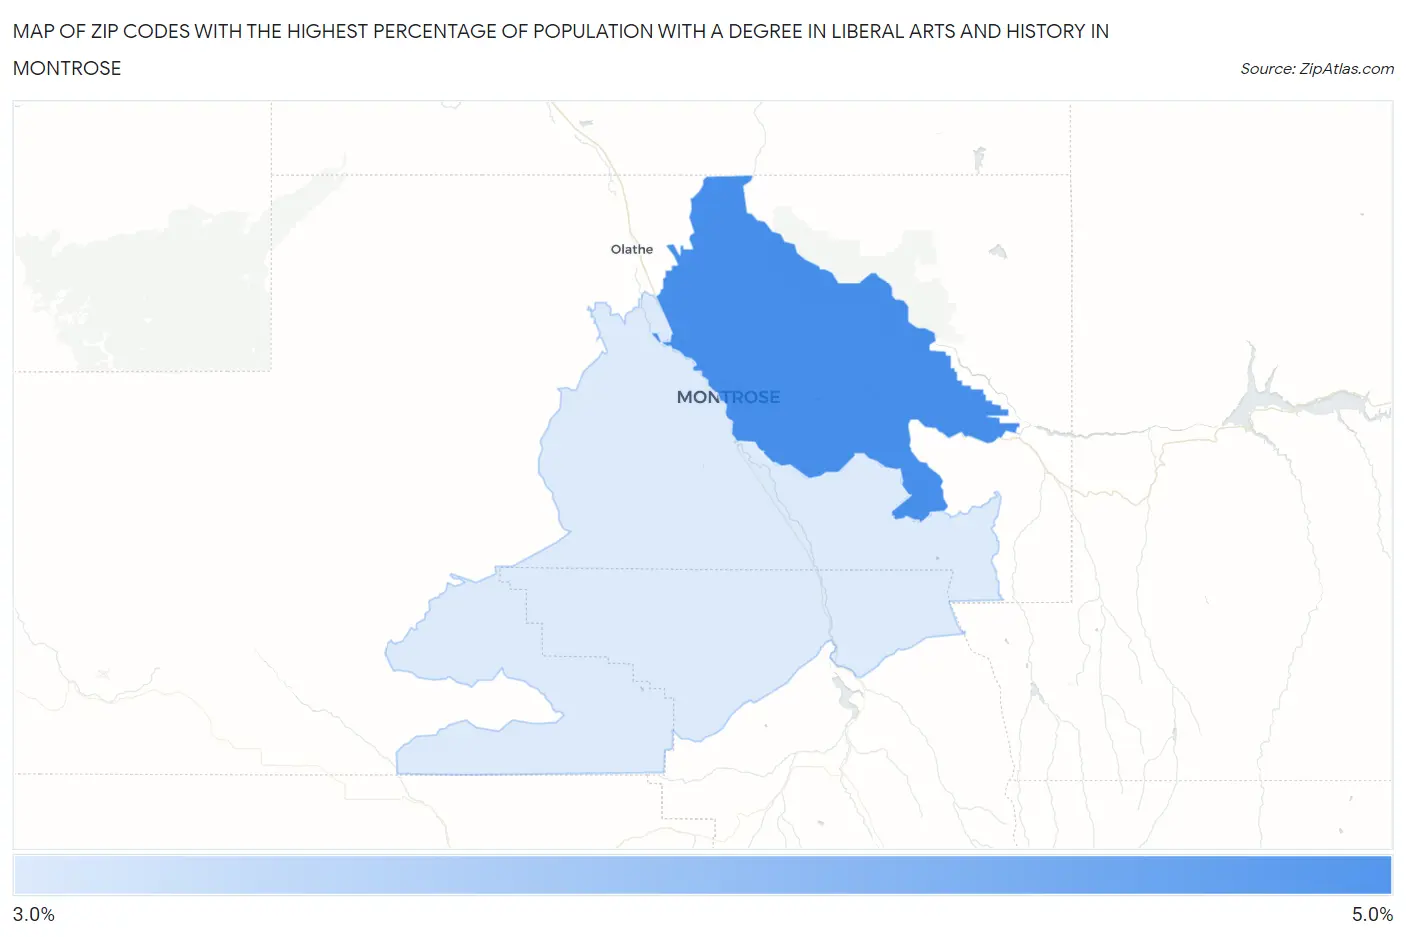
Map of Zip Codes with the Highest Percentage of Population with a Degree in Liberal Arts and History in Montrose
3.8%
4.5%
Zip Codes with the Highest Percentage of Population with a Degree in Liberal Arts and History in Montrose, CO
| Zip Code | % Graduates | vs State | vs National | |
| 1. | 81401 | 4.5% | 4.6%(-0.171)#187 | 4.9%(-0.412)#13,084 |
| 2. | 81403 | 3.8% | 4.6%(-0.861)#250 | 4.9%(-1.10)#15,635 |
1
Common Questions
What are the Top Zip Codes with the Highest Percentage of Population with a Degree in Liberal Arts and History in Montrose, CO?
Top Zip Codes with the Highest Percentage of Population with a Degree in Liberal Arts and History in Montrose, CO are:
What zip code has the Highest Percentage of Population with a Degree in Liberal Arts and History in Montrose, CO?
81401 has the Highest Percentage of Population with a Degree in Liberal Arts and History in Montrose, CO with 4.5%.
What is the Percentage of Population with a Degree in Liberal Arts and History in Montrose, CO?
Percentage of Population with a Degree in Liberal Arts and History in Montrose is 5.1%.
What is the Percentage of Population with a Degree in Liberal Arts and History in Colorado?
Percentage of Population with a Degree in Liberal Arts and History in Colorado is 4.6%.
What is the Percentage of Population with a Degree in Liberal Arts and History in the United States?
Percentage of Population with a Degree in Liberal Arts and History in the United States is 4.9%.