Zip Codes with the Highest Percentage of Population with a Degree in Liberal Arts and History in Pueblo, CO
RELATED REPORTS & OPTIONS
Liberal Arts and History
Pueblo
Compare Zip Codes
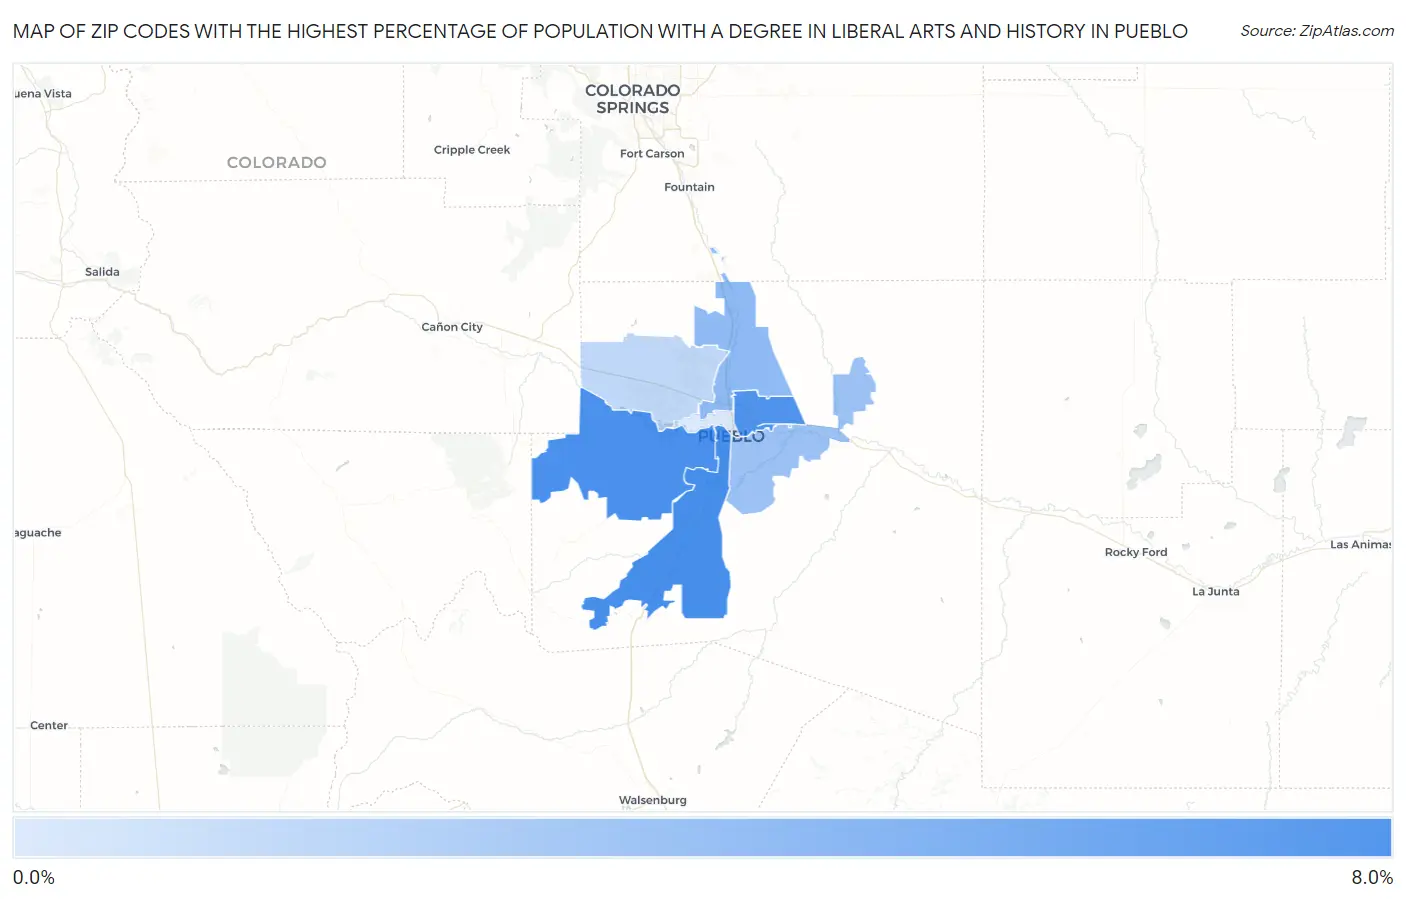
Map of Zip Codes with the Highest Percentage of Population with a Degree in Liberal Arts and History in Pueblo
1.1%
6.8%
Zip Codes with the Highest Percentage of Population with a Degree in Liberal Arts and History in Pueblo, CO
| Zip Code | % Graduates | vs State | vs National | |
| 1. | 81004 | 6.8% | 4.6%(+2.17)#72 | 4.9%(+1.93)#6,737 |
| 2. | 81005 | 6.8% | 4.6%(+2.13)#74 | 4.9%(+1.89)#6,812 |
| 3. | 81001 | 6.5% | 4.6%(+1.89)#86 | 4.9%(+1.65)#7,291 |
| 4. | 81008 | 4.1% | 4.6%(-0.559)#222 | 4.9%(-0.800)#14,504 |
| 5. | 81006 | 3.7% | 4.6%(-0.970)#257 | 4.9%(-1.21)#16,031 |
| 6. | 81007 | 2.2% | 4.6%(-2.38)#326 | 4.9%(-2.62)#20,700 |
| 7. | 81003 | 1.1% | 4.6%(-3.49)#362 | 4.9%(-3.73)#23,129 |
1
Common Questions
What are the Top 5 Zip Codes with the Highest Percentage of Population with a Degree in Liberal Arts and History in Pueblo, CO?
Top 5 Zip Codes with the Highest Percentage of Population with a Degree in Liberal Arts and History in Pueblo, CO are:
What zip code has the Highest Percentage of Population with a Degree in Liberal Arts and History in Pueblo, CO?
81004 has the Highest Percentage of Population with a Degree in Liberal Arts and History in Pueblo, CO with 6.8%.
What is the Percentage of Population with a Degree in Liberal Arts and History in Pueblo, CO?
Percentage of Population with a Degree in Liberal Arts and History in Pueblo is 5.8%.
What is the Percentage of Population with a Degree in Liberal Arts and History in Colorado?
Percentage of Population with a Degree in Liberal Arts and History in Colorado is 4.6%.
What is the Percentage of Population with a Degree in Liberal Arts and History in the United States?
Percentage of Population with a Degree in Liberal Arts and History in the United States is 4.9%.