Zip Codes with the Highest Percentage of Population with a Degree in Liberal Arts and History in Longmont, CO
RELATED REPORTS & OPTIONS
Liberal Arts and History
Longmont
Compare Zip Codes
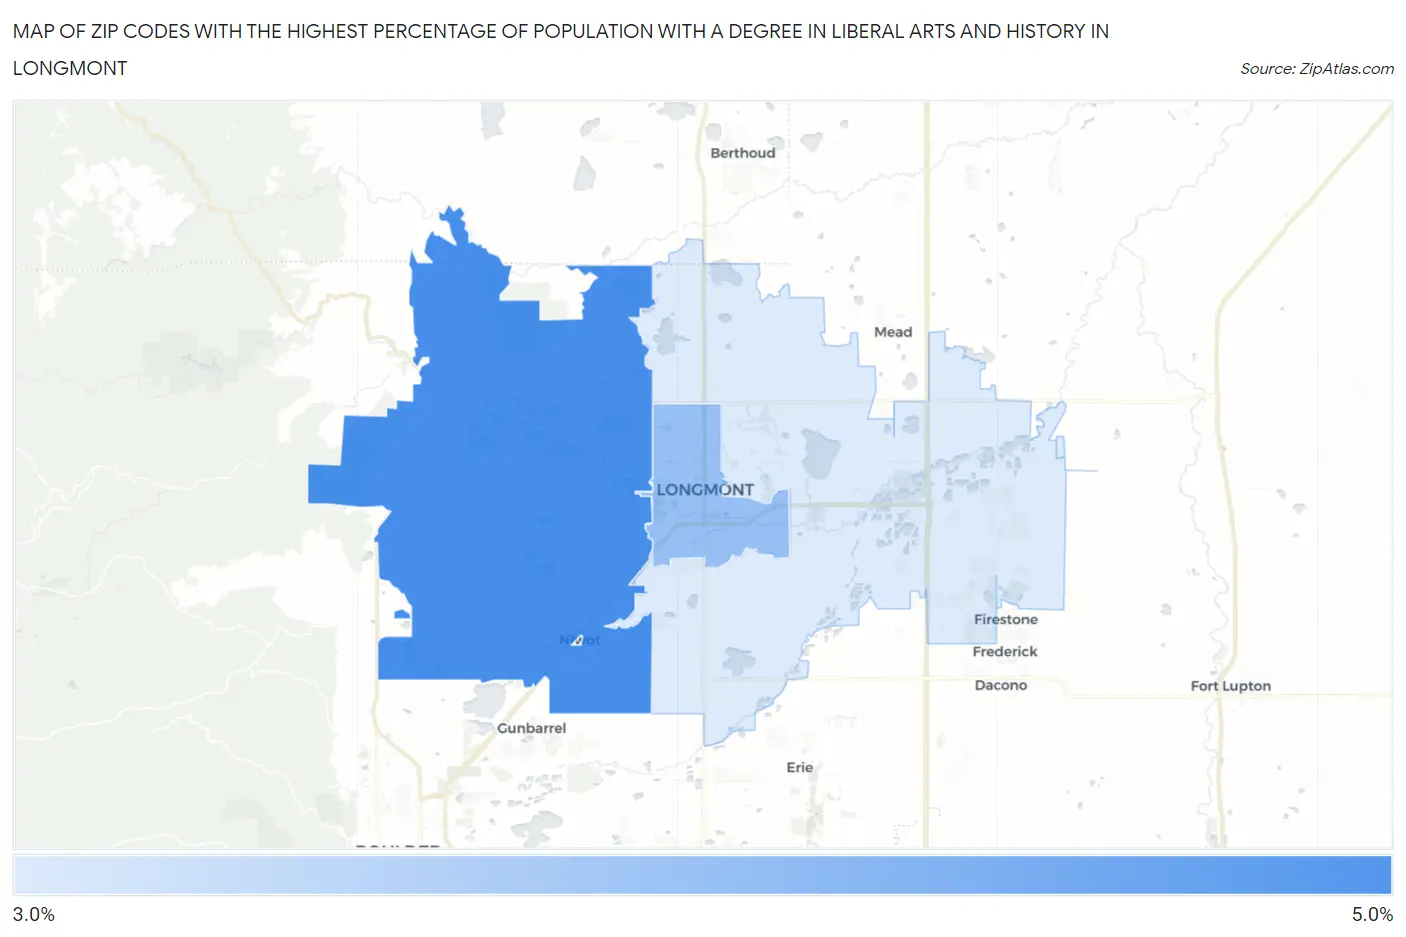
Map of Zip Codes with the Highest Percentage of Population with a Degree in Liberal Arts and History in Longmont
3.9%
5.0%
Zip Codes with the Highest Percentage of Population with a Degree in Liberal Arts and History in Longmont, CO
| Zip Code | % Graduates | vs State | vs National | |
| 1. | 80503 | 5.0% | 4.6%(+0.327)#154 | 4.9%(+0.086)#11,473 |
| 2. | 80501 | 4.4% | 4.6%(-0.231)#194 | 4.9%(-0.472)#13,294 |
| 3. | 80504 | 3.9% | 4.6%(-0.717)#241 | 4.9%(-0.958)#15,127 |
1
Common Questions
What are the Top Zip Codes with the Highest Percentage of Population with a Degree in Liberal Arts and History in Longmont, CO?
Top Zip Codes with the Highest Percentage of Population with a Degree in Liberal Arts and History in Longmont, CO are:
What zip code has the Highest Percentage of Population with a Degree in Liberal Arts and History in Longmont, CO?
80503 has the Highest Percentage of Population with a Degree in Liberal Arts and History in Longmont, CO with 5.0%.
What is the Percentage of Population with a Degree in Liberal Arts and History in Longmont, CO?
Percentage of Population with a Degree in Liberal Arts and History in Longmont is 4.3%.
What is the Percentage of Population with a Degree in Liberal Arts and History in Colorado?
Percentage of Population with a Degree in Liberal Arts and History in Colorado is 4.6%.
What is the Percentage of Population with a Degree in Liberal Arts and History in the United States?
Percentage of Population with a Degree in Liberal Arts and History in the United States is 4.9%.