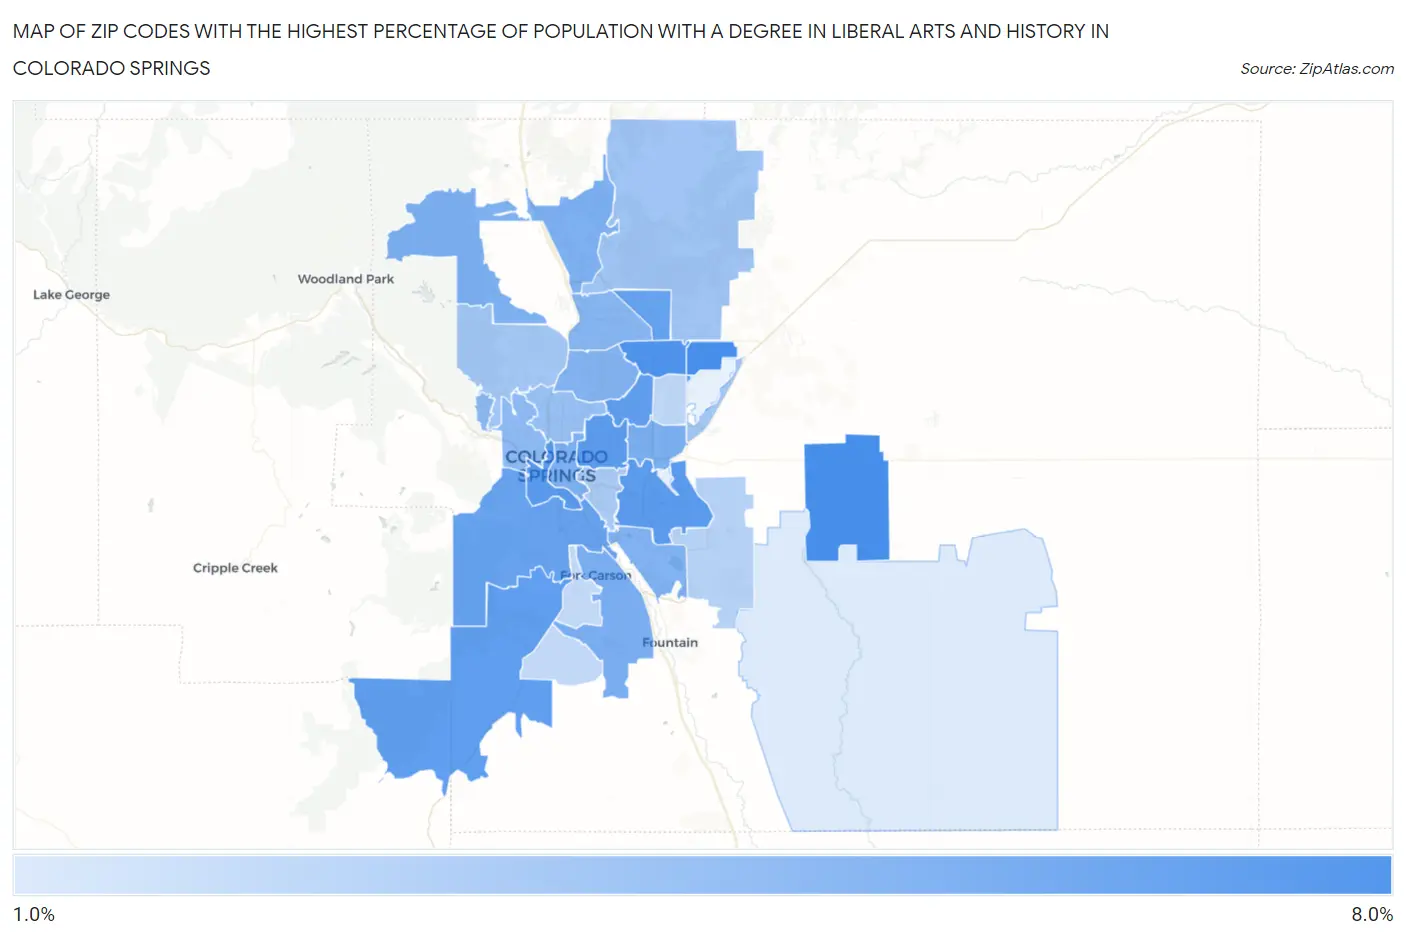
Zip Codes with the Highest Percentage of Population with a Degree in Liberal Arts and History in Colorado Springs, CO
RELATED REPORTS & OPTIONS
Liberal Arts and History
Colorado Springs
Compare Zip Codes
Map of Zip Codes with the Highest Percentage of Population with a Degree in Liberal Arts and History in Colorado Springs
2.0%
7.5%
Zip Codes with the Highest Percentage of Population with a Degree in Liberal Arts and History in Colorado Springs, CO
| Zip Code | % Graduates | vs State | vs National | |
| 1. | 80927 | 7.5% | 4.6%(+2.88)#52 | 4.9%(+2.64)#5,568 |
| 2. | 80930 | 7.5% | 4.6%(+2.88)#53 | 4.9%(+2.64)#5,573 |
| 3. | 80923 | 7.2% | 4.6%(+2.61)#59 | 4.9%(+2.37)#5,979 |
| 4. | 80905 | 6.9% | 4.6%(+2.29)#66 | 4.9%(+2.05)#6,519 |
| 5. | 80909 | 6.8% | 4.6%(+2.20)#71 | 4.9%(+1.96)#6,681 |
| 6. | 80916 | 6.7% | 4.6%(+2.07)#77 | 4.9%(+1.83)#6,936 |
| 7. | 80917 | 6.6% | 4.6%(+1.95)#82 | 4.9%(+1.71)#7,184 |
| 8. | 80926 | 6.5% | 4.6%(+1.91)#85 | 4.9%(+1.66)#7,267 |
| 9. | 80924 | 6.4% | 4.6%(+1.79)#89 | 4.9%(+1.55)#7,528 |
| 10. | 80906 | 6.3% | 4.6%(+1.65)#99 | 4.9%(+1.41)#7,843 |
| 11. | 80913 | 5.6% | 4.6%(+1.02)#122 | 4.9%(+0.778)#9,431 |
| 12. | 80915 | 5.5% | 4.6%(+0.882)#129 | 4.9%(+0.641)#9,839 |
| 13. | 80903 | 5.5% | 4.6%(+0.820)#131 | 4.9%(+0.579)#9,998 |
| 14. | 80921 | 5.4% | 4.6%(+0.776)#133 | 4.9%(+0.535)#10,114 |
| 15. | 80911 | 5.4% | 4.6%(+0.745)#134 | 4.9%(+0.503)#10,196 |
| 16. | 80918 | 5.3% | 4.6%(+0.631)#140 | 4.9%(+0.390)#10,564 |
| 17. | 80920 | 5.1% | 4.6%(+0.426)#150 | 4.9%(+0.185)#11,178 |
| 18. | 80904 | 4.9% | 4.6%(+0.244)#159 | 4.9%(+0.003)#11,729 |
| 19. | 80907 | 4.5% | 4.6%(-0.100)#181 | 4.9%(-0.341)#12,882 |
| 20. | 80908 | 4.1% | 4.6%(-0.495)#213 | 4.9%(-0.736)#14,260 |
| 21. | 80919 | 4.1% | 4.6%(-0.519)#217 | 4.9%(-0.761)#14,359 |
| 22. | 80951 | 4.1% | 4.6%(-0.551)#219 | 4.9%(-0.792)#14,476 |
| 23. | 80910 | 3.8% | 4.6%(-0.832)#247 | 4.9%(-1.07)#15,534 |
| 24. | 80925 | 3.4% | 4.6%(-1.19)#277 | 4.9%(-1.43)#16,853 |
| 25. | 80922 | 3.1% | 4.6%(-1.56)#295 | 4.9%(-1.80)#18,084 |
| 26. | 80902 | 3.0% | 4.6%(-1.61)#299 | 4.9%(-1.85)#18,293 |
| 27. | 80928 | 2.0% | 4.6%(-2.64)#338 | 4.9%(-2.89)#21,408 |
1
Common Questions
What are the Top 10 Zip Codes with the Highest Percentage of Population with a Degree in Liberal Arts and History in Colorado Springs, CO?
Top 10 Zip Codes with the Highest Percentage of Population with a Degree in Liberal Arts and History in Colorado Springs, CO are:
What zip code has the Highest Percentage of Population with a Degree in Liberal Arts and History in Colorado Springs, CO?
80927 has the Highest Percentage of Population with a Degree in Liberal Arts and History in Colorado Springs, CO with 7.5%.
What is the Percentage of Population with a Degree in Liberal Arts and History in Colorado Springs, CO?
Percentage of Population with a Degree in Liberal Arts and History in Colorado Springs is 5.4%.
What is the Percentage of Population with a Degree in Liberal Arts and History in Colorado?
Percentage of Population with a Degree in Liberal Arts and History in Colorado is 4.6%.
What is the Percentage of Population with a Degree in Liberal Arts and History in the United States?
Percentage of Population with a Degree in Liberal Arts and History in the United States is 4.9%.