Zip Codes with the Highest Percentage of Population Employed in Professional & Scientific Services in Whittier, CA
RELATED REPORTS & OPTIONS
Professional & Scientific Services
Whittier
Compare Zip Codes
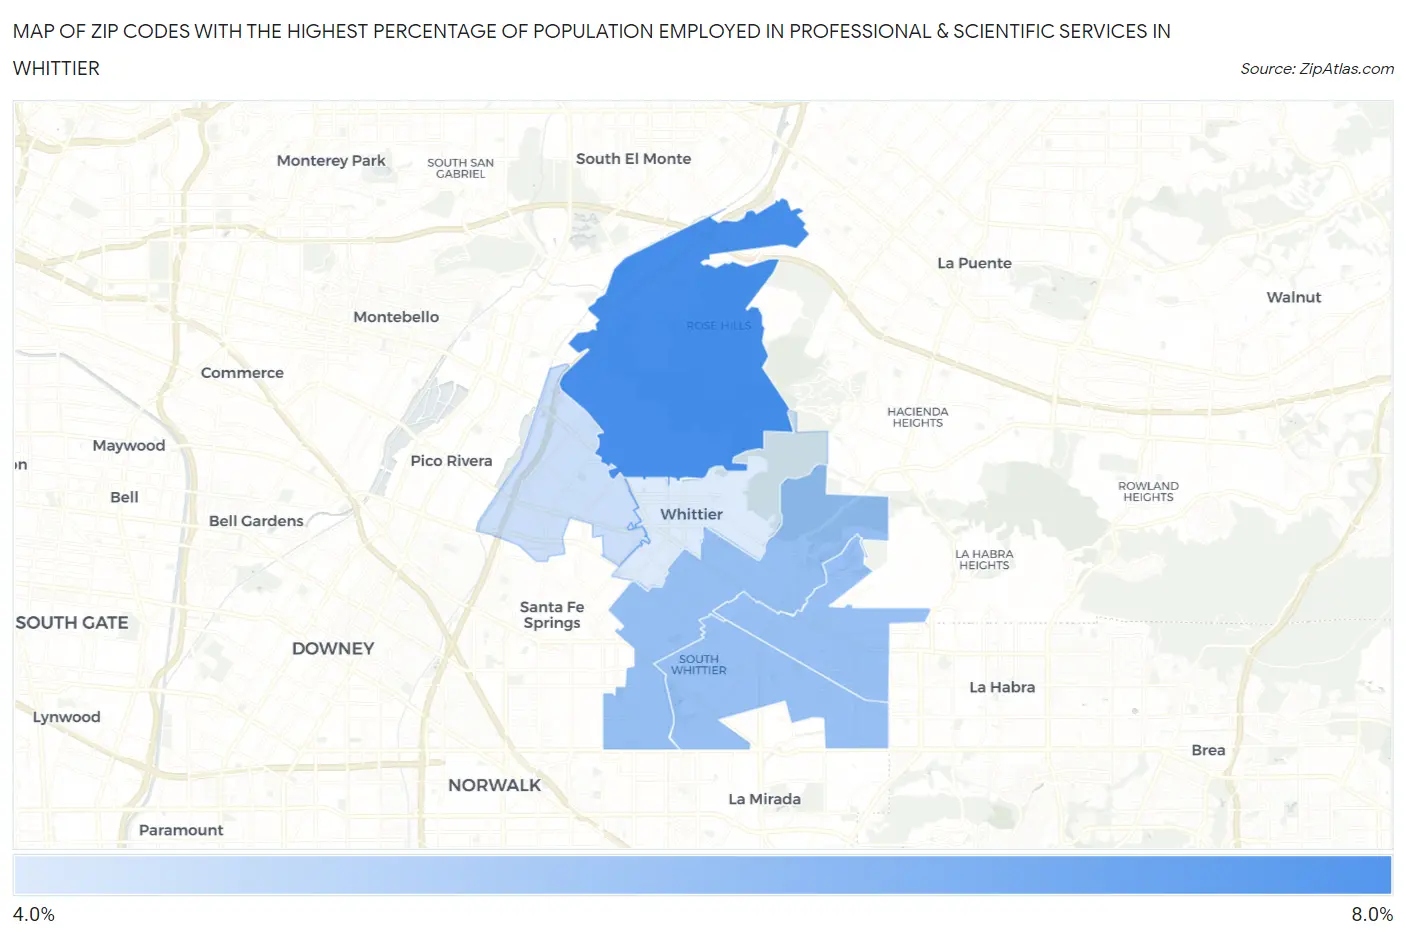
Map of Zip Codes with the Highest Percentage of Population Employed in Professional & Scientific Services in Whittier
4.3%
6.9%
Zip Codes with the Highest Percentage of Population Employed in Professional & Scientific Services in Whittier, CA
| Zip Code | % Employed | vs State | vs National | |
| 1. | 90601 | 6.9% | 9.4%(-2.50)#799 | 7.8%(-0.915)#8,285 |
| 2. | 90605 | 5.6% | 9.4%(-3.88)#944 | 7.8%(-2.29)#10,944 |
| 3. | 90604 | 5.5% | 9.4%(-3.90)#952 | 7.8%(-2.31)#11,003 |
| 4. | 90603 | 5.5% | 9.4%(-3.92)#956 | 7.8%(-2.33)#11,055 |
| 5. | 90606 | 4.7% | 9.4%(-4.77)#1,059 | 7.8%(-3.18)#13,181 |
| 6. | 90602 | 4.3% | 9.4%(-5.09)#1,103 | 7.8%(-3.51)#14,106 |
1
Common Questions
What are the Top 5 Zip Codes with the Highest Percentage of Population Employed in Professional & Scientific Services in Whittier, CA?
Top 5 Zip Codes with the Highest Percentage of Population Employed in Professional & Scientific Services in Whittier, CA are:
What zip code has the Highest Percentage of Population Employed in Professional & Scientific Services in Whittier, CA?
90601 has the Highest Percentage of Population Employed in Professional & Scientific Services in Whittier, CA with 6.9%.
What is the Percentage of Population Employed in Professional & Scientific Services in Whittier, CA?
Percentage of Population Employed in Professional & Scientific Services in Whittier is 5.8%.
What is the Percentage of Population Employed in Professional & Scientific Services in California?
Percentage of Population Employed in Professional & Scientific Services in California is 9.4%.
What is the Percentage of Population Employed in Professional & Scientific Services in the United States?
Percentage of Population Employed in Professional & Scientific Services in the United States is 7.8%.