Zip Codes with the Highest Percentage of Population Employed in Administrative & Support Services in San Leandro, CA
RELATED REPORTS & OPTIONS
Administrative & Support Services
San Leandro
Compare Zip Codes
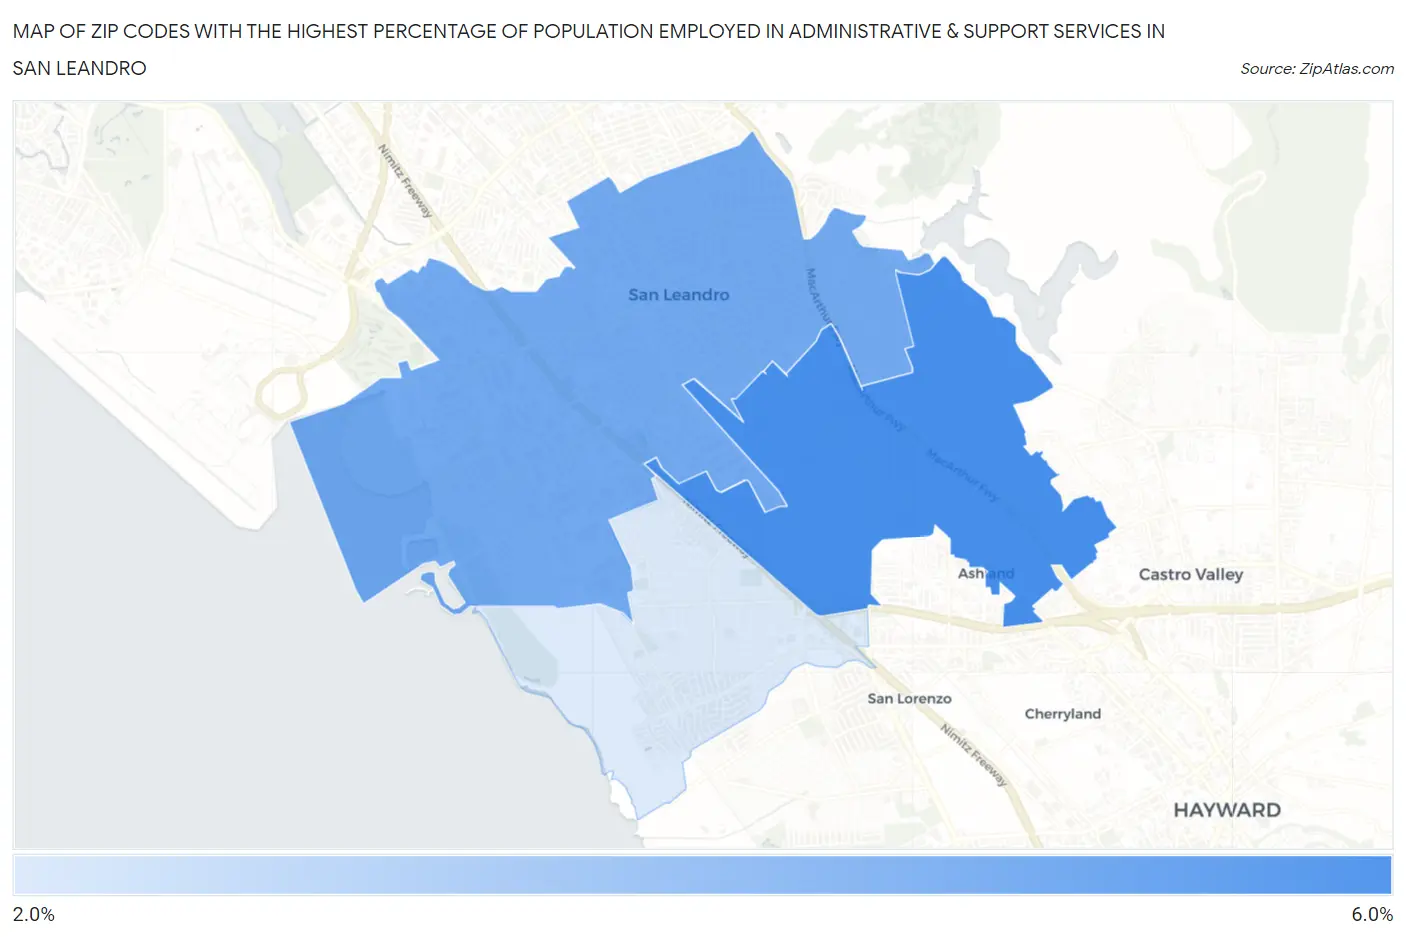
Map of Zip Codes with the Highest Percentage of Population Employed in Administrative & Support Services in San Leandro
2.8%
5.4%
Zip Codes with the Highest Percentage of Population Employed in Administrative & Support Services in San Leandro, CA
| Zip Code | % Employed | vs State | vs National | |
| 1. | 94578 | 5.4% | 4.6%(+0.804)#457 | 4.1%(+1.22)#6,138 |
| 2. | 94577 | 4.6% | 4.6%(+0.024)#632 | 4.1%(+0.444)#8,400 |
| 3. | 94579 | 2.8% | 4.6%(-1.80)#1,144 | 4.1%(-1.38)#16,703 |
1
Common Questions
What are the Top Zip Codes with the Highest Percentage of Population Employed in Administrative & Support Services in San Leandro, CA?
Top Zip Codes with the Highest Percentage of Population Employed in Administrative & Support Services in San Leandro, CA are:
What zip code has the Highest Percentage of Population Employed in Administrative & Support Services in San Leandro, CA?
94578 has the Highest Percentage of Population Employed in Administrative & Support Services in San Leandro, CA with 5.4%.
What is the Percentage of Population Employed in Administrative & Support Services in San Leandro, CA?
Percentage of Population Employed in Administrative & Support Services in San Leandro is 4.4%.
What is the Percentage of Population Employed in Administrative & Support Services in California?
Percentage of Population Employed in Administrative & Support Services in California is 4.6%.
What is the Percentage of Population Employed in Administrative & Support Services in the United States?
Percentage of Population Employed in Administrative & Support Services in the United States is 4.1%.