Zip Codes with the Highest Percentage of Population Employed in Administrative & Support Services in Eureka, CA
RELATED REPORTS & OPTIONS
Administrative & Support Services
Eureka
Compare Zip Codes
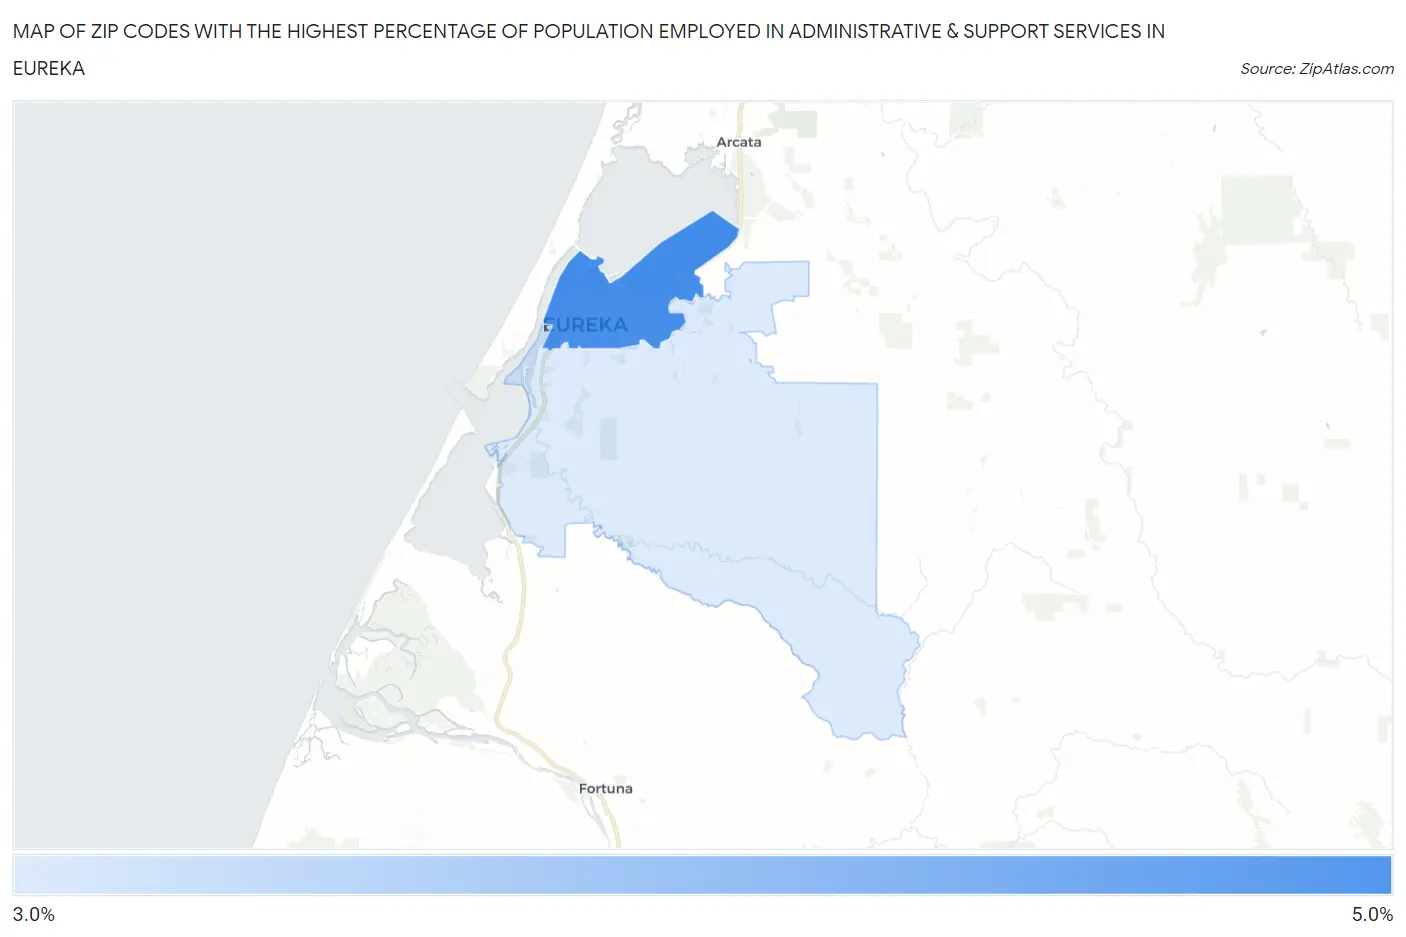
Map of Zip Codes with the Highest Percentage of Population Employed in Administrative & Support Services in Eureka
3.6%
4.9%
Zip Codes with the Highest Percentage of Population Employed in Administrative & Support Services in Eureka, CA
| Zip Code | % Employed | vs State | vs National | |
| 1. | 95501 | 4.9% | 4.6%(+0.337)#557 | 4.1%(+0.757)#7,393 |
| 2. | 95503 | 3.6% | 4.6%(-0.936)#886 | 4.1%(-0.517)#12,317 |
1
Common Questions
What are the Top Zip Codes with the Highest Percentage of Population Employed in Administrative & Support Services in Eureka, CA?
Top Zip Codes with the Highest Percentage of Population Employed in Administrative & Support Services in Eureka, CA are:
What zip code has the Highest Percentage of Population Employed in Administrative & Support Services in Eureka, CA?
95501 has the Highest Percentage of Population Employed in Administrative & Support Services in Eureka, CA with 4.9%.
What is the Percentage of Population Employed in Administrative & Support Services in Eureka, CA?
Percentage of Population Employed in Administrative & Support Services in Eureka is 2.9%.
What is the Percentage of Population Employed in Administrative & Support Services in California?
Percentage of Population Employed in Administrative & Support Services in California is 4.6%.
What is the Percentage of Population Employed in Administrative & Support Services in the United States?
Percentage of Population Employed in Administrative & Support Services in the United States is 4.1%.