Zip Codes with the Highest Percentage of Population Employed in Administrative & Support Services in Santa Maria, CA
RELATED REPORTS & OPTIONS
Administrative & Support Services
Santa Maria
Compare Zip Codes
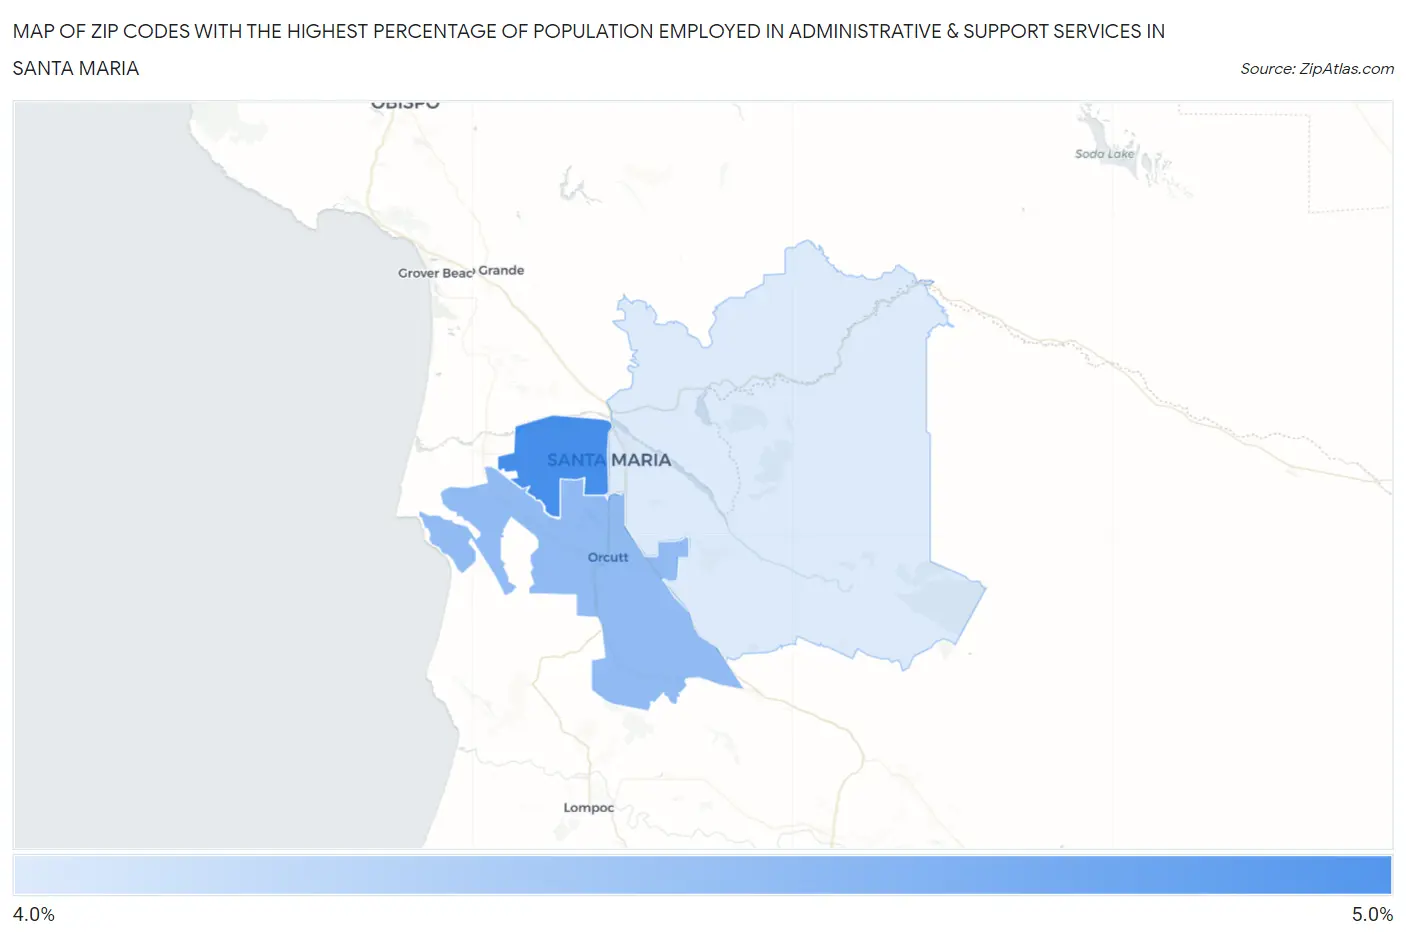
Map of Zip Codes with the Highest Percentage of Population Employed in Administrative & Support Services in Santa Maria
4.3%
4.9%
Zip Codes with the Highest Percentage of Population Employed in Administrative & Support Services in Santa Maria, CA
| Zip Code | % Employed | vs State | vs National | |
| 1. | 93458 | 4.9% | 4.6%(+0.360)#547 | 4.1%(+0.779)#7,311 |
| 2. | 93455 | 4.6% | 4.6%(+0.055)#625 | 4.1%(+0.475)#8,286 |
| 3. | 93454 | 4.3% | 4.6%(-0.252)#706 | 4.1%(+0.168)#9,380 |
1
Common Questions
What are the Top Zip Codes with the Highest Percentage of Population Employed in Administrative & Support Services in Santa Maria, CA?
Top Zip Codes with the Highest Percentage of Population Employed in Administrative & Support Services in Santa Maria, CA are:
What zip code has the Highest Percentage of Population Employed in Administrative & Support Services in Santa Maria, CA?
93458 has the Highest Percentage of Population Employed in Administrative & Support Services in Santa Maria, CA with 4.9%.
What is the Percentage of Population Employed in Administrative & Support Services in Santa Maria, CA?
Percentage of Population Employed in Administrative & Support Services in Santa Maria is 4.9%.
What is the Percentage of Population Employed in Administrative & Support Services in California?
Percentage of Population Employed in Administrative & Support Services in California is 4.6%.
What is the Percentage of Population Employed in Administrative & Support Services in the United States?
Percentage of Population Employed in Administrative & Support Services in the United States is 4.1%.