Zip Codes with the Highest Percentage of Population Employed in Administrative & Support Services in Redlands, CA
RELATED REPORTS & OPTIONS
Administrative & Support Services
Redlands
Compare Zip Codes
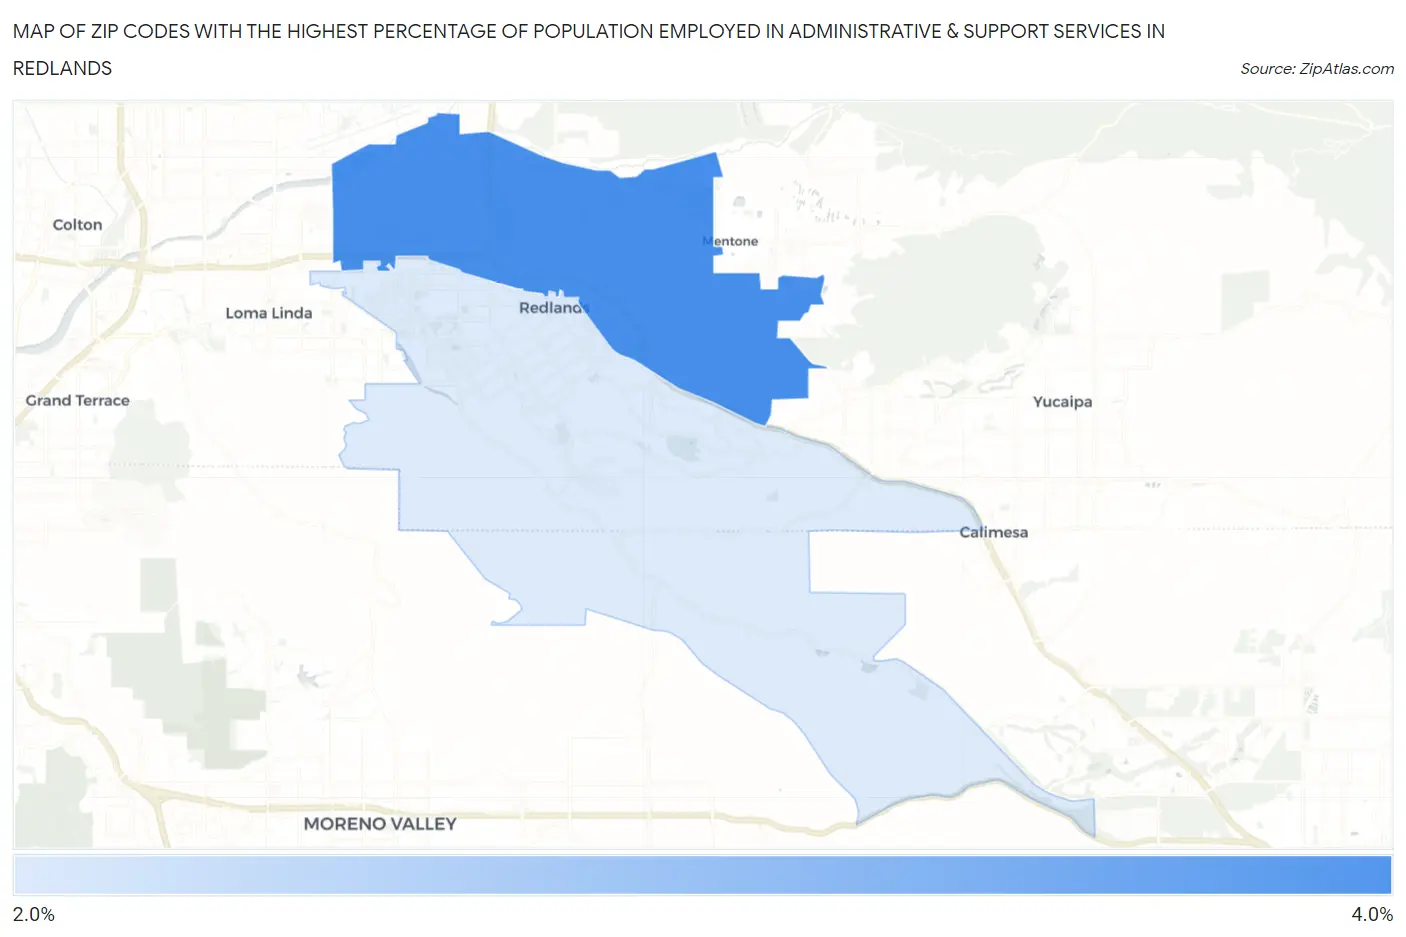
Map of Zip Codes with the Highest Percentage of Population Employed in Administrative & Support Services in Redlands
2.3%
3.2%
Zip Codes with the Highest Percentage of Population Employed in Administrative & Support Services in Redlands, CA
| Zip Code | % Employed | vs State | vs National | |
| 1. | 92374 | 3.2% | 4.6%(-1.41)#1,024 | 4.1%(-0.987)#14,672 |
| 2. | 92373 | 2.3% | 4.6%(-2.27)#1,260 | 4.1%(-1.85)#19,182 |
1
Common Questions
What are the Top Zip Codes with the Highest Percentage of Population Employed in Administrative & Support Services in Redlands, CA?
Top Zip Codes with the Highest Percentage of Population Employed in Administrative & Support Services in Redlands, CA are:
What zip code has the Highest Percentage of Population Employed in Administrative & Support Services in Redlands, CA?
92374 has the Highest Percentage of Population Employed in Administrative & Support Services in Redlands, CA with 3.2%.
What is the Percentage of Population Employed in Administrative & Support Services in Redlands, CA?
Percentage of Population Employed in Administrative & Support Services in Redlands is 2.8%.
What is the Percentage of Population Employed in Administrative & Support Services in California?
Percentage of Population Employed in Administrative & Support Services in California is 4.6%.
What is the Percentage of Population Employed in Administrative & Support Services in the United States?
Percentage of Population Employed in Administrative & Support Services in the United States is 4.1%.