Zip Codes with the Highest Percentage of Population Employed in Administrative & Support Services in Chino, CA
RELATED REPORTS & OPTIONS
Administrative & Support Services
Chino
Compare Zip Codes
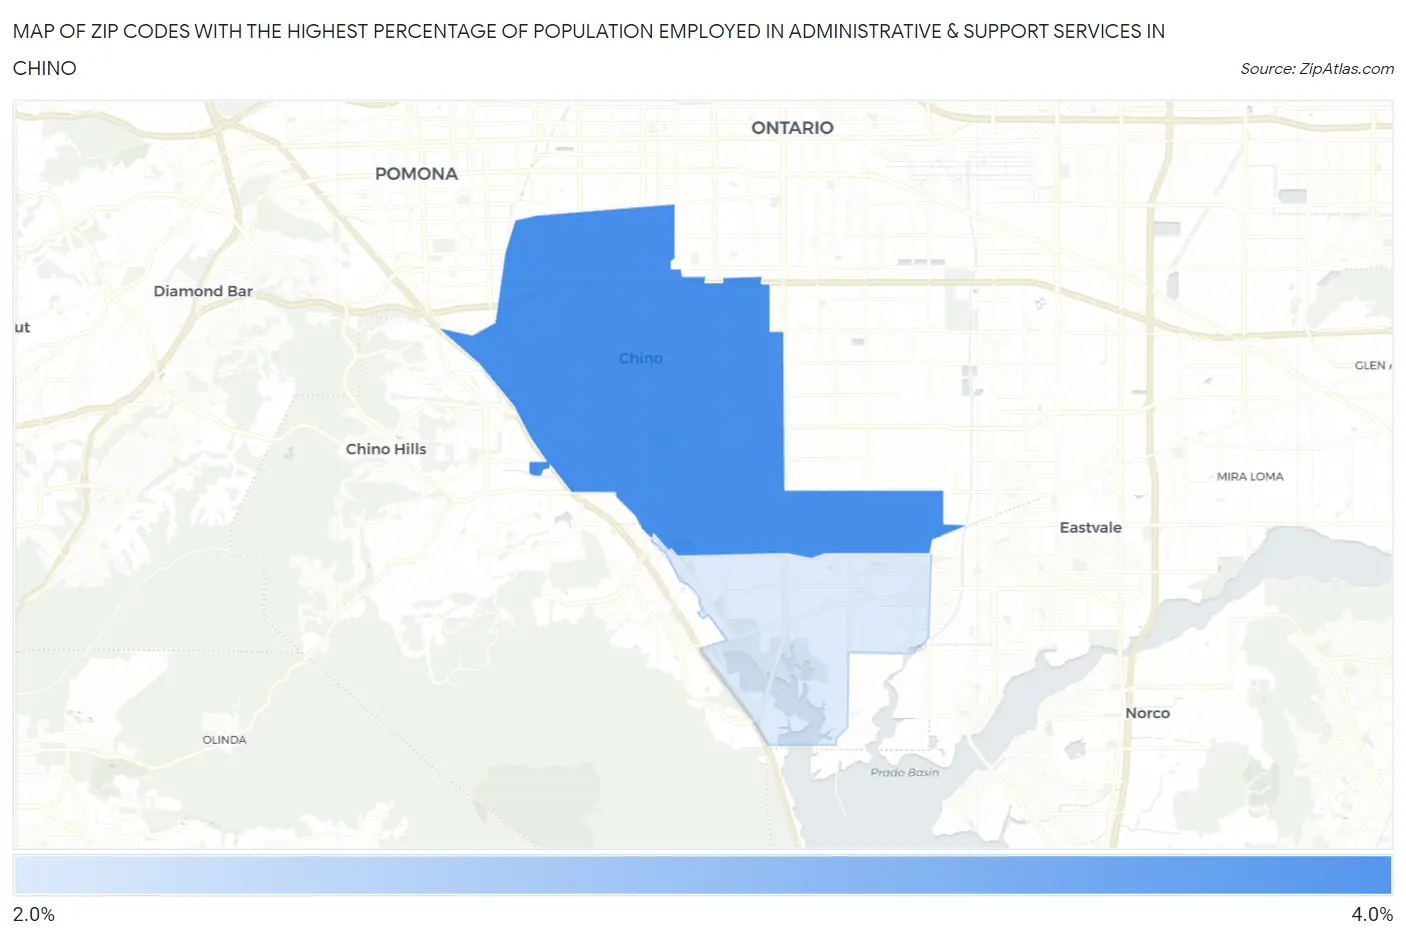
Map of Zip Codes with the Highest Percentage of Population Employed in Administrative & Support Services in Chino
2.2%
4.0%
Zip Codes with the Highest Percentage of Population Employed in Administrative & Support Services in Chino, CA
| Zip Code | % Employed | vs State | vs National | |
| 1. | 91710 | 4.0% | 4.6%(-0.580)#787 | 4.1%(-0.160)#10,744 |
| 2. | 91708 | 2.2% | 4.6%(-2.41)#1,298 | 4.1%(-1.99)#19,862 |
1
Common Questions
What are the Top Zip Codes with the Highest Percentage of Population Employed in Administrative & Support Services in Chino, CA?
Top Zip Codes with the Highest Percentage of Population Employed in Administrative & Support Services in Chino, CA are:
What zip code has the Highest Percentage of Population Employed in Administrative & Support Services in Chino, CA?
91710 has the Highest Percentage of Population Employed in Administrative & Support Services in Chino, CA with 4.0%.
What is the Percentage of Population Employed in Administrative & Support Services in Chino, CA?
Percentage of Population Employed in Administrative & Support Services in Chino is 3.5%.
What is the Percentage of Population Employed in Administrative & Support Services in California?
Percentage of Population Employed in Administrative & Support Services in California is 4.6%.
What is the Percentage of Population Employed in Administrative & Support Services in the United States?
Percentage of Population Employed in Administrative & Support Services in the United States is 4.1%.