Zip Codes with the Highest Percentage of Population Employed in Administrative & Support Services in Oroville, CA
RELATED REPORTS & OPTIONS
Administrative & Support Services
Oroville
Compare Zip Codes
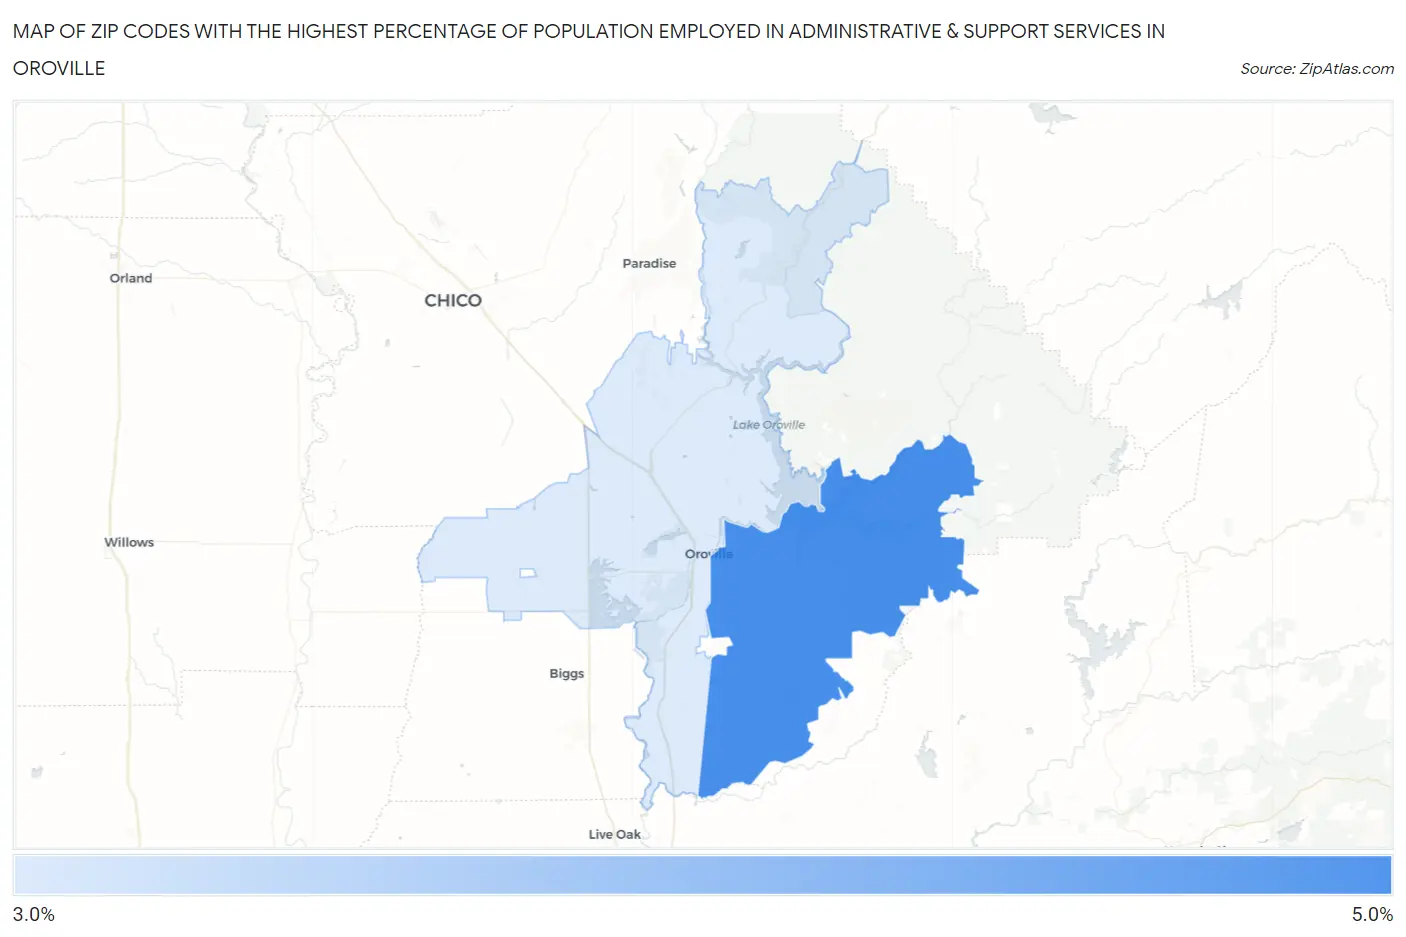
Map of Zip Codes with the Highest Percentage of Population Employed in Administrative & Support Services in Oroville
3.6%
4.8%
Zip Codes with the Highest Percentage of Population Employed in Administrative & Support Services in Oroville, CA
| Zip Code | % Employed | vs State | vs National | |
| 1. | 95966 | 4.8% | 4.6%(+0.256)#576 | 4.1%(+0.675)#7,647 |
| 2. | 95965 | 3.6% | 4.6%(-0.956)#891 | 4.1%(-0.536)#12,407 |
1
Common Questions
What are the Top Zip Codes with the Highest Percentage of Population Employed in Administrative & Support Services in Oroville, CA?
Top Zip Codes with the Highest Percentage of Population Employed in Administrative & Support Services in Oroville, CA are:
What zip code has the Highest Percentage of Population Employed in Administrative & Support Services in Oroville, CA?
95966 has the Highest Percentage of Population Employed in Administrative & Support Services in Oroville, CA with 4.8%.
What is the Percentage of Population Employed in Administrative & Support Services in Oroville, CA?
Percentage of Population Employed in Administrative & Support Services in Oroville is 4.1%.
What is the Percentage of Population Employed in Administrative & Support Services in California?
Percentage of Population Employed in Administrative & Support Services in California is 4.6%.
What is the Percentage of Population Employed in Administrative & Support Services in the United States?
Percentage of Population Employed in Administrative & Support Services in the United States is 4.1%.