Zip Codes with the Highest Percentage of Population Employed in Administrative & Support Services in West Covina, CA
RELATED REPORTS & OPTIONS
Administrative & Support Services
West Covina
Compare Zip Codes
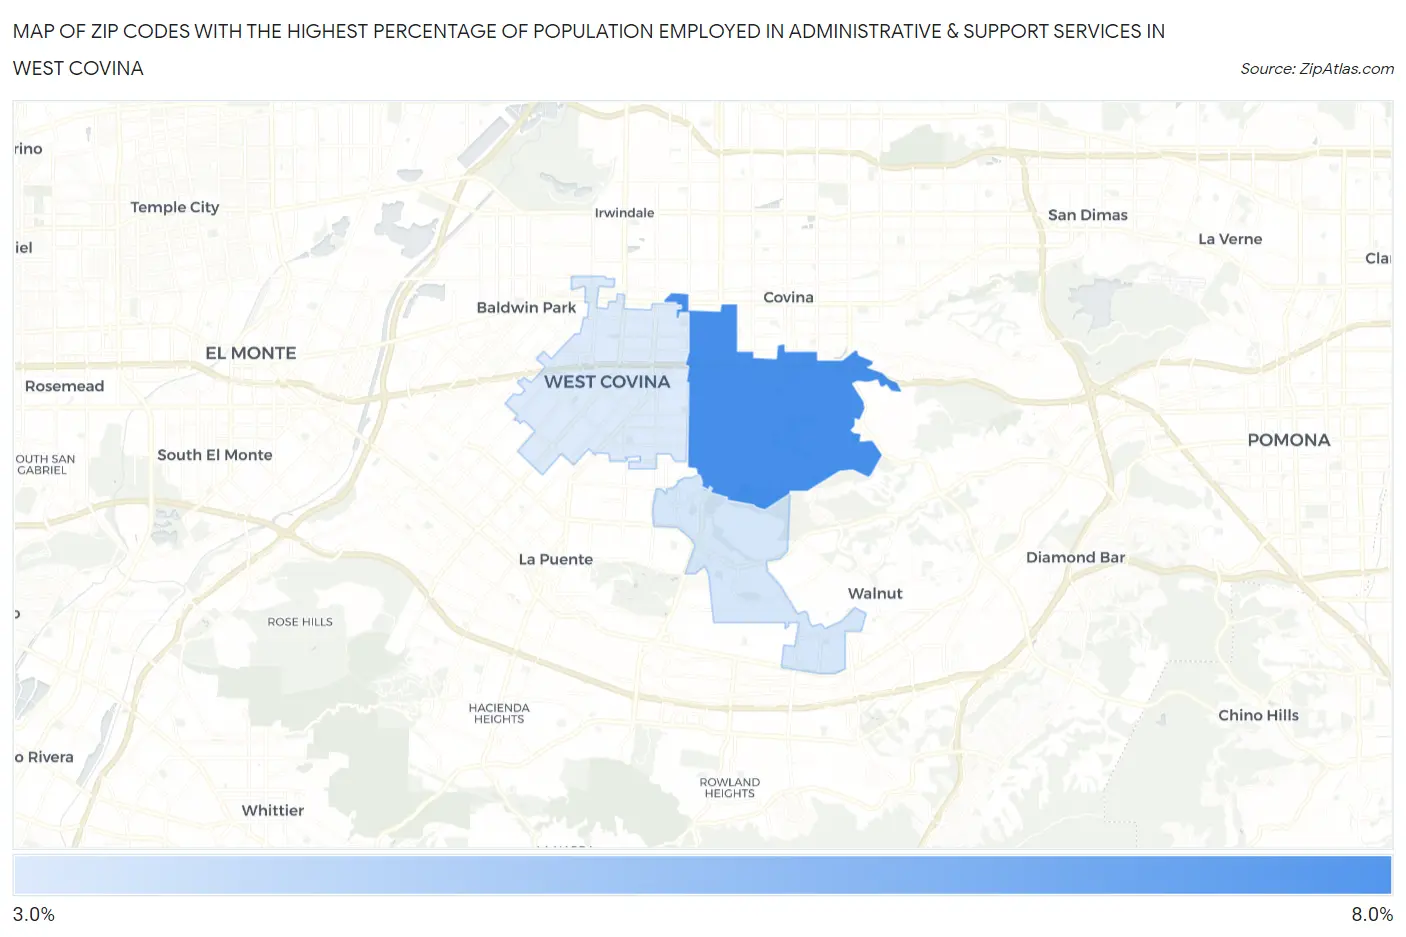
Map of Zip Codes with the Highest Percentage of Population Employed in Administrative & Support Services in West Covina
3.7%
6.2%
Zip Codes with the Highest Percentage of Population Employed in Administrative & Support Services in West Covina, CA
| Zip Code | % Employed | vs State | vs National | |
| 1. | 91791 | 6.2% | 4.6%(+1.67)#311 | 4.1%(+2.09)#4,335 |
| 2. | 91792 | 3.8% | 4.6%(-0.761)#834 | 4.1%(-0.342)#11,492 |
| 3. | 91790 | 3.7% | 4.6%(-0.884)#868 | 4.1%(-0.464)#12,051 |
1
Common Questions
What are the Top Zip Codes with the Highest Percentage of Population Employed in Administrative & Support Services in West Covina, CA?
Top Zip Codes with the Highest Percentage of Population Employed in Administrative & Support Services in West Covina, CA are:
What zip code has the Highest Percentage of Population Employed in Administrative & Support Services in West Covina, CA?
91791 has the Highest Percentage of Population Employed in Administrative & Support Services in West Covina, CA with 6.2%.
What is the Percentage of Population Employed in Administrative & Support Services in West Covina, CA?
Percentage of Population Employed in Administrative & Support Services in West Covina is 4.5%.
What is the Percentage of Population Employed in Administrative & Support Services in California?
Percentage of Population Employed in Administrative & Support Services in California is 4.6%.
What is the Percentage of Population Employed in Administrative & Support Services in the United States?
Percentage of Population Employed in Administrative & Support Services in the United States is 4.1%.