Zip Codes with the Highest Percentage of Population Employed in Administrative & Support Services in Indio, CA
RELATED REPORTS & OPTIONS
Administrative & Support Services
Indio
Compare Zip Codes
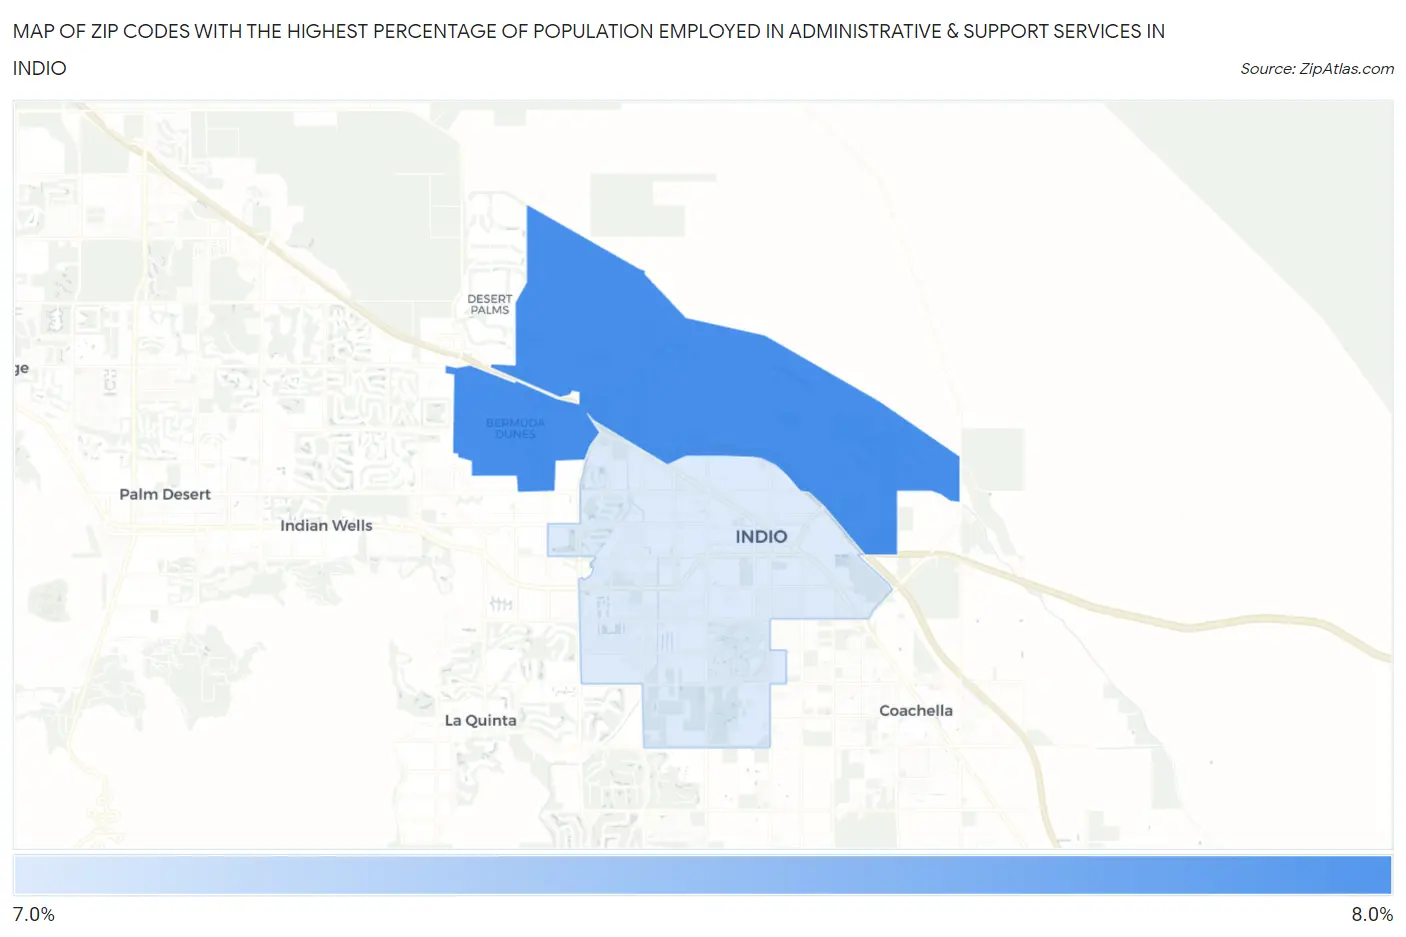
Map of Zip Codes with the Highest Percentage of Population Employed in Administrative & Support Services in Indio
7.0%
7.7%
Zip Codes with the Highest Percentage of Population Employed in Administrative & Support Services in Indio, CA
| Zip Code | % Employed | vs State | vs National | |
| 1. | 92203 | 7.7% | 4.6%(+3.09)#169 | 4.1%(+3.51)#2,543 |
| 2. | 92201 | 7.0% | 4.6%(+2.44)#227 | 4.1%(+2.85)#3,212 |
1
Common Questions
What are the Top Zip Codes with the Highest Percentage of Population Employed in Administrative & Support Services in Indio, CA?
Top Zip Codes with the Highest Percentage of Population Employed in Administrative & Support Services in Indio, CA are:
What zip code has the Highest Percentage of Population Employed in Administrative & Support Services in Indio, CA?
92203 has the Highest Percentage of Population Employed in Administrative & Support Services in Indio, CA with 7.7%.
What is the Percentage of Population Employed in Administrative & Support Services in Indio, CA?
Percentage of Population Employed in Administrative & Support Services in Indio is 7.4%.
What is the Percentage of Population Employed in Administrative & Support Services in California?
Percentage of Population Employed in Administrative & Support Services in California is 4.6%.
What is the Percentage of Population Employed in Administrative & Support Services in the United States?
Percentage of Population Employed in Administrative & Support Services in the United States is 4.1%.