Zip Codes with the Highest Percentage of Population Employed in Administrative & Support Services in Moreno Valley, CA
RELATED REPORTS & OPTIONS
Administrative & Support Services
Moreno Valley
Compare Zip Codes
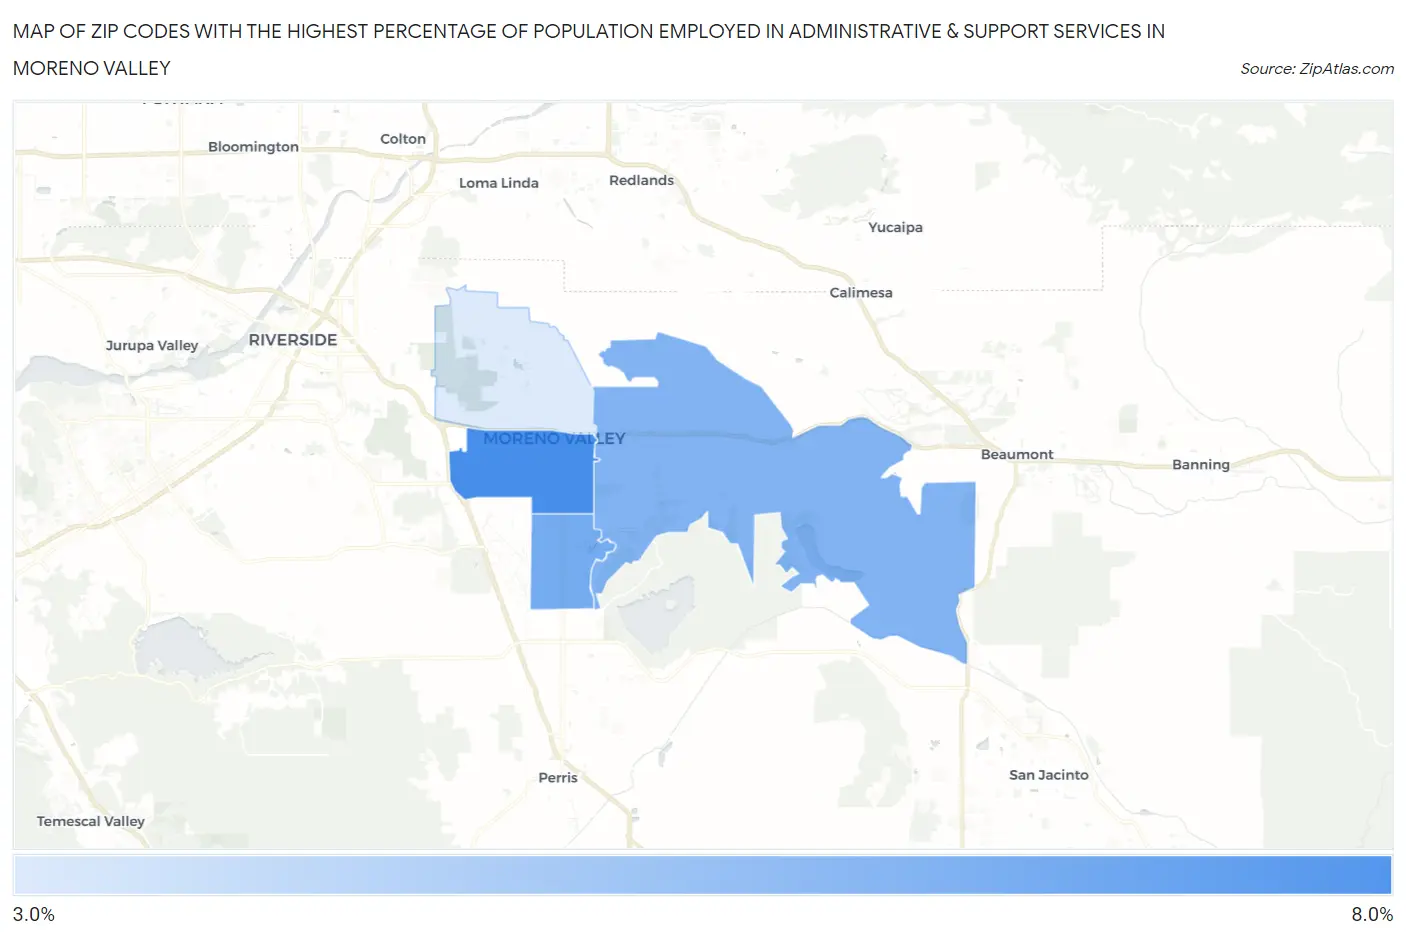
Map of Zip Codes with the Highest Percentage of Population Employed in Administrative & Support Services in Moreno Valley
3.6%
6.8%
Zip Codes with the Highest Percentage of Population Employed in Administrative & Support Services in Moreno Valley, CA
| Zip Code | % Employed | vs State | vs National | |
| 1. | 92553 | 6.8% | 4.6%(+2.23)#248 | 4.1%(+2.65)#3,481 |
| 2. | 92551 | 5.8% | 4.6%(+1.22)#384 | 4.1%(+1.64)#5,160 |
| 3. | 92555 | 5.5% | 4.6%(+0.966)#433 | 4.1%(+1.39)#5,742 |
| 4. | 92557 | 3.6% | 4.6%(-1.000)#906 | 4.1%(-0.580)#12,615 |
1
Common Questions
What are the Top 3 Zip Codes with the Highest Percentage of Population Employed in Administrative & Support Services in Moreno Valley, CA?
Top 3 Zip Codes with the Highest Percentage of Population Employed in Administrative & Support Services in Moreno Valley, CA are:
What zip code has the Highest Percentage of Population Employed in Administrative & Support Services in Moreno Valley, CA?
92553 has the Highest Percentage of Population Employed in Administrative & Support Services in Moreno Valley, CA with 6.8%.
What is the Percentage of Population Employed in Administrative & Support Services in Moreno Valley, CA?
Percentage of Population Employed in Administrative & Support Services in Moreno Valley is 5.5%.
What is the Percentage of Population Employed in Administrative & Support Services in California?
Percentage of Population Employed in Administrative & Support Services in California is 4.6%.
What is the Percentage of Population Employed in Administrative & Support Services in the United States?
Percentage of Population Employed in Administrative & Support Services in the United States is 4.1%.