Zip Codes with the Highest Percentage of Population Employed in Administrative & Support Services in Citrus Heights, CA
RELATED REPORTS & OPTIONS
Administrative & Support Services
Citrus Heights
Compare Zip Codes
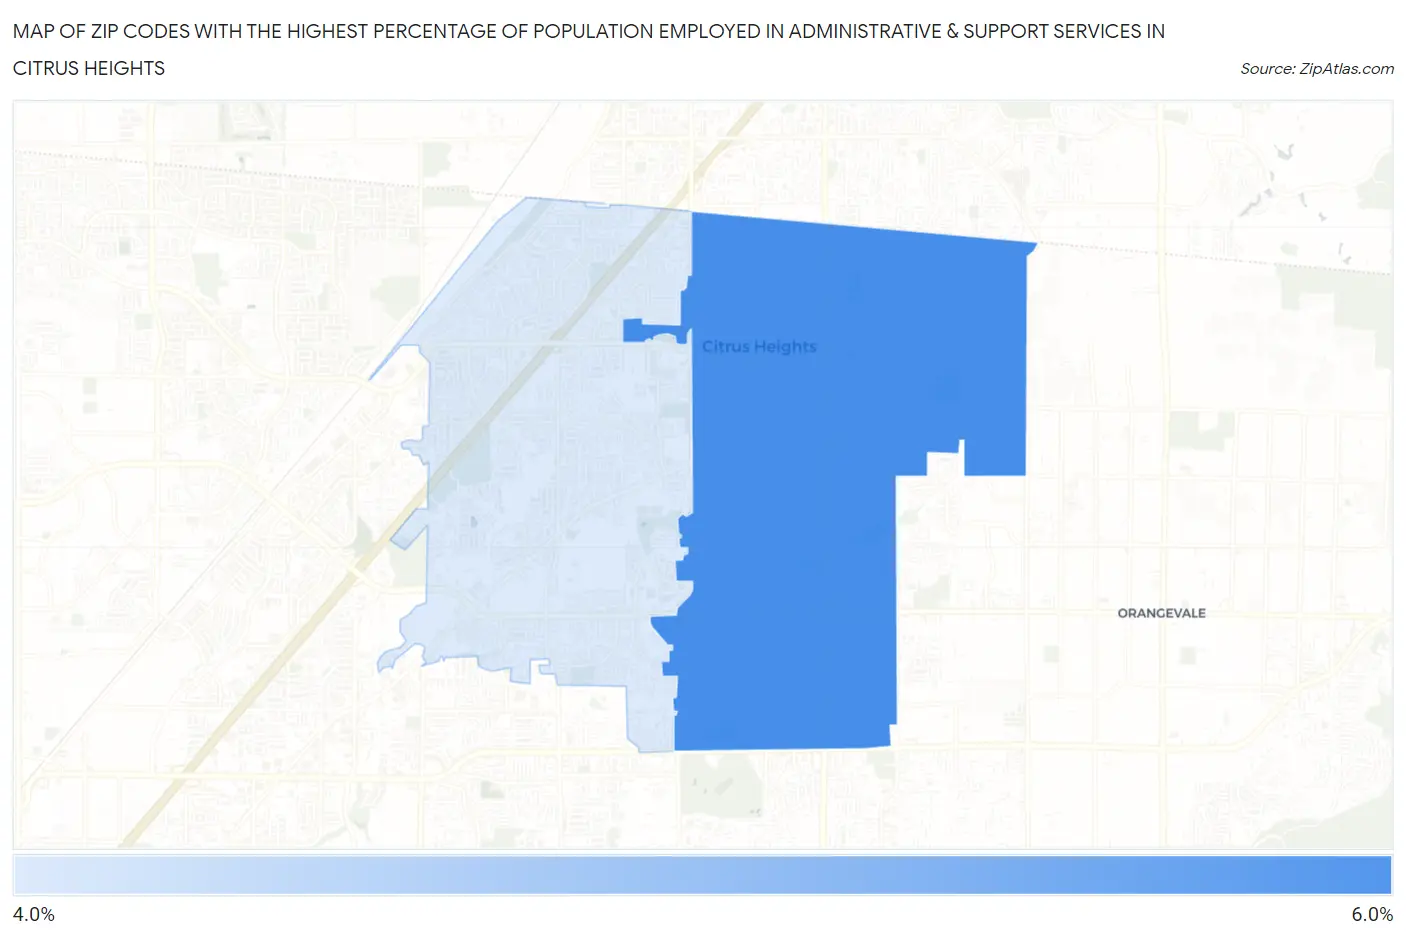
Map of Zip Codes with the Highest Percentage of Population Employed in Administrative & Support Services in Citrus Heights
4.2%
5.1%
Zip Codes with the Highest Percentage of Population Employed in Administrative & Support Services in Citrus Heights, CA
| Zip Code | % Employed | vs State | vs National | |
| 1. | 95610 | 5.1% | 4.6%(+0.495)#512 | 4.1%(+0.914)#6,936 |
| 2. | 95621 | 4.2% | 4.6%(-0.331)#731 | 4.1%(+0.089)#9,665 |
1
Common Questions
What are the Top Zip Codes with the Highest Percentage of Population Employed in Administrative & Support Services in Citrus Heights, CA?
Top Zip Codes with the Highest Percentage of Population Employed in Administrative & Support Services in Citrus Heights, CA are:
What zip code has the Highest Percentage of Population Employed in Administrative & Support Services in Citrus Heights, CA?
95610 has the Highest Percentage of Population Employed in Administrative & Support Services in Citrus Heights, CA with 5.1%.
What is the Percentage of Population Employed in Administrative & Support Services in Citrus Heights, CA?
Percentage of Population Employed in Administrative & Support Services in Citrus Heights is 4.7%.
What is the Percentage of Population Employed in Administrative & Support Services in California?
Percentage of Population Employed in Administrative & Support Services in California is 4.6%.
What is the Percentage of Population Employed in Administrative & Support Services in the United States?
Percentage of Population Employed in Administrative & Support Services in the United States is 4.1%.