Zip Codes with the Highest Percentage of Population Employed in Administrative & Support Services in Gardena, CA
RELATED REPORTS & OPTIONS
Administrative & Support Services
Gardena
Compare Zip Codes
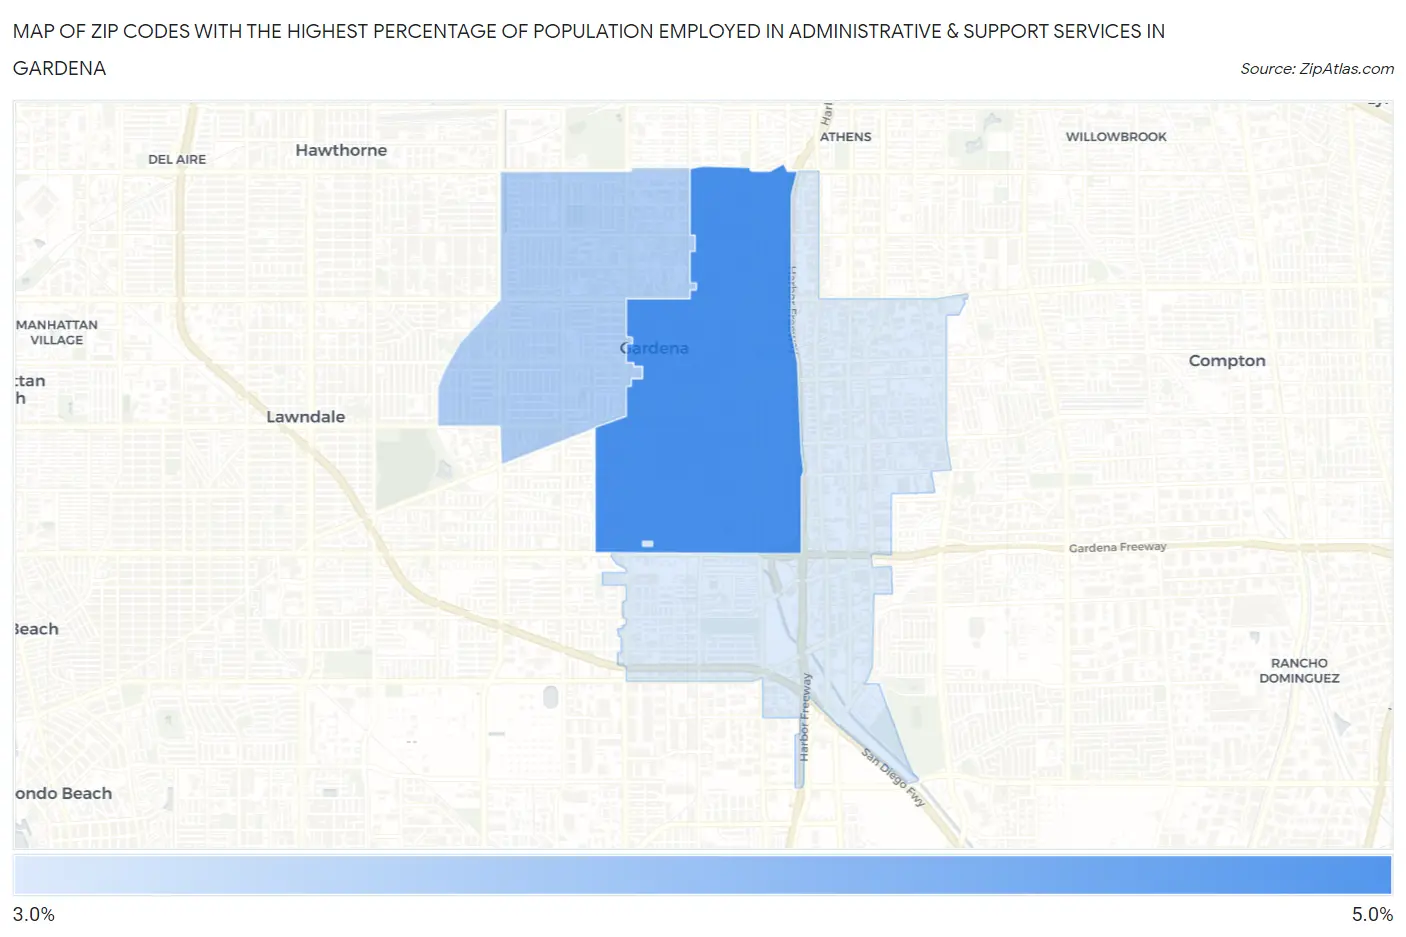
Map of Zip Codes with the Highest Percentage of Population Employed in Administrative & Support Services in Gardena
3.3%
4.6%
Zip Codes with the Highest Percentage of Population Employed in Administrative & Support Services in Gardena, CA
| Zip Code | % Employed | vs State | vs National | |
| 1. | 90247 | 4.6% | 4.6%(+0.063)#622 | 4.1%(+0.482)#8,248 |
| 2. | 90249 | 3.7% | 4.6%(-0.849)#855 | 4.1%(-0.429)#11,902 |
| 3. | 90248 | 3.3% | 4.6%(-1.24)#973 | 4.1%(-0.822)#13,796 |
1
Common Questions
What are the Top Zip Codes with the Highest Percentage of Population Employed in Administrative & Support Services in Gardena, CA?
Top Zip Codes with the Highest Percentage of Population Employed in Administrative & Support Services in Gardena, CA are:
What zip code has the Highest Percentage of Population Employed in Administrative & Support Services in Gardena, CA?
90247 has the Highest Percentage of Population Employed in Administrative & Support Services in Gardena, CA with 4.6%.
What is the Percentage of Population Employed in Administrative & Support Services in Gardena, CA?
Percentage of Population Employed in Administrative & Support Services in Gardena is 4.1%.
What is the Percentage of Population Employed in Administrative & Support Services in California?
Percentage of Population Employed in Administrative & Support Services in California is 4.6%.
What is the Percentage of Population Employed in Administrative & Support Services in the United States?
Percentage of Population Employed in Administrative & Support Services in the United States is 4.1%.