Zip Codes with the Highest Percentage of Population Employed in Administrative & Support Services in Menifee, CA
RELATED REPORTS & OPTIONS
Administrative & Support Services
Menifee
Compare Zip Codes
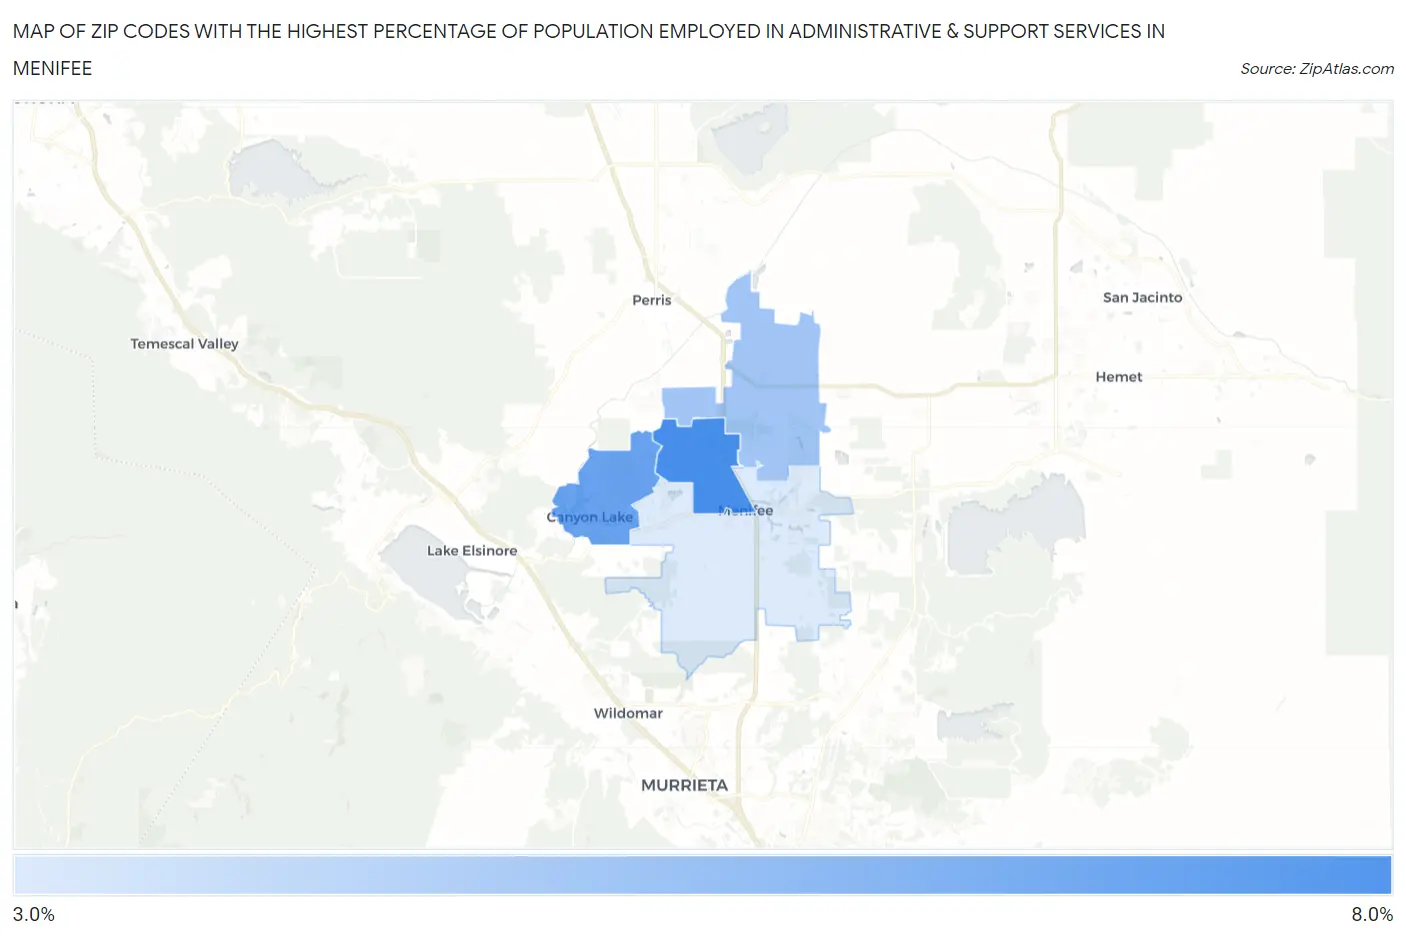
Map of Zip Codes with the Highest Percentage of Population Employed in Administrative & Support Services in Menifee
3.1%
6.5%
Zip Codes with the Highest Percentage of Population Employed in Administrative & Support Services in Menifee, CA
| Zip Code | % Employed | vs State | vs National | |
| 1. | 92586 | 6.5% | 4.6%(+1.98)#282 | 4.1%(+2.40)#3,836 |
| 2. | 92587 | 5.8% | 4.6%(+1.24)#380 | 4.1%(+1.66)#5,134 |
| 3. | 92585 | 4.5% | 4.6%(-0.119)#667 | 4.1%(+0.301)#8,878 |
| 4. | 92584 | 3.1% | 4.6%(-1.46)#1,037 | 4.1%(-1.04)#14,961 |
1
Common Questions
What are the Top 3 Zip Codes with the Highest Percentage of Population Employed in Administrative & Support Services in Menifee, CA?
Top 3 Zip Codes with the Highest Percentage of Population Employed in Administrative & Support Services in Menifee, CA are:
What zip code has the Highest Percentage of Population Employed in Administrative & Support Services in Menifee, CA?
92586 has the Highest Percentage of Population Employed in Administrative & Support Services in Menifee, CA with 6.5%.
What is the Percentage of Population Employed in Administrative & Support Services in Menifee, CA?
Percentage of Population Employed in Administrative & Support Services in Menifee is 4.0%.
What is the Percentage of Population Employed in Administrative & Support Services in California?
Percentage of Population Employed in Administrative & Support Services in California is 4.6%.
What is the Percentage of Population Employed in Administrative & Support Services in the United States?
Percentage of Population Employed in Administrative & Support Services in the United States is 4.1%.