Zip Codes with the Highest Percentage of Population Employed in Administrative & Support Services in Arcadia, CA
RELATED REPORTS & OPTIONS
Administrative & Support Services
Arcadia
Compare Zip Codes
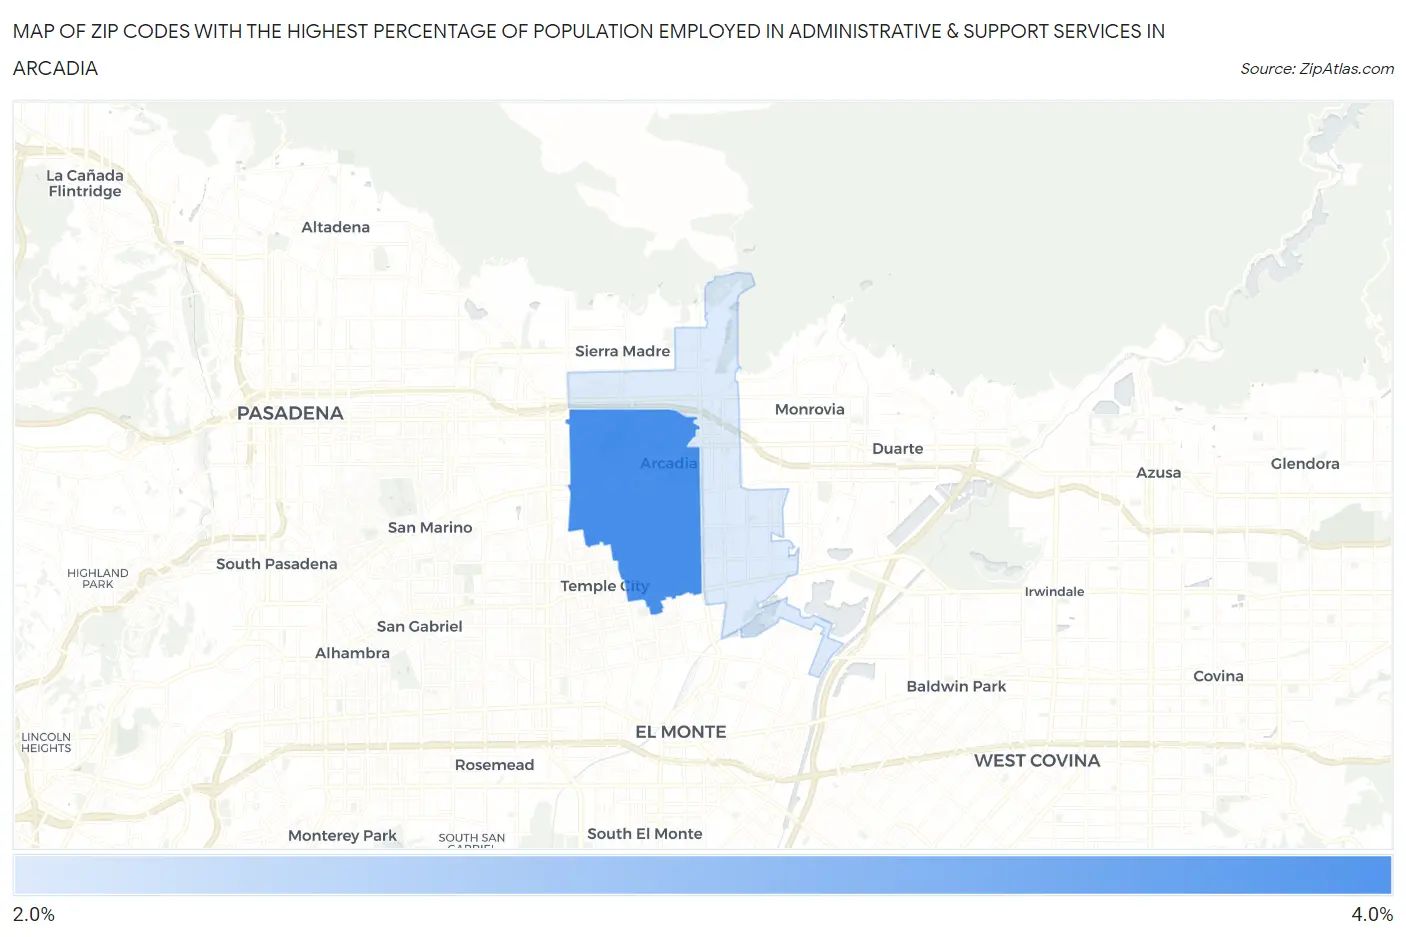
Map of Zip Codes with the Highest Percentage of Population Employed in Administrative & Support Services in Arcadia
2.7%
3.1%
Zip Codes with the Highest Percentage of Population Employed in Administrative & Support Services in Arcadia, CA
| Zip Code | % Employed | vs State | vs National | |
| 1. | 91007 | 3.1% | 4.6%(-1.45)#1,034 | 4.1%(-1.03)#14,892 |
| 2. | 91006 | 2.7% | 4.6%(-1.91)#1,164 | 4.1%(-1.49)#17,300 |
1
Common Questions
What are the Top Zip Codes with the Highest Percentage of Population Employed in Administrative & Support Services in Arcadia, CA?
Top Zip Codes with the Highest Percentage of Population Employed in Administrative & Support Services in Arcadia, CA are:
What zip code has the Highest Percentage of Population Employed in Administrative & Support Services in Arcadia, CA?
91007 has the Highest Percentage of Population Employed in Administrative & Support Services in Arcadia, CA with 3.1%.
What is the Percentage of Population Employed in Administrative & Support Services in Arcadia, CA?
Percentage of Population Employed in Administrative & Support Services in Arcadia is 3.1%.
What is the Percentage of Population Employed in Administrative & Support Services in California?
Percentage of Population Employed in Administrative & Support Services in California is 4.6%.
What is the Percentage of Population Employed in Administrative & Support Services in the United States?
Percentage of Population Employed in Administrative & Support Services in the United States is 4.1%.