Zip Codes with the Highest Percentage of Population Employed in Professional & Scientific Services in Chino, CA
RELATED REPORTS & OPTIONS
Professional & Scientific Services
Chino
Compare Zip Codes
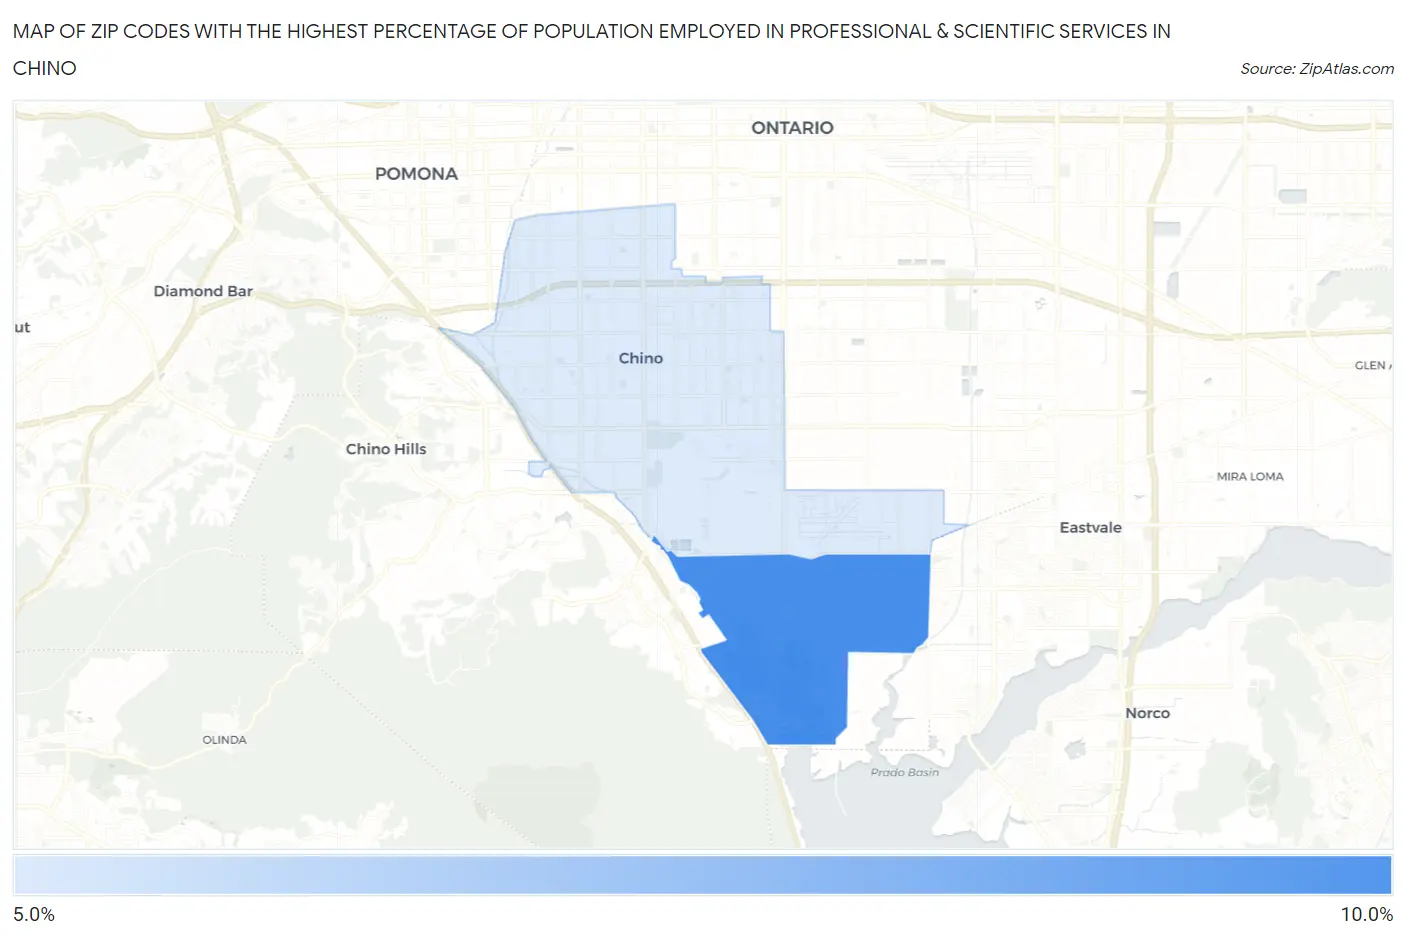
Map of Zip Codes with the Highest Percentage of Population Employed in Professional & Scientific Services in Chino
5.2%
9.4%
Zip Codes with the Highest Percentage of Population Employed in Professional & Scientific Services in Chino, CA
| Zip Code | % Employed | vs State | vs National | |
| 1. | 91708 | 9.4% | 9.4%(-0.028)#578 | 7.8%(+1.56)#5,083 |
| 2. | 91710 | 5.2% | 9.4%(-4.28)#1,006 | 7.8%(-2.69)#11,929 |
1
Common Questions
What are the Top Zip Codes with the Highest Percentage of Population Employed in Professional & Scientific Services in Chino, CA?
Top Zip Codes with the Highest Percentage of Population Employed in Professional & Scientific Services in Chino, CA are:
What zip code has the Highest Percentage of Population Employed in Professional & Scientific Services in Chino, CA?
91708 has the Highest Percentage of Population Employed in Professional & Scientific Services in Chino, CA with 9.4%.
What is the Percentage of Population Employed in Professional & Scientific Services in Chino, CA?
Percentage of Population Employed in Professional & Scientific Services in Chino is 6.0%.
What is the Percentage of Population Employed in Professional & Scientific Services in California?
Percentage of Population Employed in Professional & Scientific Services in California is 9.4%.
What is the Percentage of Population Employed in Professional & Scientific Services in the United States?
Percentage of Population Employed in Professional & Scientific Services in the United States is 7.8%.