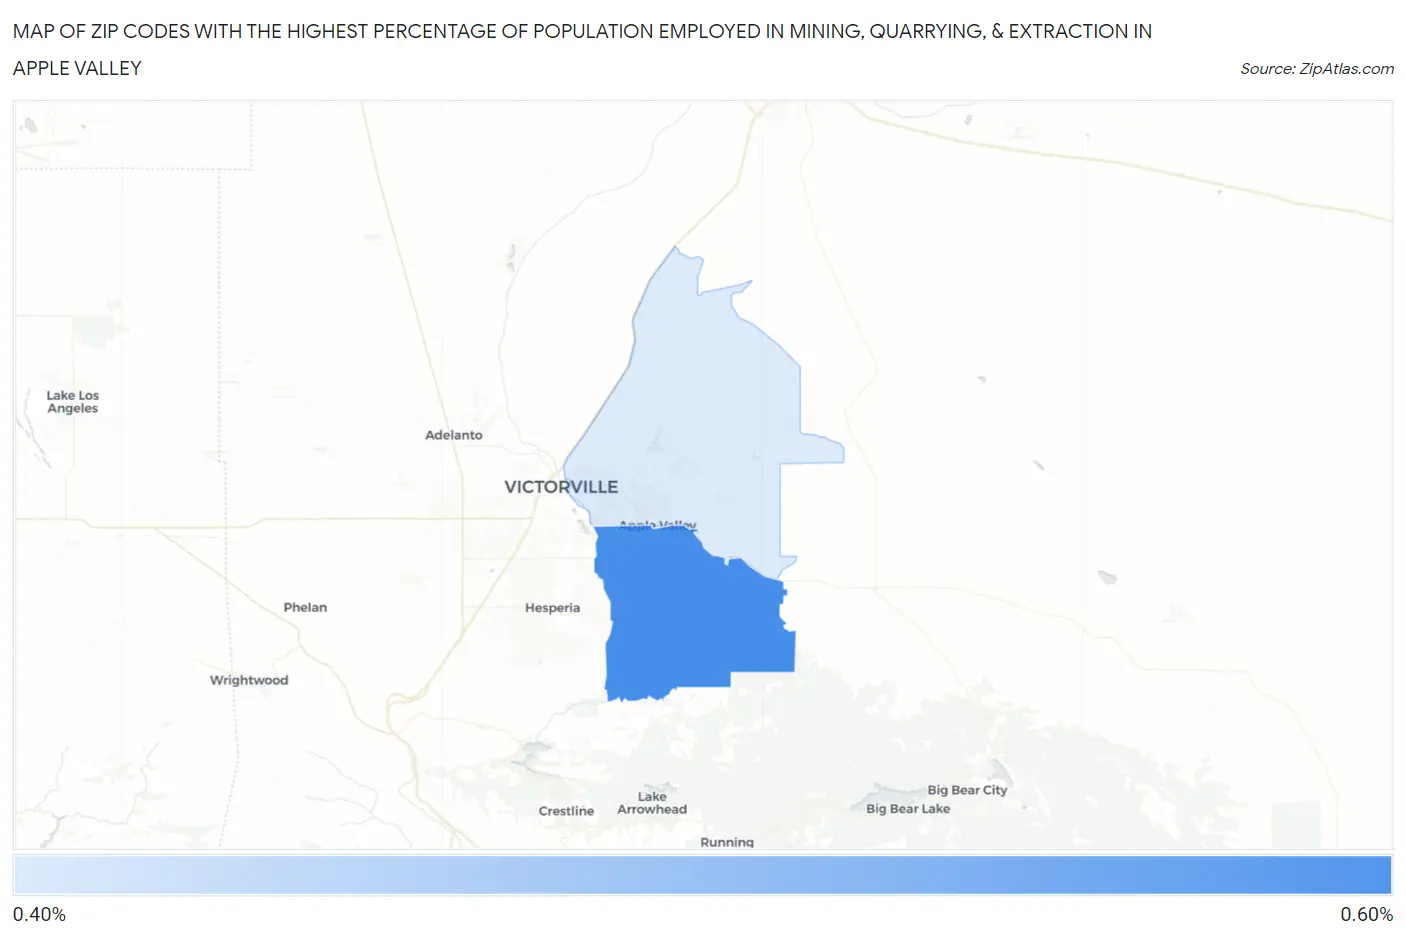
Zip Codes with the Highest Percentage of Population Employed in Mining, Quarrying, & Extraction in Apple Valley, CA
RELATED REPORTS & OPTIONS
Mining, Quarrying, & Extraction
Apple Valley
Compare Zip Codes
Map of Zip Codes with the Highest Percentage of Population Employed in Mining, Quarrying, & Extraction in Apple Valley
0.43%
0.53%
Zip Codes with the Highest Percentage of Population Employed in Mining, Quarrying, & Extraction in Apple Valley, CA
| Zip Code | % Employed | vs State | vs National | |
| 1. | 92308 | 0.53% | 0.12%(+0.410)#107 | 0.44%(+0.093)#7,041 |
| 2. | 92307 | 0.43% | 0.12%(+0.303)#121 | 0.44%(-0.014)#7,615 |
1
Common Questions
What are the Top Zip Codes with the Highest Percentage of Population Employed in Mining, Quarrying, & Extraction in Apple Valley, CA?
Top Zip Codes with the Highest Percentage of Population Employed in Mining, Quarrying, & Extraction in Apple Valley, CA are:
What zip code has the Highest Percentage of Population Employed in Mining, Quarrying, & Extraction in Apple Valley, CA?
92308 has the Highest Percentage of Population Employed in Mining, Quarrying, & Extraction in Apple Valley, CA with 0.53%.
What is the Percentage of Population Employed in Mining, Quarrying, & Extraction in Apple Valley, CA?
Percentage of Population Employed in Mining, Quarrying, & Extraction in Apple Valley is 0.51%.
What is the Percentage of Population Employed in Mining, Quarrying, & Extraction in California?
Percentage of Population Employed in Mining, Quarrying, & Extraction in California is 0.12%.
What is the Percentage of Population Employed in Mining, Quarrying, & Extraction in the United States?
Percentage of Population Employed in Mining, Quarrying, & Extraction in the United States is 0.44%.