Zip Codes with the Highest Percentage of Households Heated by Bottled Gas / Liquid Propane in Apple Valley, CA
RELATED REPORTS & OPTIONS
Bottled Gas / LP Heating
Apple Valley
Compare Zip Codes
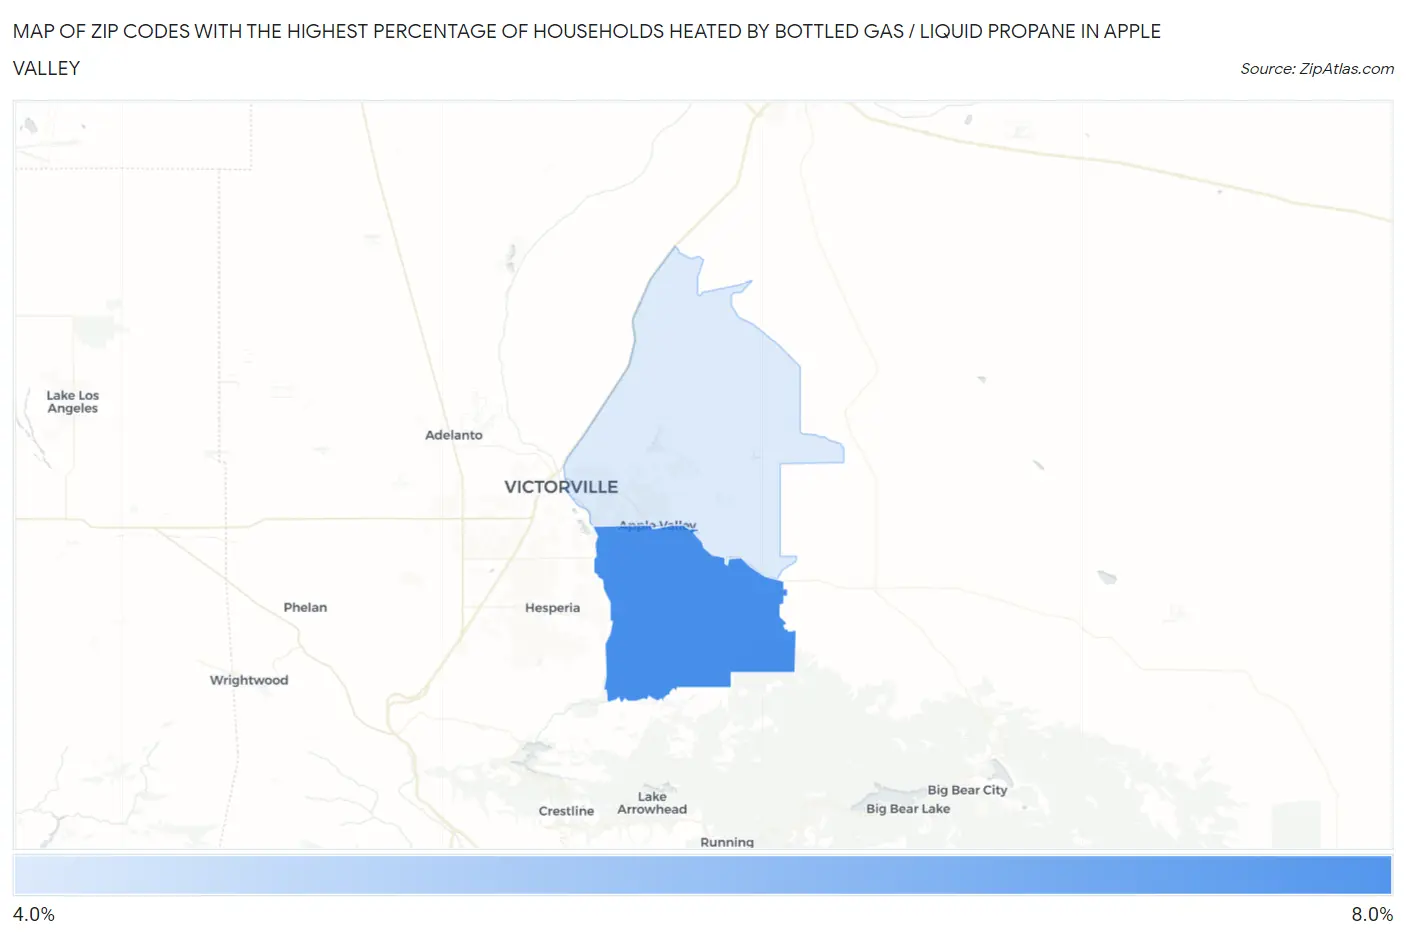
Map of Zip Codes with the Highest Percentage of Households Heated by Bottled Gas / Liquid Propane in Apple Valley
4.4%
6.6%
Zip Codes with the Highest Percentage of Households Heated by Bottled Gas / Liquid Propane in Apple Valley, CA
| Zip Code | Bottled Gas / LP Heating | vs State | vs National | |
| 1. | 92308 | 6.6% | 3.5%(+3.10)#564 | 4.9%(+1.70)#17,073 |
| 2. | 92307 | 4.4% | 3.5%(+0.900)#636 | 4.9%(-0.500)#19,172 |
1
Common Questions
What are the Top Zip Codes with the Highest Percentage of Households Heated by Bottled Gas / Liquid Propane in Apple Valley, CA?
Top Zip Codes with the Highest Percentage of Households Heated by Bottled Gas / Liquid Propane in Apple Valley, CA are:
What zip code has the Highest Percentage of Households Heated by Bottled Gas / Liquid Propane in Apple Valley, CA?
92308 has the Highest Percentage of Households Heated by Bottled Gas / Liquid Propane in Apple Valley, CA with 6.6%.
What is the Percentage of Households Heated by Bottled Gas / Liquid Propane in Apple Valley, CA?
Percentage of Households Heated by Bottled Gas / Liquid Propane in Apple Valley is 1.7%.
What is the Percentage of Households Heated by Bottled Gas / Liquid Propane in California?
Percentage of Households Heated by Bottled Gas / Liquid Propane in California is 3.5%.
What is the Percentage of Households Heated by Bottled Gas / Liquid Propane in the United States?
Percentage of Households Heated by Bottled Gas / Liquid Propane in the United States is 4.9%.