Zip Codes with the Highest Percentage of Population Employed in Arts, Media & Entertainment in Benton, AR
RELATED REPORTS & OPTIONS
Arts, Media & Entertainment
Benton
Compare Zip Codes
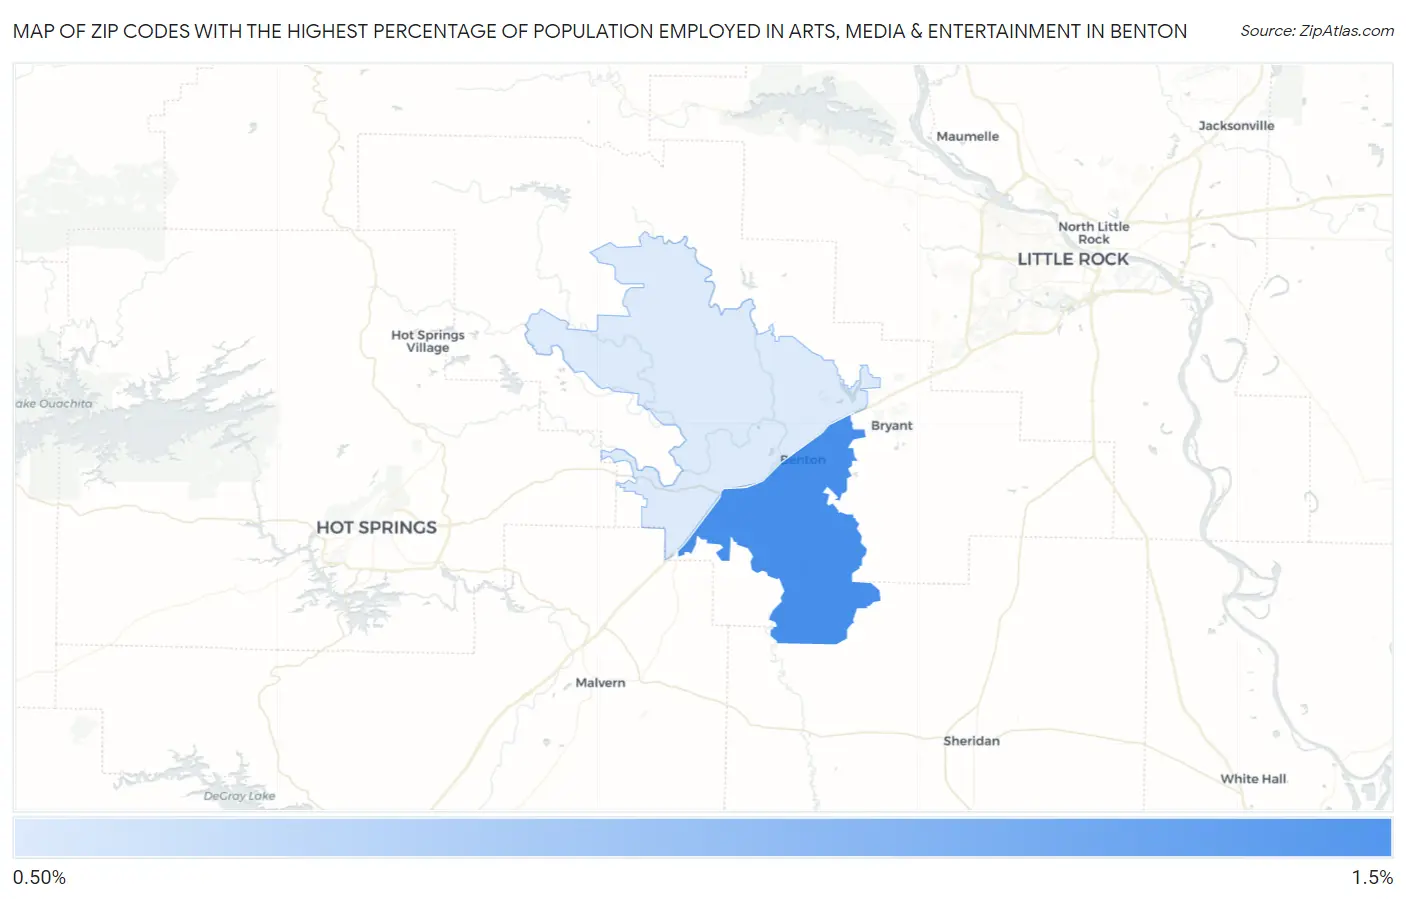
Map of Zip Codes with the Highest Percentage of Population Employed in Arts, Media & Entertainment in Benton
0.61%
1.4%
Zip Codes with the Highest Percentage of Population Employed in Arts, Media & Entertainment in Benton, AR
| Zip Code | % Employed | vs State | vs National | |
| 1. | 72015 | 1.4% | 1.3%(+0.100)#91 | 2.1%(-0.635)#11,518 |
| 2. | 72019 | 0.61% | 1.3%(-0.715)#179 | 2.1%(-1.45)#17,979 |
1
Common Questions
What are the Top Zip Codes with the Highest Percentage of Population Employed in Arts, Media & Entertainment in Benton, AR?
Top Zip Codes with the Highest Percentage of Population Employed in Arts, Media & Entertainment in Benton, AR are:
What zip code has the Highest Percentage of Population Employed in Arts, Media & Entertainment in Benton, AR?
72015 has the Highest Percentage of Population Employed in Arts, Media & Entertainment in Benton, AR with 1.4%.
What is the Percentage of Population Employed in Arts, Media & Entertainment in Benton, AR?
Percentage of Population Employed in Arts, Media & Entertainment in Benton is 1.3%.
What is the Percentage of Population Employed in Arts, Media & Entertainment in Arkansas?
Percentage of Population Employed in Arts, Media & Entertainment in Arkansas is 1.3%.
What is the Percentage of Population Employed in Arts, Media & Entertainment in the United States?
Percentage of Population Employed in Arts, Media & Entertainment in the United States is 2.1%.