Cities with the Highest Percentage of Indian (Asian) Population in Florida
RELATED REPORTS & OPTIONS
Indian (Asian)
Florida
Compare Cities
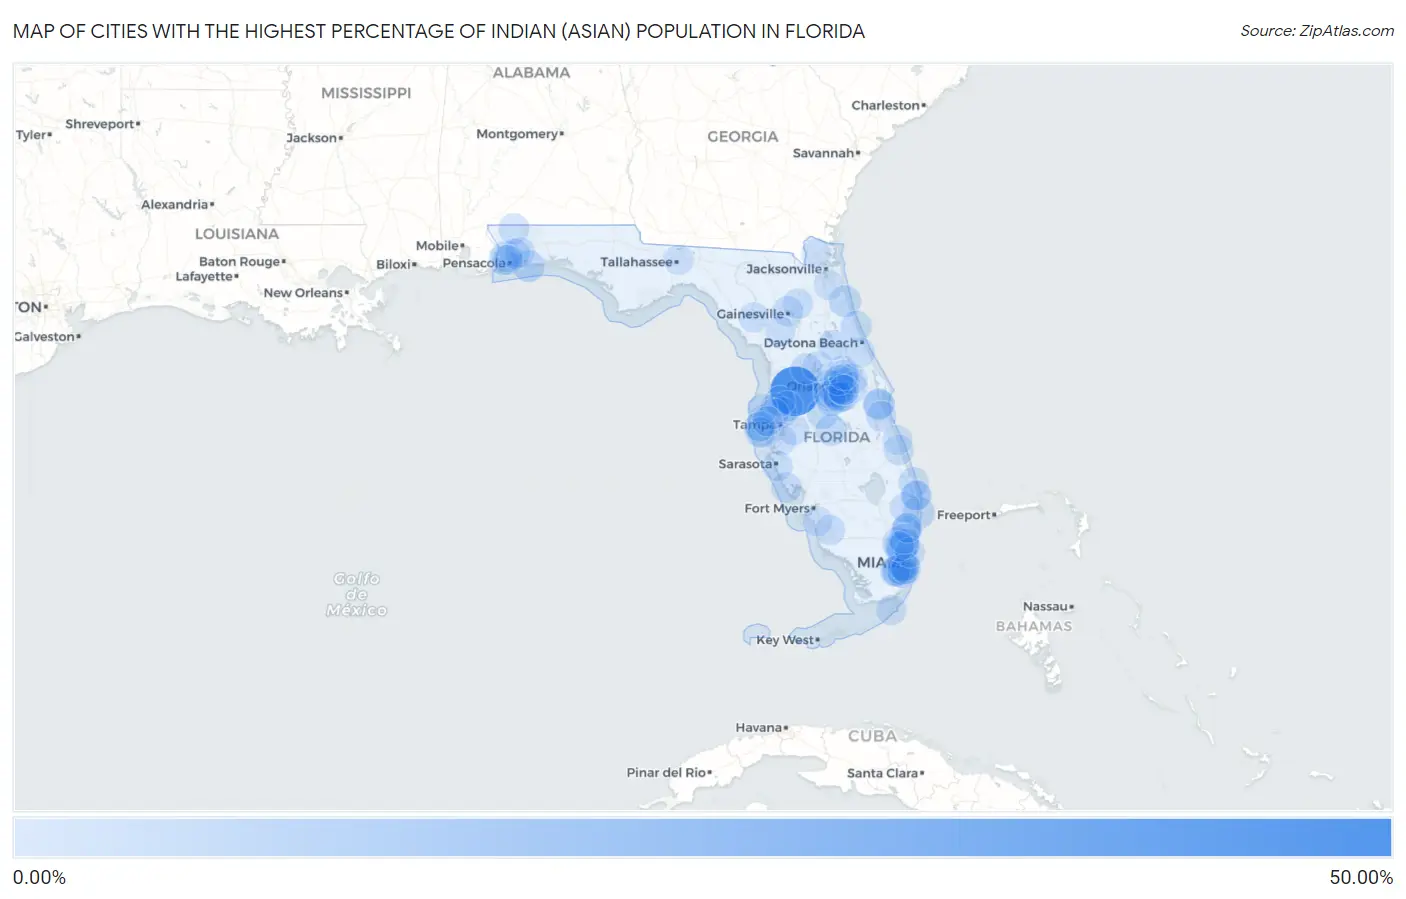
Map of Cities with the Highest Percentage of Indian (Asian) Population in Florida
0.00%
50.00%
Cities with the Highest Percentage of Indian (Asian) Population in Florida
| City | Indian (Asian) | vs State | vs National | |
| 1. | Trilby | 46.81% | 0.66%(+46.1)#1 | 1.61%(+45.2)#6 |
| 2. | Pine Ridge Cdp Collier County | 6.22% | 0.66%(+5.56)#2 | 1.61%(+4.61)#563 |
| 3. | Manalapan | 5.83% | 0.66%(+5.17)#3 | 1.61%(+4.22)#620 |
| 4. | Navarre Beach | 5.40% | 0.66%(+4.73)#4 | 1.61%(+3.79)#676 |
| 5. | St Augustine South | 5.29% | 0.66%(+4.63)#5 | 1.61%(+3.68)#697 |
| 6. | West Miami | 4.81% | 0.66%(+4.15)#6 | 1.61%(+3.21)#782 |
| 7. | Orlovista | 4.22% | 0.66%(+3.56)#7 | 1.61%(+2.61)#915 |
| 8. | Ave Maria | 4.04% | 0.66%(+3.38)#8 | 1.61%(+2.43)#951 |
| 9. | Highland Park | 3.93% | 0.66%(+3.27)#9 | 1.61%(+2.32)#980 |
| 10. | Heathrow | 3.83% | 0.66%(+3.16)#10 | 1.61%(+2.22)#1,015 |
| 11. | Florida Gulf Coast University | 3.80% | 0.66%(+3.13)#11 | 1.61%(+2.19)#1,020 |
| 12. | Flagler Beach | 3.59% | 0.66%(+2.93)#12 | 1.61%(+1.98)#1,079 |
| 13. | Cooper City | 3.51% | 0.66%(+2.85)#13 | 1.61%(+1.90)#1,098 |
| 14. | Ensley | 3.44% | 0.66%(+2.77)#14 | 1.61%(+1.83)#1,131 |
| 15. | Viera West | 3.33% | 0.66%(+2.67)#15 | 1.61%(+1.72)#1,169 |
| 16. | Lake Alfred | 3.28% | 0.66%(+2.62)#16 | 1.61%(+1.67)#1,186 |
| 17. | Southchase | 3.04% | 0.66%(+2.38)#17 | 1.61%(+1.43)#1,279 |
| 18. | The Crossings | 2.99% | 0.66%(+2.32)#18 | 1.61%(+1.38)#1,313 |
| 19. | Greenbriar | 2.97% | 0.66%(+2.31)#19 | 1.61%(+1.36)#1,318 |
| 20. | Wildwood | 2.88% | 0.66%(+2.22)#20 | 1.61%(+1.27)#1,347 |
| 21. | Gotha | 2.80% | 0.66%(+2.14)#21 | 1.61%(+1.20)#1,380 |
| 22. | Kendall | 2.73% | 0.66%(+2.07)#22 | 1.61%(+1.12)#1,428 |
| 23. | Jay | 2.72% | 0.66%(+2.05)#23 | 1.61%(+1.11)#1,435 |
| 24. | Viera East | 2.69% | 0.66%(+2.03)#24 | 1.61%(+1.09)#1,450 |
| 25. | Winter Garden | 2.68% | 0.66%(+2.01)#25 | 1.61%(+1.07)#1,461 |
| 26. | Three Lakes | 2.67% | 0.66%(+2.01)#26 | 1.61%(+1.06)#1,466 |
| 27. | Palmetto Bay | 2.60% | 0.66%(+1.93)#27 | 1.61%(+0.987)#1,506 |
| 28. | Pinecrest | 2.59% | 0.66%(+1.93)#28 | 1.61%(+0.984)#1,508 |
| 29. | Odessa | 2.51% | 0.66%(+1.85)#29 | 1.61%(+0.899)#1,573 |
| 30. | Jupiter Island | 2.42% | 0.66%(+1.76)#30 | 1.61%(+0.816)#1,624 |
| 31. | Lutz | 2.41% | 0.66%(+1.75)#31 | 1.61%(+0.806)#1,631 |
| 32. | Casselberry | 2.41% | 0.66%(+1.75)#32 | 1.61%(+0.801)#1,635 |
| 33. | Bay Lake | 2.38% | 0.66%(+1.72)#33 | 1.61%(+0.772)#1,661 |
| 34. | Weston | 2.37% | 0.66%(+1.70)#34 | 1.61%(+0.756)#1,678 |
| 35. | Horizon West | 2.35% | 0.66%(+1.69)#35 | 1.61%(+0.741)#1,686 |
| 36. | West Melbourne | 2.33% | 0.66%(+1.67)#36 | 1.61%(+0.723)#1,699 |
| 37. | Fish Hawk | 2.32% | 0.66%(+1.65)#37 | 1.61%(+0.707)#1,712 |
| 38. | Wesley Chapel | 2.29% | 0.66%(+1.63)#38 | 1.61%(+0.679)#1,732 |
| 39. | Bay Hill | 2.25% | 0.66%(+1.58)#39 | 1.61%(+0.637)#1,758 |
| 40. | Miramar | 2.18% | 0.66%(+1.51)#40 | 1.61%(+0.567)#1,804 |
| 41. | South Miami | 2.17% | 0.66%(+1.51)#41 | 1.61%(+0.560)#1,813 |
| 42. | Gainesville | 2.17% | 0.66%(+1.51)#42 | 1.61%(+0.560)#1,814 |
| 43. | Winter Park | 2.06% | 0.66%(+1.40)#43 | 1.61%(+0.452)#1,887 |
| 44. | Parkland | 2.06% | 0.66%(+1.39)#44 | 1.61%(+0.447)#1,892 |
| 45. | Doctor Phillips | 2.02% | 0.66%(+1.36)#45 | 1.61%(+0.411)#1,923 |
| 46. | Bellview | 2.00% | 0.66%(+1.34)#46 | 1.61%(+0.388)#1,944 |
| 47. | North Palm Beach | 1.99% | 0.66%(+1.32)#47 | 1.61%(+0.377)#1,962 |
| 48. | Coral Springs | 1.95% | 0.66%(+1.28)#48 | 1.61%(+0.337)#2,005 |
| 49. | Englewood | 1.94% | 0.66%(+1.28)#49 | 1.61%(+0.332)#2,007 |
| 50. | Alafaya | 1.87% | 0.66%(+1.21)#50 | 1.61%(+0.263)#2,072 |
| 51. | Pembroke Pines | 1.83% | 0.66%(+1.17)#51 | 1.61%(+0.221)#2,118 |
| 52. | Wellington | 1.82% | 0.66%(+1.16)#52 | 1.61%(+0.216)#2,123 |
| 53. | Connerton | 1.82% | 0.66%(+1.16)#53 | 1.61%(+0.209)#2,133 |
| 54. | Ruskin | 1.80% | 0.66%(+1.14)#54 | 1.61%(+0.188)#2,156 |
| 55. | Tavernier | 1.77% | 0.66%(+1.11)#55 | 1.61%(+0.160)#2,185 |
| 56. | Bagdad | 1.77% | 0.66%(+1.10)#56 | 1.61%(+0.158)#2,187 |
| 57. | Waldo | 1.76% | 0.66%(+1.10)#57 | 1.61%(+0.150)#2,193 |
| 58. | Lakewood Park | 1.75% | 0.66%(+1.09)#58 | 1.61%(+0.141)#2,211 |
| 59. | Silver Lake | 1.74% | 0.66%(+1.08)#59 | 1.61%(+0.134)#2,217 |
| 60. | Mulat | 1.72% | 0.66%(+1.06)#60 | 1.61%(+0.115)#2,242 |
| 61. | Country Walk | 1.72% | 0.66%(+1.06)#61 | 1.61%(+0.111)#2,249 |
| 62. | University Cdp Hillsborough County | 1.71% | 0.66%(+1.05)#62 | 1.61%(+0.102)#2,262 |
| 63. | Rainbow Park | 1.70% | 0.66%(+1.04)#63 | 1.61%(+0.091)#2,281 |
| 64. | Keystone | 1.66% | 0.66%(+1.000)#64 | 1.61%(+0.053)#2,327 |
| 65. | Orangetree | 1.64% | 0.66%(+0.982)#65 | 1.61%(+0.035)#2,352 |
| 66. | Ridge Wood Heights | 1.64% | 0.66%(+0.980)#66 | 1.61%(+0.033)#2,355 |
| 67. | Coral Gables | 1.64% | 0.66%(+0.976)#67 | 1.61%(+0.029)#2,362 |
| 68. | Astor | 1.63% | 0.66%(+0.972)#68 | 1.61%(+0.025)#2,368 |
| 69. | Williamsburg | 1.62% | 0.66%(+0.959)#69 | 1.61%(+0.013)#2,384 |
| 70. | Callahan | 1.57% | 0.66%(+0.904)#70 | 1.61%(-0.043)#2,442 |
| 71. | Williston | 1.54% | 0.66%(+0.882)#71 | 1.61%(-0.065)#2,463 |
| 72. | Davie | 1.51% | 0.66%(+0.848)#72 | 1.61%(-0.099)#2,516 |
| 73. | Belle Isle | 1.51% | 0.66%(+0.848)#73 | 1.61%(-0.099)#2,517 |
| 74. | Sunrise | 1.47% | 0.66%(+0.804)#74 | 1.61%(-0.143)#2,587 |
| 75. | Estero | 1.44% | 0.66%(+0.775)#75 | 1.61%(-0.172)#2,640 |
| 76. | Fanning Springs | 1.44% | 0.66%(+0.774)#76 | 1.61%(-0.173)#2,641 |
| 77. | North Miami Beach | 1.44% | 0.66%(+0.773)#77 | 1.61%(-0.174)#2,643 |
| 78. | Meadow Woods | 1.43% | 0.66%(+0.769)#78 | 1.61%(-0.178)#2,651 |
| 79. | Brent | 1.42% | 0.66%(+0.757)#79 | 1.61%(-0.189)#2,667 |
| 80. | Oviedo | 1.41% | 0.66%(+0.746)#80 | 1.61%(-0.200)#2,691 |
| 81. | Hunters Creek | 1.41% | 0.66%(+0.746)#81 | 1.61%(-0.201)#2,693 |
| 82. | Bay Pines | 1.36% | 0.66%(+0.700)#82 | 1.61%(-0.247)#2,759 |
| 83. | Edgewood | 1.34% | 0.66%(+0.677)#83 | 1.61%(-0.270)#2,792 |
| 84. | Fruit Cove | 1.34% | 0.66%(+0.677)#84 | 1.61%(-0.270)#2,793 |
| 85. | Indian Rocks Beach | 1.33% | 0.66%(+0.666)#85 | 1.61%(-0.280)#2,804 |
| 86. | Celebration | 1.32% | 0.66%(+0.660)#86 | 1.61%(-0.287)#2,812 |
| 87. | Lockhart | 1.30% | 0.66%(+0.637)#87 | 1.61%(-0.310)#2,850 |
| 88. | Southwest Ranches | 1.29% | 0.66%(+0.630)#88 | 1.61%(-0.317)#2,859 |
| 89. | Liberty Triangle | 1.29% | 0.66%(+0.628)#89 | 1.61%(-0.319)#2,868 |
| 90. | Indian River Shores | 1.27% | 0.66%(+0.604)#90 | 1.61%(-0.343)#2,899 |
| 91. | North Redington Beach | 1.26% | 0.66%(+0.598)#91 | 1.61%(-0.349)#2,917 |
| 92. | Key Vista | 1.26% | 0.66%(+0.596)#92 | 1.61%(-0.350)#2,924 |
| 93. | Orlando | 1.26% | 0.66%(+0.596)#93 | 1.61%(-0.351)#2,926 |
| 94. | Longwood | 1.25% | 0.66%(+0.592)#94 | 1.61%(-0.355)#2,935 |
| 95. | Watergate | 1.25% | 0.66%(+0.592)#95 | 1.61%(-0.355)#2,936 |
| 96. | Tallahassee | 1.25% | 0.66%(+0.590)#96 | 1.61%(-0.357)#2,940 |
| 97. | Belleair Bluffs | 1.21% | 0.66%(+0.550)#97 | 1.61%(-0.397)#3,021 |
| 98. | Oldsmar | 1.21% | 0.66%(+0.548)#98 | 1.61%(-0.399)#3,027 |
| 99. | Samsula Spruce Creek | 1.21% | 0.66%(+0.545)#99 | 1.61%(-0.402)#3,034 |
| 100. | Juno Ridge | 1.20% | 0.66%(+0.543)#100 | 1.61%(-0.404)#3,037 |
Common Questions
What are the Top 10 Cities with the Highest Percentage of Indian (Asian) Population in Florida?
Top 10 Cities with the Highest Percentage of Indian (Asian) Population in Florida are:
#1
46.81%
#2
5.83%
#3
5.40%
#4
5.29%
#5
4.81%
#6
4.22%
#7
3.93%
#8
3.83%
#9
3.59%
#10
3.51%
What city has the Highest Percentage of Indian (Asian) Population in Florida?
Trilby has the Highest Percentage of Indian (Asian) Population in Florida with 46.81%.
What is the Percentage of Indian (Asian) Population in the State of Florida?
Percentage of Indian (Asian) Population in Florida is 0.66%.
What is the Percentage of Indian (Asian) Population in the United States?
Percentage of Indian (Asian) Population in the United States is 1.61%.