Parrottsville, TN Map & Demographics
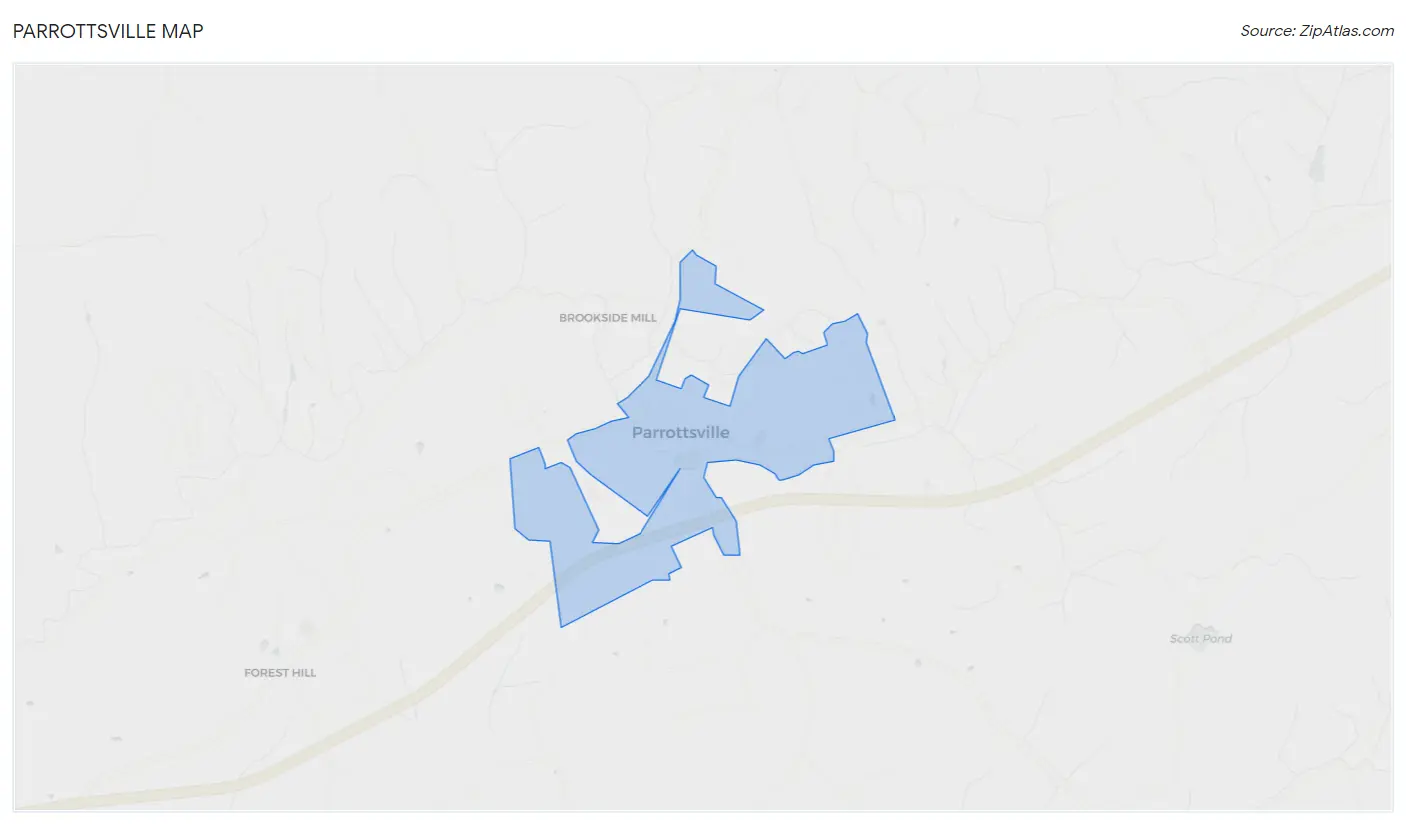
Parrottsville Map
Parrottsville Overview
$23,619
PER CAPITA INCOME
$67,273
AVG FAMILY INCOME
$45,987
AVG HOUSEHOLD INCOME
55.8%
WAGE / INCOME GAP [ % ]
44.2¢/ $1
WAGE / INCOME GAP [ $ ]
$17,775
FAMILY INCOME DEFICIT
0.36
INEQUALITY / GINI INDEX
351
TOTAL POPULATION
210
MALE POPULATION
141
FEMALE POPULATION
148.94
MALES / 100 FEMALES
67.14
FEMALES / 100 MALES
43.8
MEDIAN AGE
3.4
AVG FAMILY SIZE
2.5
AVG HOUSEHOLD SIZE
151
LABOR FORCE [ PEOPLE ]
52.4%
PERCENT IN LABOR FORCE
3.3%
UNEMPLOYMENT RATE
Parrottsville Zip Codes
Parrottsville Area Codes
Income in Parrottsville
Income Overview in Parrottsville
Per Capita Income in Parrottsville is $23,619, while median incomes of families and households are $67,273 and $45,987 respectively.
| Characteristic | Number | Measure |
| Per Capita Income | 351 | $23,619 |
| Median Family Income | 74 | $67,273 |
| Mean Family Income | 74 | $72,720 |
| Median Household Income | 141 | $45,987 |
| Mean Household Income | 141 | $54,979 |
| Income Deficit | 74 | $17,775 |
| Wage / Income Gap (%) | 351 | 55.83% |
| Wage / Income Gap ($) | 351 | 44.17¢ per $1 |
| Gini / Inequality Index | 351 | 0.36 |
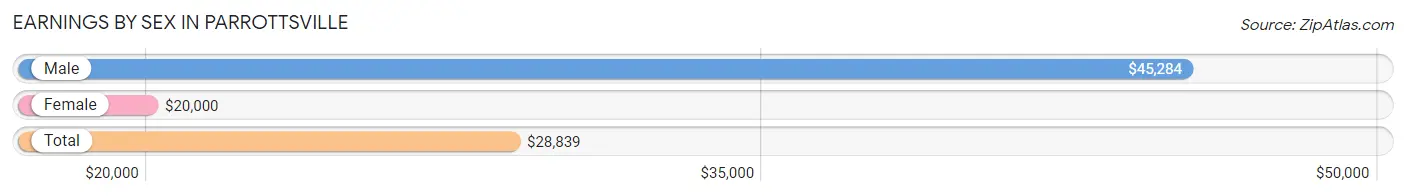
Earnings by Sex in Parrottsville
Average Earnings in Parrottsville are $28,839, $45,284 for men and $20,000 for women, a difference of 55.8%.
| Sex | Number | Average Earnings |
| Male | 109 (63.7%) | $45,284 |
| Female | 62 (36.3%) | $20,000 |
| Total | 171 (100.0%) | $28,839 |
Earnings by Sex by Income Bracket in Parrottsville
The most common earnings brackets in Parrottsville are $45,000 to $49,999 for men (25 | 22.9%) and $2,499 or less for women (16 | 25.8%).
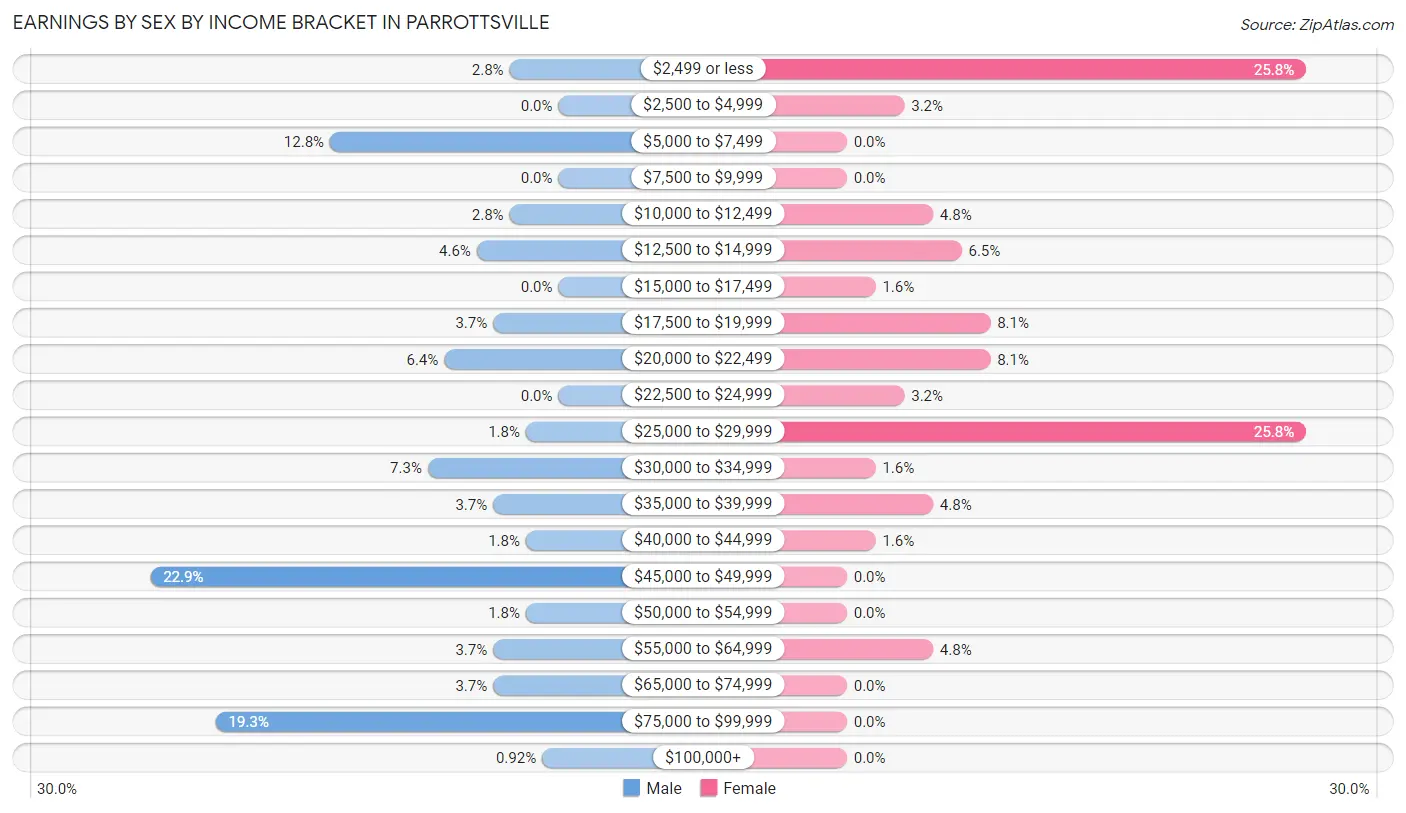
| Income | Male | Female |
| $2,499 or less | 3 (2.8%) | 16 (25.8%) |
| $2,500 to $4,999 | 0 (0.0%) | 2 (3.2%) |
| $5,000 to $7,499 | 14 (12.8%) | 0 (0.0%) |
| $7,500 to $9,999 | 0 (0.0%) | 0 (0.0%) |
| $10,000 to $12,499 | 3 (2.8%) | 3 (4.8%) |
| $12,500 to $14,999 | 5 (4.6%) | 4 (6.5%) |
| $15,000 to $17,499 | 0 (0.0%) | 1 (1.6%) |
| $17,500 to $19,999 | 4 (3.7%) | 5 (8.1%) |
| $20,000 to $22,499 | 7 (6.4%) | 5 (8.1%) |
| $22,500 to $24,999 | 0 (0.0%) | 2 (3.2%) |
| $25,000 to $29,999 | 2 (1.8%) | 16 (25.8%) |
| $30,000 to $34,999 | 8 (7.3%) | 1 (1.6%) |
| $35,000 to $39,999 | 4 (3.7%) | 3 (4.8%) |
| $40,000 to $44,999 | 2 (1.8%) | 1 (1.6%) |
| $45,000 to $49,999 | 25 (22.9%) | 0 (0.0%) |
| $50,000 to $54,999 | 2 (1.8%) | 0 (0.0%) |
| $55,000 to $64,999 | 4 (3.7%) | 3 (4.8%) |
| $65,000 to $74,999 | 4 (3.7%) | 0 (0.0%) |
| $75,000 to $99,999 | 21 (19.3%) | 0 (0.0%) |
| $100,000+ | 1 (0.9%) | 0 (0.0%) |
| Total | 109 (100.0%) | 62 (100.0%) |
Earnings by Sex by Educational Attainment in Parrottsville
Average earnings in Parrottsville are $43,750 for men and $20,750 for women, a difference of 52.6%. Men with an educational attainment of graduate degree enjoy the highest average annual earnings of $66,250, while those with college or associate's degree education earn the least with $31,406. Women with an educational attainment of high school diploma earn the most with the average annual earnings of $25,625, while those with bachelor's degree education have the smallest earnings of $2,499.
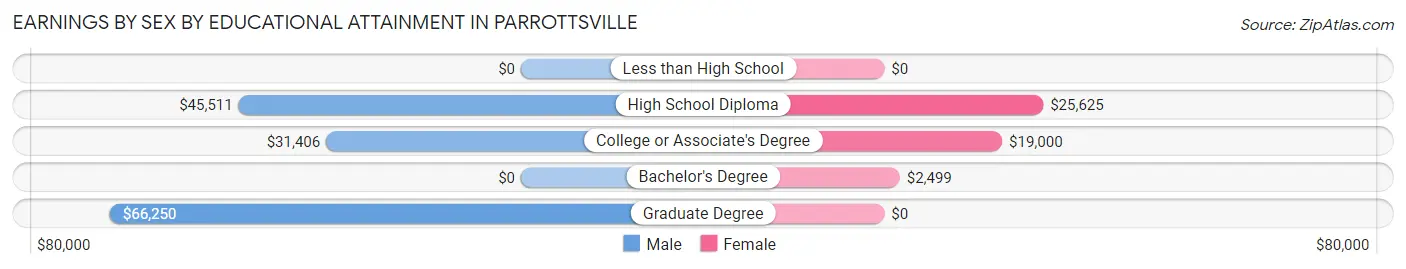
| Educational Attainment | Male Income | Female Income |
| Less than High School | - | - |
| High School Diploma | $45,511 | $25,625 |
| College or Associate's Degree | $31,406 | $19,000 |
| Bachelor's Degree | - | - |
| Graduate Degree | $66,250 | $0 |
| Total | $43,750 | $20,750 |
Family Income in Parrottsville
Family Income Brackets in Parrottsville
According to the Parrottsville family income data, there are 21 families falling into the $50,000 to $74,999 income range, which is the most common income bracket and makes up 28.4% of all families.
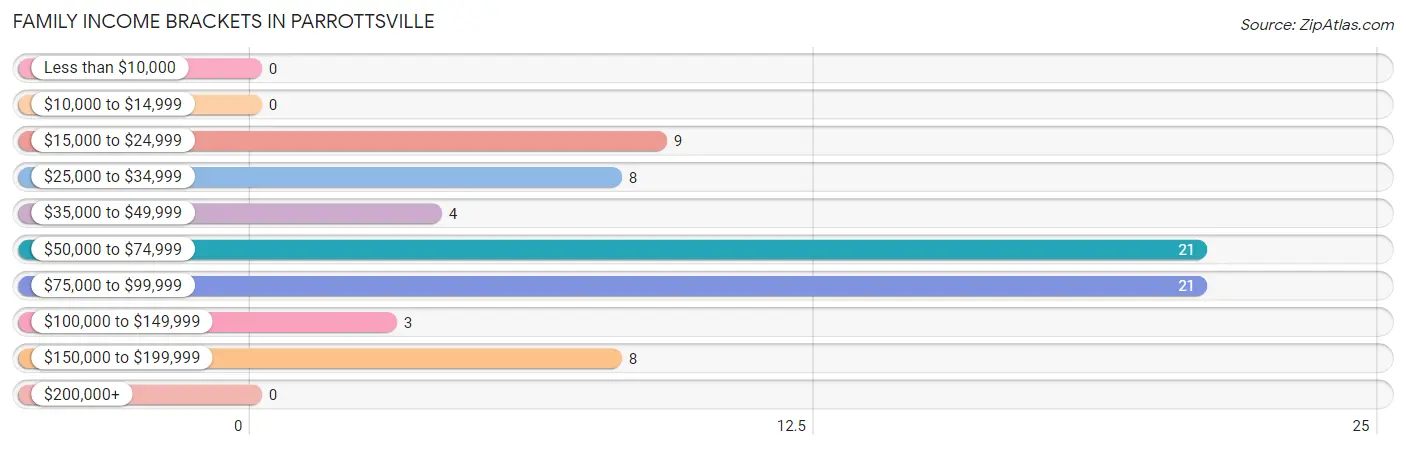
| Income Bracket | # Families | % Families |
| Less than $10,000 | 0 | 0.0% |
| $10,000 to $14,999 | 0 | 0.0% |
| $15,000 to $24,999 | 9 | 12.2% |
| $25,000 to $34,999 | 8 | 10.8% |
| $35,000 to $49,999 | 4 | 5.4% |
| $50,000 to $74,999 | 21 | 28.4% |
| $75,000 to $99,999 | 21 | 28.4% |
| $100,000 to $149,999 | 3 | 4.1% |
| $150,000 to $199,999 | 8 | 10.8% |
| $200,000+ | 0 | 0.0% |
Family Income by Famaliy Size in Parrottsville
2-person families (43 | 58.1%) account for the highest median family income in Parrottsville with $80,446 per family, while 2-person families (43 | 58.1%) have the highest median income of $40,223 per family member.
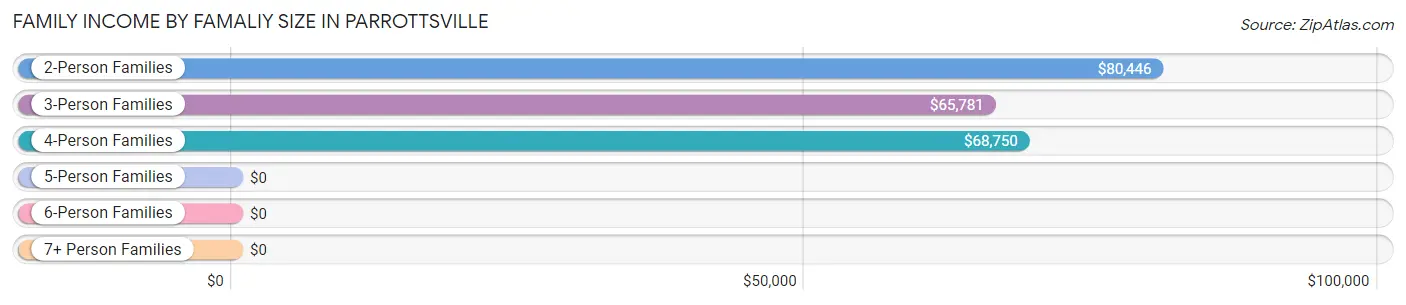
| Income Bracket | # Families | Median Income |
| 2-Person Families | 43 (58.1%) | $80,446 |
| 3-Person Families | 17 (23.0%) | $65,781 |
| 4-Person Families | 7 (9.5%) | $68,750 |
| 5-Person Families | 1 (1.3%) | $0 |
| 6-Person Families | 2 (2.7%) | $0 |
| 7+ Person Families | 4 (5.4%) | $0 |
| Total | 74 (100.0%) | $67,273 |
Family Income by Number of Earners in Parrottsville
The median family income in Parrottsville is $67,273, with families comprising 2 earners (19) having the highest median family income of $118,750, while families with no earners (6) have the lowest median family income of $31,250, accounting for 25.7% and 8.1% of families, respectively.
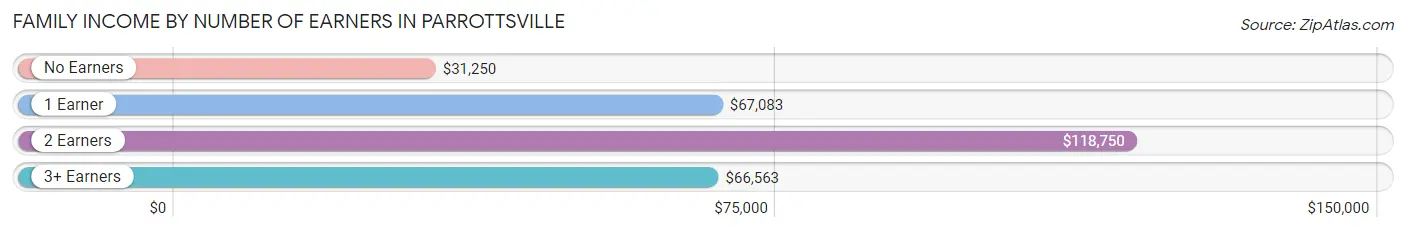
| Number of Earners | # Families | Median Income |
| No Earners | 6 (8.1%) | $31,250 |
| 1 Earner | 37 (50.0%) | $67,083 |
| 2 Earners | 19 (25.7%) | $118,750 |
| 3+ Earners | 12 (16.2%) | $66,563 |
| Total | 74 (100.0%) | $67,273 |
Household Income in Parrottsville
Household Income Brackets in Parrottsville
With 35 households falling in the category, the $35,000 to $49,999 income range is the most frequent in Parrottsville, accounting for 24.8% of all households.
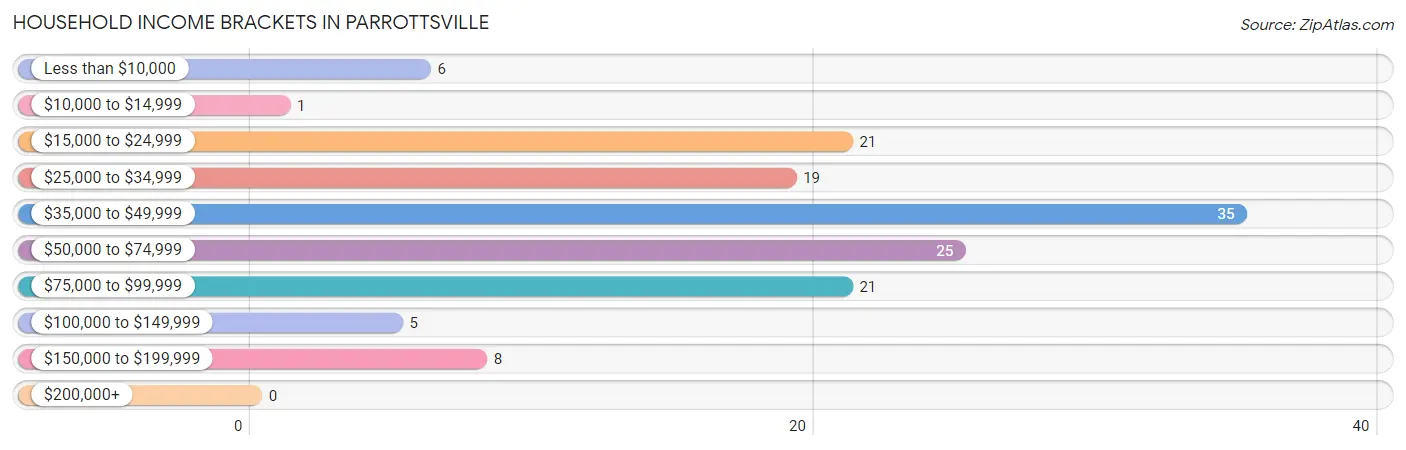
| Income Bracket | # Households | % Households |
| Less than $10,000 | 6 | 4.3% |
| $10,000 to $14,999 | 1 | 0.7% |
| $15,000 to $24,999 | 21 | 14.9% |
| $25,000 to $34,999 | 19 | 13.5% |
| $35,000 to $49,999 | 35 | 24.8% |
| $50,000 to $74,999 | 25 | 17.7% |
| $75,000 to $99,999 | 21 | 14.9% |
| $100,000 to $149,999 | 5 | 3.5% |
| $150,000 to $199,999 | 8 | 5.7% |
| $200,000+ | 0 | 0.0% |
Household Income by Householder Age in Parrottsville
The median household income in Parrottsville is $45,987, with the highest median household income of $45,263 found in the 25 to 44 years age bracket for the primary householder. A total of 42 households (29.8%) fall into this category. Meanwhile, the 15 to 24 years age bracket for the primary householder has the lowest median household income of $0, with 9 households (6.4%) in this group.
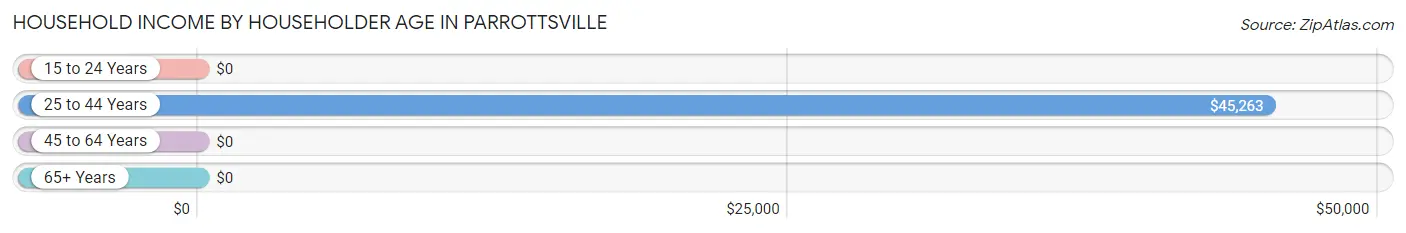
| Income Bracket | # Households | Median Income |
| 15 to 24 Years | 9 (6.4%) | $0 |
| 25 to 44 Years | 42 (29.8%) | $45,263 |
| 45 to 64 Years | 49 (34.7%) | $0 |
| 65+ Years | 41 (29.1%) | $0 |
| Total | 141 (100.0%) | $45,987 |
Poverty in Parrottsville
Income Below Poverty by Sex and Age in Parrottsville
With 28.6% poverty level for males and 22.3% for females among the residents of Parrottsville, 5 year old males and 18 to 24 year old females are the most vulnerable to poverty, with 5 males (100.0%) and 6 females (75.0%) in their respective age groups living below the poverty level.
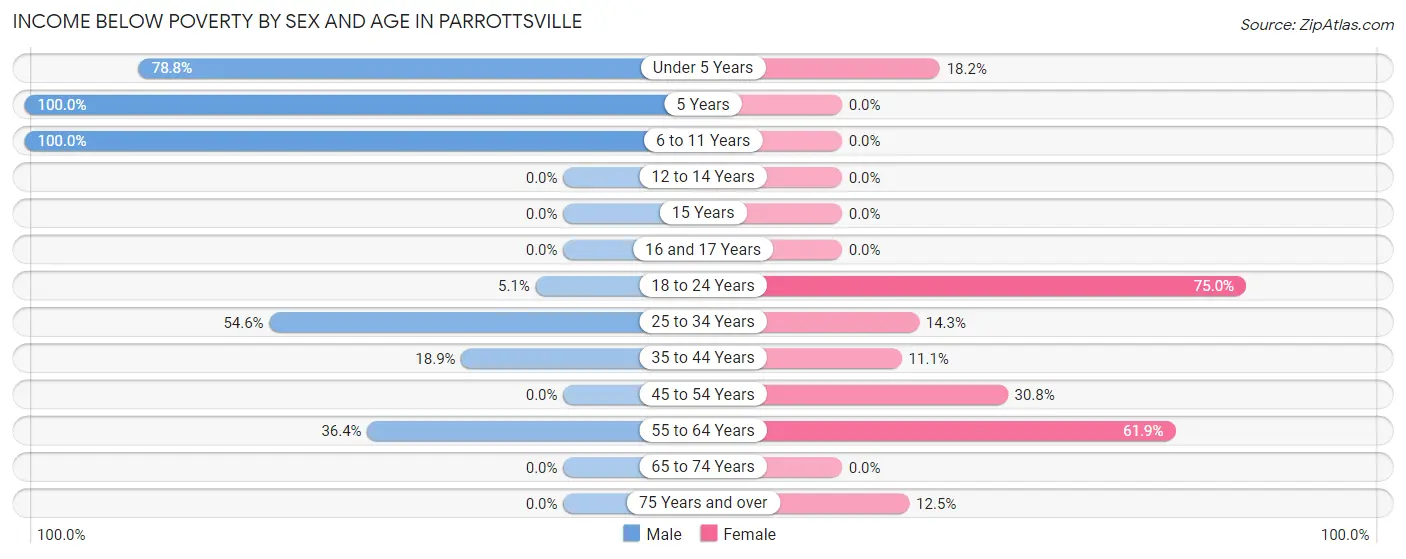
| Age Bracket | Male | Female |
| Under 5 Years | 26 (78.8%) | 2 (18.2%) |
| 5 Years | 5 (100.0%) | 0 (0.0%) |
| 6 to 11 Years | 2 (100.0%) | 0 (0.0%) |
| 12 to 14 Years | 0 (0.0%) | 0 (0.0%) |
| 15 Years | 0 (0.0%) | 0 (0.0%) |
| 16 and 17 Years | 0 (0.0%) | 0 (0.0%) |
| 18 to 24 Years | 2 (5.1%) | 6 (75.0%) |
| 25 to 34 Years | 6 (54.5%) | 2 (14.3%) |
| 35 to 44 Years | 7 (18.9%) | 2 (11.1%) |
| 45 to 54 Years | 0 (0.0%) | 4 (30.8%) |
| 55 to 64 Years | 12 (36.4%) | 13 (61.9%) |
| 65 to 74 Years | 0 (0.0%) | 0 (0.0%) |
| 75 Years and over | 0 (0.0%) | 2 (12.5%) |
| Total | 60 (28.6%) | 31 (22.3%) |
Income Above Poverty by Sex and Age in Parrottsville
According to the poverty statistics in Parrottsville, males aged 16 and 17 years and females aged 6 to 11 years are the age groups that are most secure financially, with 100.0% of males and 100.0% of females in these age groups living above the poverty line.
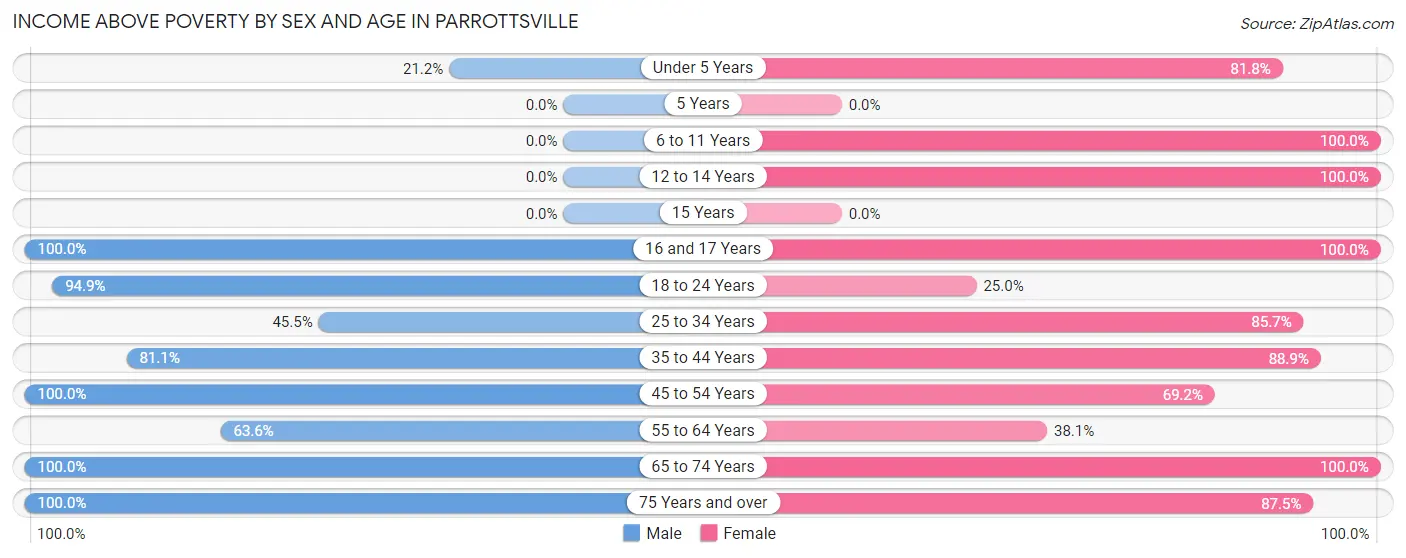
| Age Bracket | Male | Female |
| Under 5 Years | 7 (21.2%) | 9 (81.8%) |
| 5 Years | 0 (0.0%) | 0 (0.0%) |
| 6 to 11 Years | 0 (0.0%) | 6 (100.0%) |
| 12 to 14 Years | 0 (0.0%) | 4 (100.0%) |
| 15 Years | 0 (0.0%) | 0 (0.0%) |
| 16 and 17 Years | 2 (100.0%) | 4 (100.0%) |
| 18 to 24 Years | 37 (94.9%) | 2 (25.0%) |
| 25 to 34 Years | 5 (45.5%) | 12 (85.7%) |
| 35 to 44 Years | 30 (81.1%) | 16 (88.9%) |
| 45 to 54 Years | 21 (100.0%) | 9 (69.2%) |
| 55 to 64 Years | 21 (63.6%) | 8 (38.1%) |
| 65 to 74 Years | 14 (100.0%) | 24 (100.0%) |
| 75 Years and over | 13 (100.0%) | 14 (87.5%) |
| Total | 150 (71.4%) | 108 (77.7%) |
Income Below Poverty Among Married-Couple Families in Parrottsville
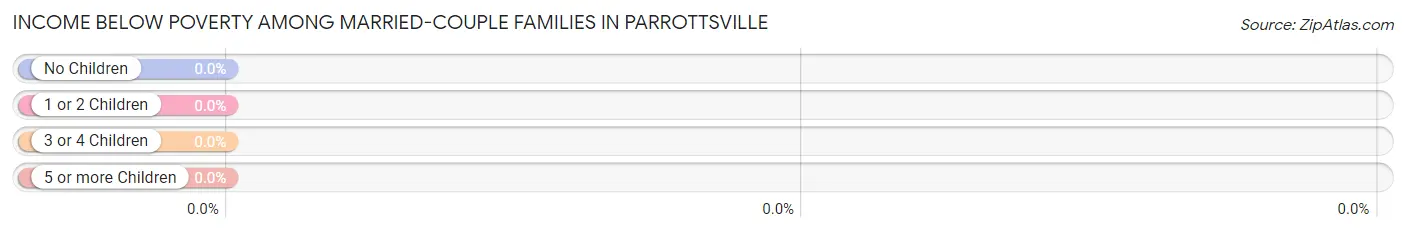
| Children | Above Poverty | Below Poverty |
| No Children | 43 (100.0%) | 0 (0.0%) |
| 1 or 2 Children | 6 (100.0%) | 0 (0.0%) |
| 3 or 4 Children | 2 (100.0%) | 0 (0.0%) |
| 5 or more Children | 0 (0.0%) | 0 (0.0%) |
| Total | 51 (100.0%) | 0 (0.0%) |
Income Below Poverty Among Single-Parent Households in Parrottsville
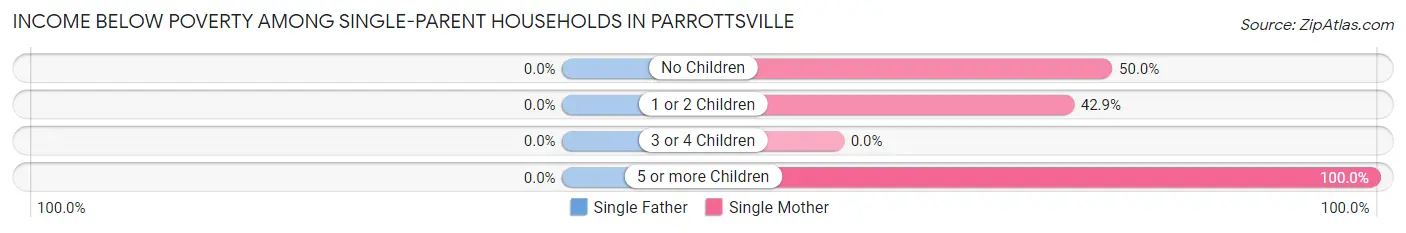
| Children | Single Father | Single Mother |
| No Children | 0 (0.0%) | 1 (50.0%) |
| 1 or 2 Children | 0 (0.0%) | 3 (42.9%) |
| 3 or 4 Children | 0 (0.0%) | 0 (0.0%) |
| 5 or more Children | 0 (0.0%) | 4 (100.0%) |
| Total | 0 (0.0%) | 8 (61.5%) |
Income Below Poverty Among Married-Couple vs Single-Parent Households in Parrottsville
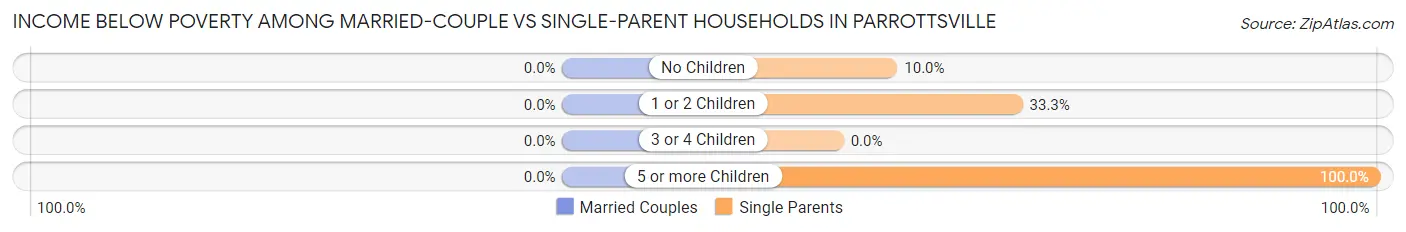
| Children | Married-Couple Families | Single-Parent Households |
| No Children | 0 (0.0%) | 1 (10.0%) |
| 1 or 2 Children | 0 (0.0%) | 3 (33.3%) |
| 3 or 4 Children | 0 (0.0%) | 0 (0.0%) |
| 5 or more Children | 0 (0.0%) | 4 (100.0%) |
| Total | 0 (0.0%) | 8 (34.8%) |
Race in Parrottsville
The most populous races in Parrottsville are White / Caucasian (323 | 92.0%), Two or more Races (18 | 5.1%), and Hispanic or Latino (14 | 4.0%).
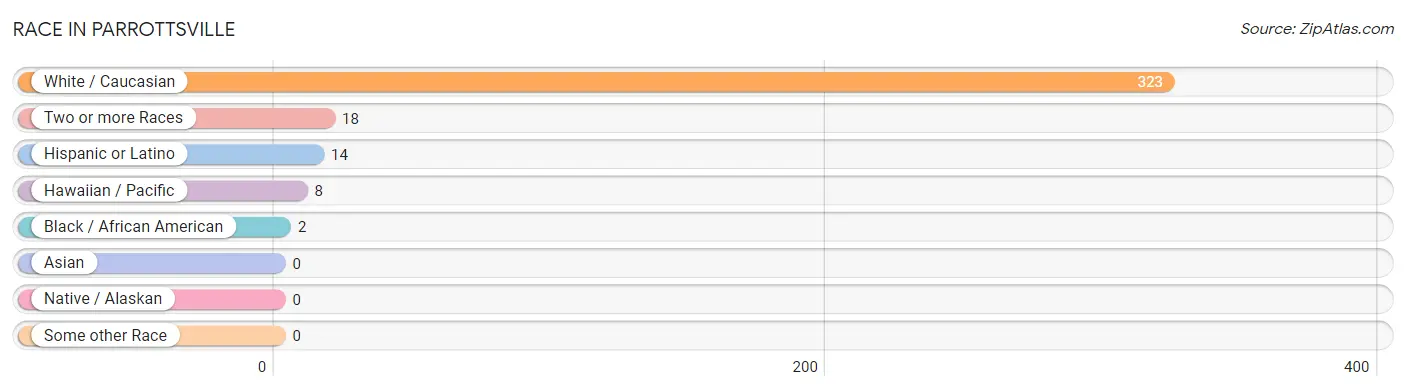
| Race | # Population | % Population |
| Asian | 0 | 0.0% |
| Black / African American | 2 | 0.6% |
| Hawaiian / Pacific | 8 | 2.3% |
| Hispanic or Latino | 14 | 4.0% |
| Native / Alaskan | 0 | 0.0% |
| White / Caucasian | 323 | 92.0% |
| Two or more Races | 18 | 5.1% |
| Some other Race | 0 | 0.0% |
| Total | 351 | 100.0% |
Ancestry in Parrottsville
The most populous ancestries reported in Parrottsville are American (52 | 14.8%), English (45 | 12.8%), German (28 | 8.0%), Irish (20 | 5.7%), and Italian (19 | 5.4%), together accounting for 46.7% of all Parrottsville residents.
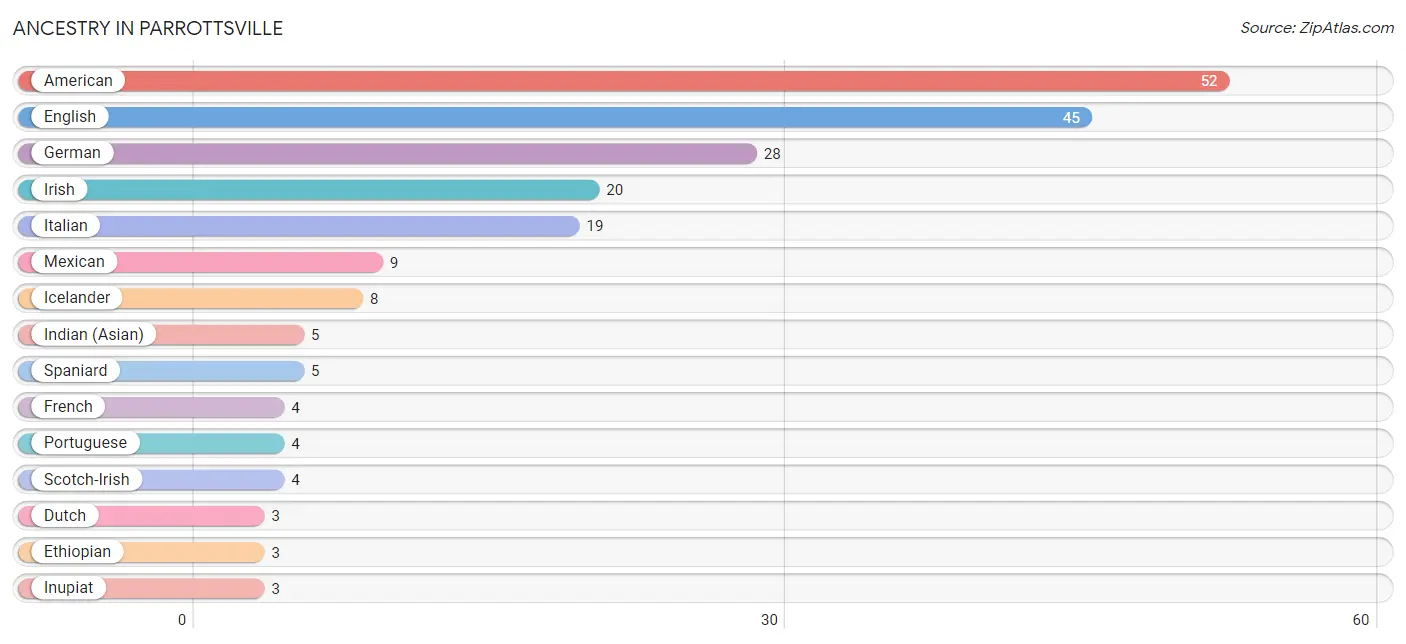
| Ancestry | # Population | % Population |
| Alsatian | 2 | 0.6% |
| American | 52 | 14.8% |
| Cherokee | 1 | 0.3% |
| Dutch | 3 | 0.9% |
| English | 45 | 12.8% |
| Ethiopian | 3 | 0.9% |
| European | 2 | 0.6% |
| French | 4 | 1.1% |
| German | 28 | 8.0% |
| Icelander | 8 | 2.3% |
| Indian (Asian) | 5 | 1.4% |
| Inupiat | 3 | 0.9% |
| Irish | 20 | 5.7% |
| Israeli | 3 | 0.9% |
| Italian | 19 | 5.4% |
| Korean | 2 | 0.6% |
| Lithuanian | 2 | 0.6% |
| Mexican | 9 | 2.6% |
| Native Hawaiian | 2 | 0.6% |
| Portuguese | 4 | 1.1% |
| Samoan | 3 | 0.9% |
| Scotch-Irish | 4 | 1.1% |
| Scottish | 2 | 0.6% |
| Spaniard | 5 | 1.4% |
| Sri Lankan | 2 | 0.6% |
| Subsaharan African | 3 | 0.9% |
| Thai | 2 | 0.6% |
| Welsh | 2 | 0.6% | View All 28 Rows |
Immigrants in Parrottsville

| Immigration Origin | # Population | % Population | View All 0 Rows |
Sex and Age in Parrottsville
Sex and Age in Parrottsville
The most populous age groups in Parrottsville are 20 to 24 Years (36 | 17.1%) for men and 70 to 74 Years (14 | 9.9%) for women.
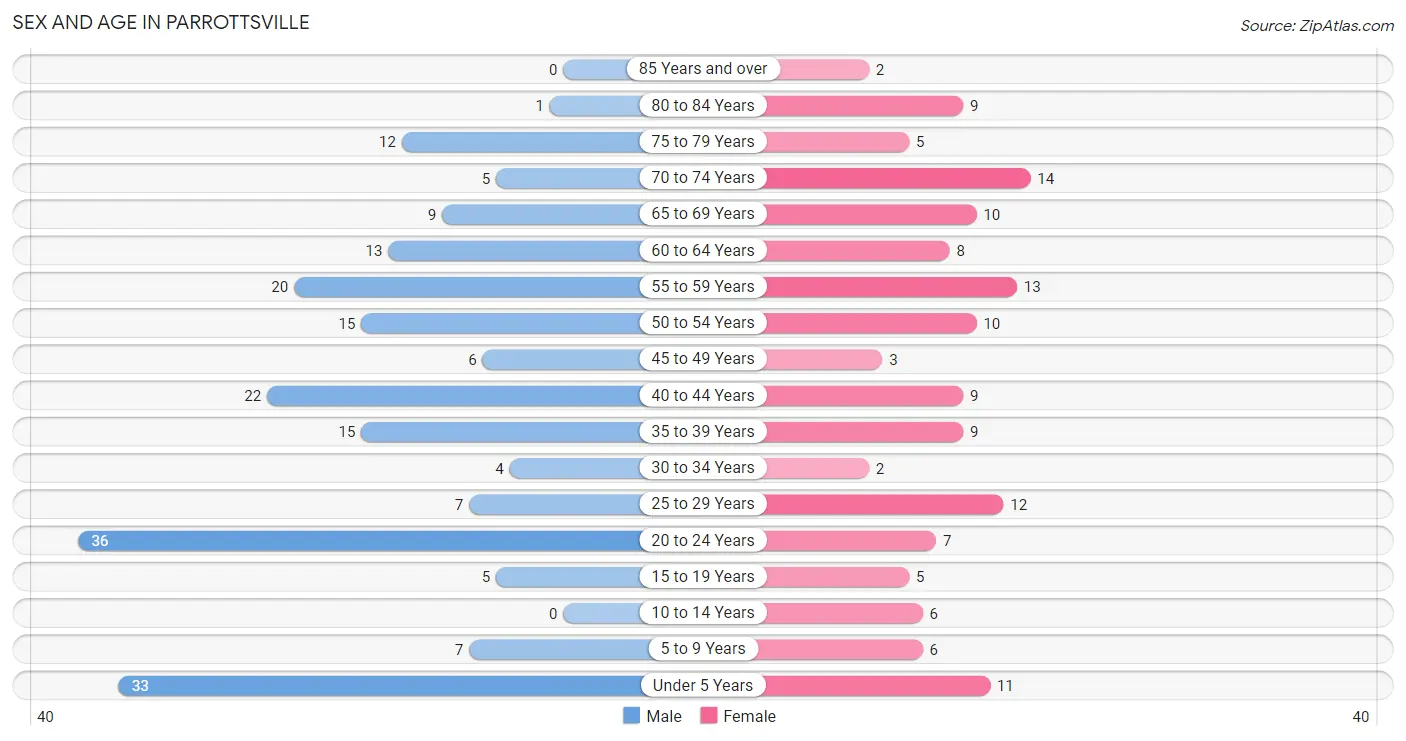
| Age Bracket | Male | Female |
| Under 5 Years | 33 (15.7%) | 11 (7.8%) |
| 5 to 9 Years | 7 (3.3%) | 6 (4.3%) |
| 10 to 14 Years | 0 (0.0%) | 6 (4.3%) |
| 15 to 19 Years | 5 (2.4%) | 5 (3.5%) |
| 20 to 24 Years | 36 (17.1%) | 7 (5.0%) |
| 25 to 29 Years | 7 (3.3%) | 12 (8.5%) |
| 30 to 34 Years | 4 (1.9%) | 2 (1.4%) |
| 35 to 39 Years | 15 (7.1%) | 9 (6.4%) |
| 40 to 44 Years | 22 (10.5%) | 9 (6.4%) |
| 45 to 49 Years | 6 (2.9%) | 3 (2.1%) |
| 50 to 54 Years | 15 (7.1%) | 10 (7.1%) |
| 55 to 59 Years | 20 (9.5%) | 13 (9.2%) |
| 60 to 64 Years | 13 (6.2%) | 8 (5.7%) |
| 65 to 69 Years | 9 (4.3%) | 10 (7.1%) |
| 70 to 74 Years | 5 (2.4%) | 14 (9.9%) |
| 75 to 79 Years | 12 (5.7%) | 5 (3.5%) |
| 80 to 84 Years | 1 (0.5%) | 9 (6.4%) |
| 85 Years and over | 0 (0.0%) | 2 (1.4%) |
| Total | 210 (100.0%) | 141 (100.0%) |
Families and Households in Parrottsville
Median Family Size in Parrottsville
The median family size in Parrottsville is 3.35 persons per family, with single female/mother families (13 | 17.6%) accounting for the largest median family size of 5.69 persons per family. On the other hand, single male/father families (10 | 13.5%) represent the smallest median family size with 2.80 persons per family.
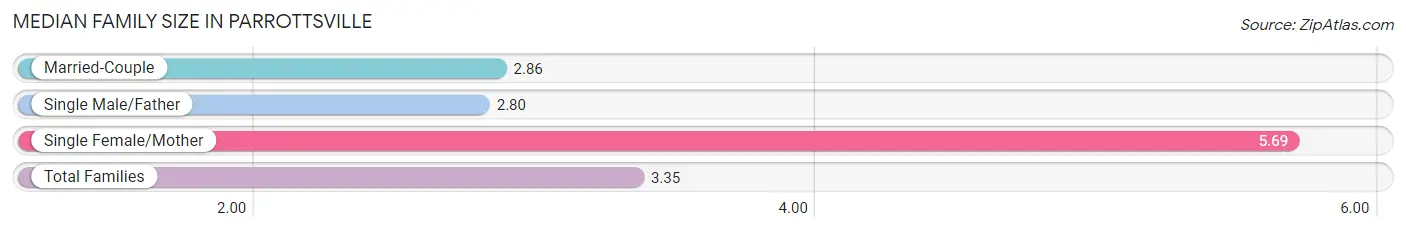
| Family Type | # Families | Family Size |
| Married-Couple | 51 (68.9%) | 2.86 |
| Single Male/Father | 10 (13.5%) | 2.80 |
| Single Female/Mother | 13 (17.6%) | 5.69 |
| Total Families | 74 (100.0%) | 3.35 |
Median Household Size in Parrottsville
The median household size in Parrottsville is 2.49 persons per household, with single female/mother households (13 | 9.2%) accounting for the largest median household size of 5.77 persons per household. non-family households (67 | 47.5%) represent the smallest median household size with 1.42 persons per household.
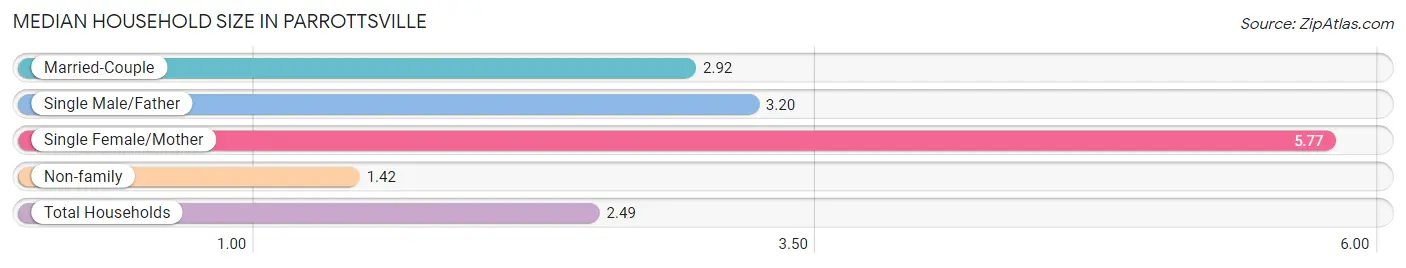
| Household Type | # Households | Household Size |
| Married-Couple | 51 (36.2%) | 2.92 |
| Single Male/Father | 10 (7.1%) | 3.20 |
| Single Female/Mother | 13 (9.2%) | 5.77 |
| Non-family | 67 (47.5%) | 1.42 |
| Total Households | 141 (100.0%) | 2.49 |
Household Size by Marriage Status in Parrottsville
Out of a total of 141 households in Parrottsville, 74 (52.5%) are family households, while 67 (47.5%) are nonfamily households. The most numerous type of family households are 2-person households, comprising 41, and the most common type of nonfamily households are 1-person households, comprising 54.
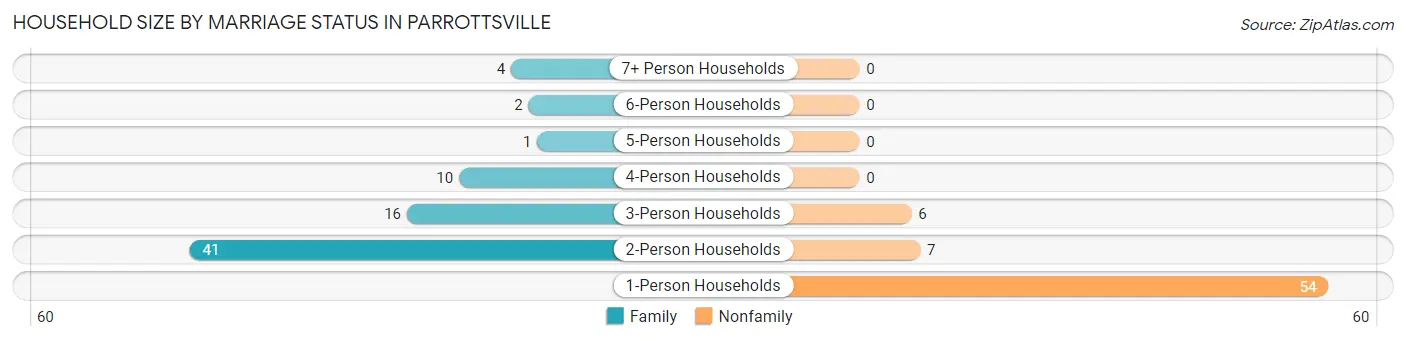
| Household Size | Family Households | Nonfamily Households |
| 1-Person Households | - | 54 (38.3%) |
| 2-Person Households | 41 (29.1%) | 7 (5.0%) |
| 3-Person Households | 16 (11.4%) | 6 (4.3%) |
| 4-Person Households | 10 (7.1%) | 0 (0.0%) |
| 5-Person Households | 1 (0.7%) | 0 (0.0%) |
| 6-Person Households | 2 (1.4%) | 0 (0.0%) |
| 7+ Person Households | 4 (2.8%) | 0 (0.0%) |
| Total | 74 (52.5%) | 67 (47.5%) |
Female Fertility in Parrottsville
Fertility by Age in Parrottsville
Average fertility rate in Parrottsville is 128.0 births per 1,000 women. Women in the age bracket of 20 to 34 years have the highest fertility rate with 286.0 births per 1,000 women. Women in the age bracket of 20 to 34 years acount for 100.0% of all women with births.
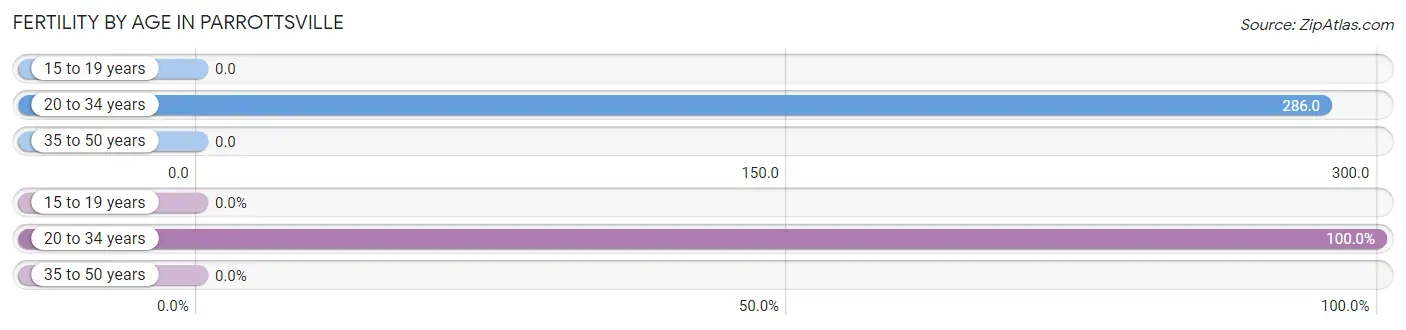
| Age Bracket | Women with Births | Births / 1,000 Women |
| 15 to 19 years | 0 (0.0%) | 0.0 |
| 20 to 34 years | 6 (100.0%) | 286.0 |
| 35 to 50 years | 0 (0.0%) | 0.0 |
| Total | 6 (100.0%) | 128.0 |
Fertility by Age by Marriage Status in Parrottsville
16.7% of women with births (6) in Parrottsville are married. The highest percentage of unmarried women with births falls into 20 to 34 years age bracket with 83.3% of them unmarried at the time of birth, while the lowest percentage of unmarried women with births belong to 20 to 34 years age bracket with 83.3% of them unmarried.
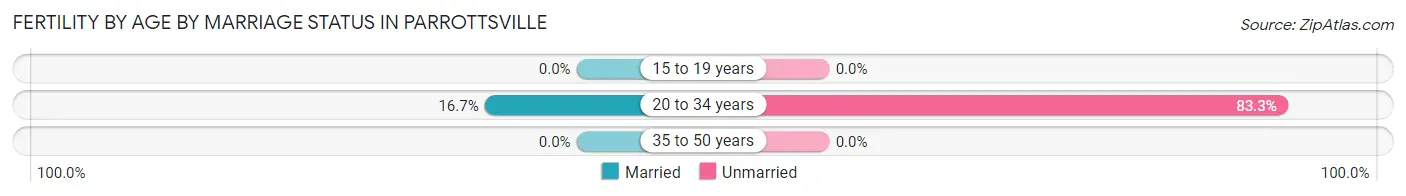
| Age Bracket | Married | Unmarried |
| 15 to 19 years | 0 (0.0%) | 0 (0.0%) |
| 20 to 34 years | 1 (16.7%) | 5 (83.3%) |
| 35 to 50 years | 0 (0.0%) | 0 (0.0%) |
| Total | 1 (16.7%) | 5 (83.3%) |
Fertility by Education in Parrottsville
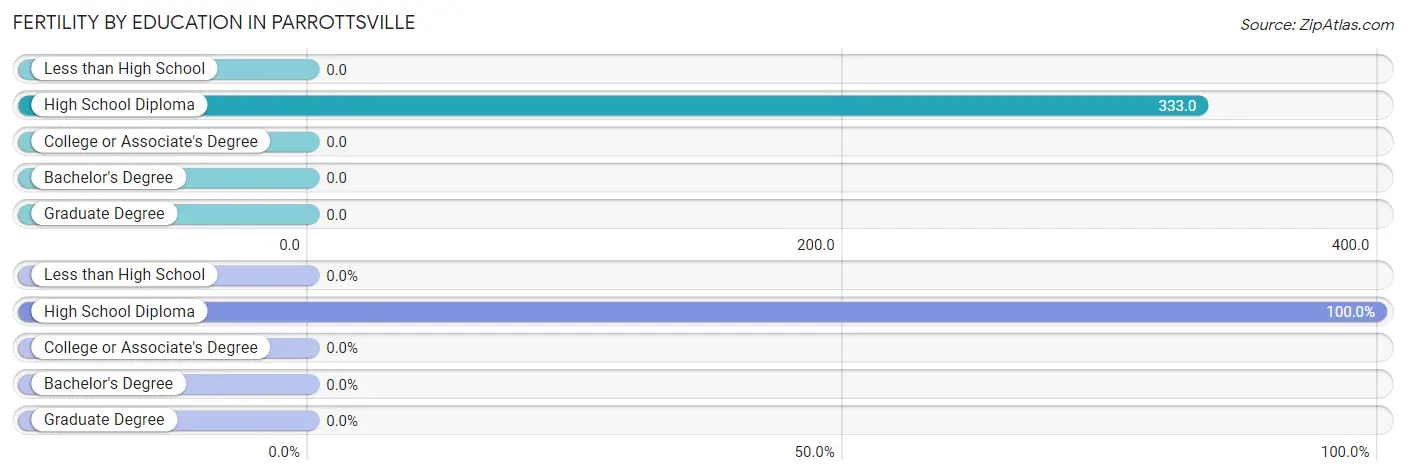
| Educational Attainment | Women with Births | Births / 1,000 Women |
| Less than High School | 0 (0.0%) | 0.0 |
| High School Diploma | 6 (100.0%) | 333.0 |
| College or Associate's Degree | 0 (0.0%) | 0.0 |
| Bachelor's Degree | 0 (0.0%) | 0.0 |
| Graduate Degree | 0 (0.0%) | 0.0 |
| Total | 6 (100.0%) | 128.0 |
Fertility by Education by Marriage Status in Parrottsville
83.3% of women with births in Parrottsville are unmarried. Women with the educational attainment of high school diploma are most likely to be married with 16.7% of them married at childbirth, while women with the educational attainment of high school diploma are least likely to be married with 83.3% of them unmarried at childbirth.
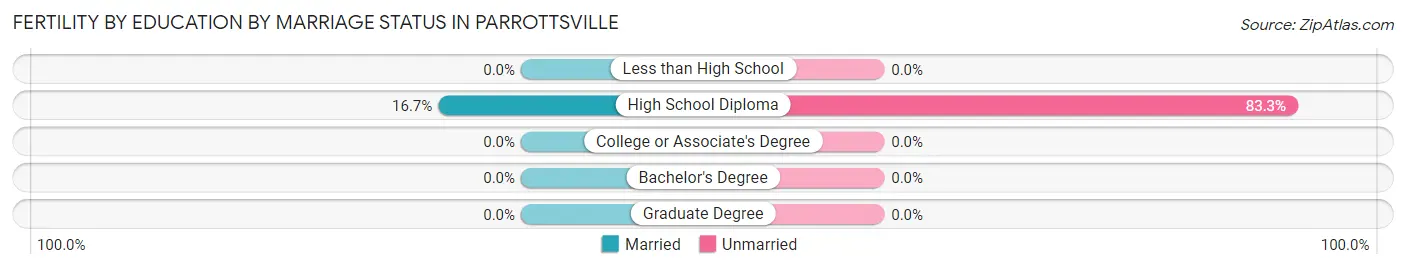
| Educational Attainment | Married | Unmarried |
| Less than High School | 0 (0.0%) | 0 (0.0%) |
| High School Diploma | 1 (16.7%) | 5 (83.3%) |
| College or Associate's Degree | 0 (0.0%) | 0 (0.0%) |
| Bachelor's Degree | 0 (0.0%) | 0 (0.0%) |
| Graduate Degree | 0 (0.0%) | 0 (0.0%) |
| Total | 1 (16.7%) | 5 (83.3%) |
Employment Characteristics in Parrottsville
Employment by Class of Employer in Parrottsville
Among the 146 employed individuals in Parrottsville, private company employees (117 | 80.1%), local government employees (15 | 10.3%), and not-for-profit organizations (10 | 6.9%) make up the most common classes of employment.
| Employer Class | # Employees | % Employees |
| Private Company Employees | 117 | 80.1% |
| Self-Employed (Incorporated) | 2 | 1.4% |
| Self-Employed (Not Incorporated) | 1 | 0.7% |
| Not-for-profit Organizations | 10 | 6.9% |
| Local Government Employees | 15 | 10.3% |
| State Government Employees | 1 | 0.7% |
| Federal Government Employees | 0 | 0.0% |
| Unpaid Family Workers | 0 | 0.0% |
| Total | 146 | 100.0% |
Employment Status by Age in Parrottsville
According to the labor force statistics for Parrottsville, out of the total population over 16 years of age (288), 52.4% or 151 individuals are in the labor force, with 3.3% or 5 of them unemployed. The age group with the highest labor force participation rate is 25 to 29 years, with 89.5% or 17 individuals in the labor force. Within the labor force, the 65 to 74 years age range has the highest percentage of unemployed individuals, with 42.9% or 3 of them being unemployed.
| Age Bracket | In Labor Force | Unemployed |
| 16 to 19 Years | 6 (60.0%) | 0 (0.0%) |
| 20 to 24 Years | 33 (76.7%) | 2 (6.1%) |
| 25 to 29 Years | 17 (89.5%) | 0 (0.0%) |
| 30 to 34 Years | 2 (33.3%) | 0 (0.0%) |
| 35 to 44 Years | 49 (89.1%) | 0 (0.0%) |
| 45 to 54 Years | 23 (67.6%) | 0 (0.0%) |
| 55 to 59 Years | 12 (36.4%) | 0 (0.0%) |
| 60 to 64 Years | 2 (9.5%) | 0 (0.0%) |
| 65 to 74 Years | 7 (18.4%) | 3 (42.9%) |
| 75 Years and over | 0 (0.0%) | 0 (0.0%) |
| Total | 151 (52.4%) | 5 (3.3%) |
Employment Status by Educational Attainment in Parrottsville
| Educational Attainment | In Labor Force | Unemployed |
| Less than High School | 1 (11.1%) | 0 (0.0%) |
| High School Diploma | 67 (67.0%) | 0 (0.0%) |
| College / Associate Degree | 27 (55.1%) | 0 (0.0%) |
| Bachelor's Degree or higher | 10 (100.0%) | 0 (0.0%) |
| Total | 105 (62.5%) | 0 (0.0%) |
Employment Occupations by Sex in Parrottsville
Management, Business, Science and Arts Occupations
The most common Management, Business, Science and Arts occupations in Parrottsville are Computers, Engineering & Science (20 | 13.7%), Architecture & Engineering (19 | 13.0%), Management (10 | 6.9%), Community & Social Service (8 | 5.5%), and Education Instruction & Library (4 | 2.7%).
Management, Business, Science and Arts Occupations by Sex
Within the Management, Business, Science and Arts occupations in Parrottsville, the most male-oriented occupations are Management (100.0%), Computers, Engineering & Science (100.0%), and Architecture & Engineering (100.0%), while the most female-oriented occupations are Business & Financial (100.0%), Education Instruction & Library (50.0%), and Community & Social Service (25.0%).
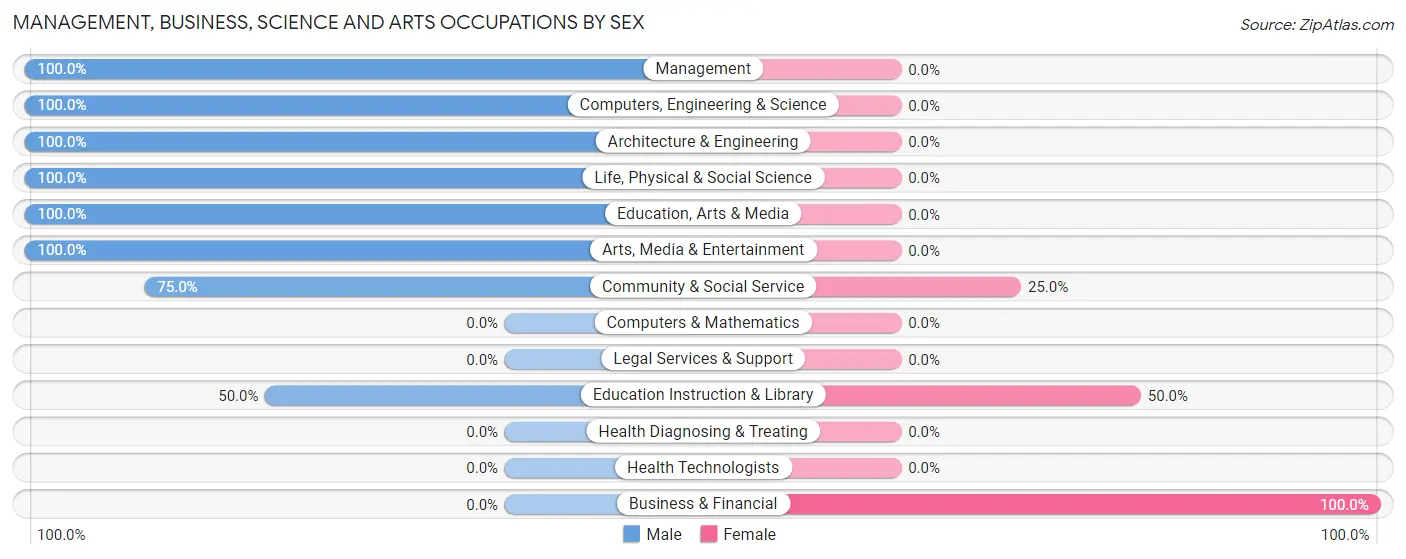
| Occupation | Male | Female |
| Management | 10 (100.0%) | 0 (0.0%) |
| Business & Financial | 0 (0.0%) | 1 (100.0%) |
| Computers, Engineering & Science | 20 (100.0%) | 0 (0.0%) |
| Computers & Mathematics | 0 (0.0%) | 0 (0.0%) |
| Architecture & Engineering | 19 (100.0%) | 0 (0.0%) |
| Life, Physical & Social Science | 1 (100.0%) | 0 (0.0%) |
| Community & Social Service | 6 (75.0%) | 2 (25.0%) |
| Education, Arts & Media | 3 (100.0%) | 0 (0.0%) |
| Legal Services & Support | 0 (0.0%) | 0 (0.0%) |
| Education Instruction & Library | 2 (50.0%) | 2 (50.0%) |
| Arts, Media & Entertainment | 1 (100.0%) | 0 (0.0%) |
| Health Diagnosing & Treating | 0 (0.0%) | 0 (0.0%) |
| Health Technologists | 0 (0.0%) | 0 (0.0%) |
| Total (Category) | 36 (92.3%) | 3 (7.7%) |
| Total (Overall) | 103 (70.6%) | 43 (29.4%) |
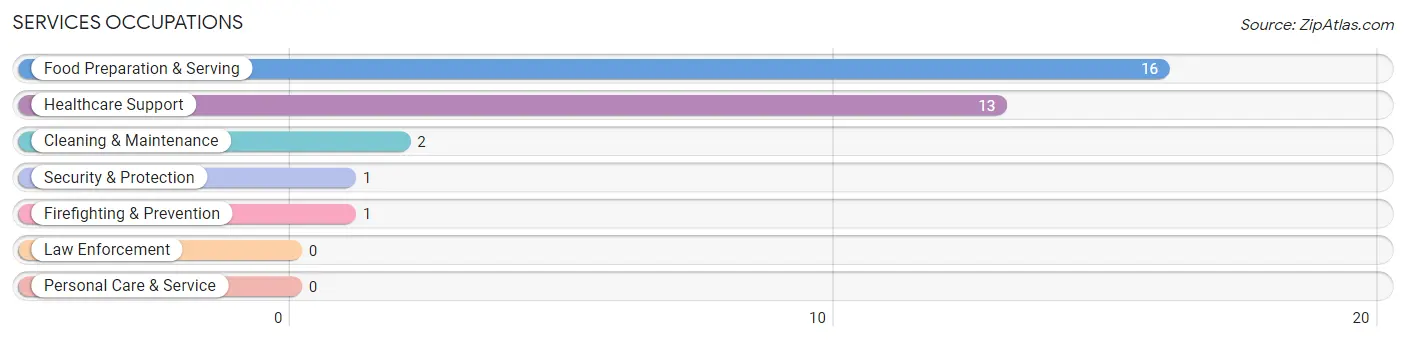
Services Occupations
The most common Services occupations in Parrottsville are Food Preparation & Serving (16 | 11.0%), Healthcare Support (13 | 8.9%), Cleaning & Maintenance (2 | 1.4%), Security & Protection (1 | 0.7%), and Firefighting & Prevention (1 | 0.7%).
Services Occupations by Sex
Within the Services occupations in Parrottsville, the most male-oriented occupations are Security & Protection (100.0%), Firefighting & Prevention (100.0%), and Cleaning & Maintenance (100.0%), while the most female-oriented occupations are Food Preparation & Serving (87.5%), and Healthcare Support (30.8%).
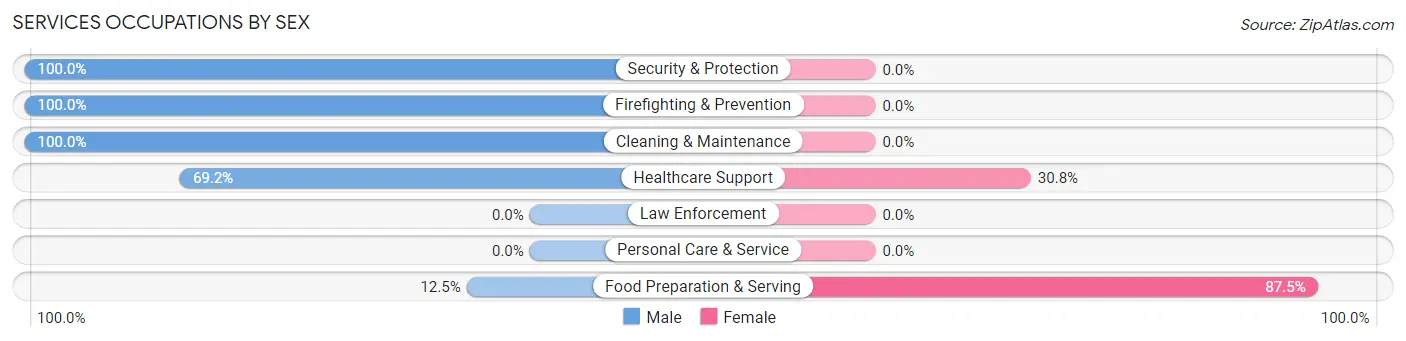
| Occupation | Male | Female |
| Healthcare Support | 9 (69.2%) | 4 (30.8%) |
| Security & Protection | 1 (100.0%) | 0 (0.0%) |
| Firefighting & Prevention | 1 (100.0%) | 0 (0.0%) |
| Law Enforcement | 0 (0.0%) | 0 (0.0%) |
| Food Preparation & Serving | 2 (12.5%) | 14 (87.5%) |
| Cleaning & Maintenance | 2 (100.0%) | 0 (0.0%) |
| Personal Care & Service | 0 (0.0%) | 0 (0.0%) |
| Total (Category) | 14 (43.8%) | 18 (56.2%) |
| Total (Overall) | 103 (70.6%) | 43 (29.4%) |
Sales and Office Occupations
The most common Sales and Office occupations in Parrottsville are Sales & Related (19 | 13.0%), and Office & Administration (12 | 8.2%).
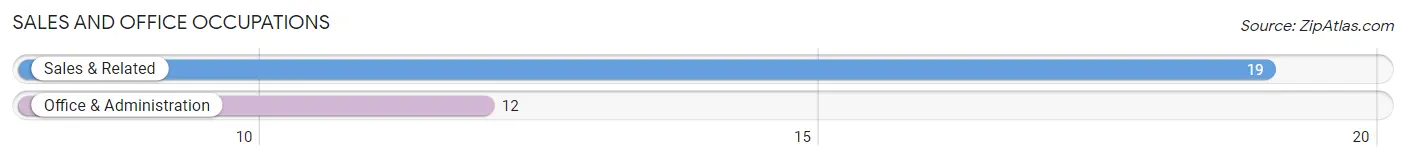
Sales and Office Occupations by Sex
| Occupation | Male | Female |
| Sales & Related | 15 (78.9%) | 4 (21.0%) |
| Office & Administration | 0 (0.0%) | 12 (100.0%) |
| Total (Category) | 15 (48.4%) | 16 (51.6%) |
| Total (Overall) | 103 (70.6%) | 43 (29.4%) |
Natural Resources, Construction and Maintenance Occupations
The most common Natural Resources, Construction and Maintenance occupations in Parrottsville are Farming, Fishing & Forestry (8 | 5.5%), and Construction & Extraction (1 | 0.7%).
Natural Resources, Construction and Maintenance Occupations by Sex
| Occupation | Male | Female |
| Farming, Fishing & Forestry | 8 (100.0%) | 0 (0.0%) |
| Construction & Extraction | 1 (100.0%) | 0 (0.0%) |
| Installation, Maintenance & Repair | 0 (0.0%) | 0 (0.0%) |
| Total (Category) | 9 (100.0%) | 0 (0.0%) |
| Total (Overall) | 103 (70.6%) | 43 (29.4%) |
Production, Transportation and Moving Occupations
The most common Production, Transportation and Moving occupations in Parrottsville are Production (28 | 19.2%), and Material Moving (7 | 4.8%).
Production, Transportation and Moving Occupations by Sex
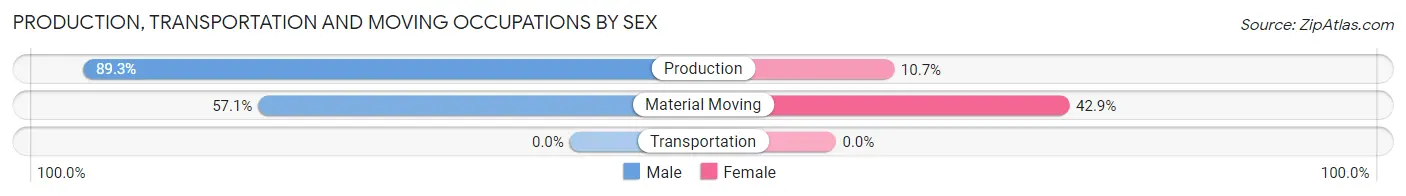
| Occupation | Male | Female |
| Production | 25 (89.3%) | 3 (10.7%) |
| Transportation | 0 (0.0%) | 0 (0.0%) |
| Material Moving | 4 (57.1%) | 3 (42.9%) |
| Total (Category) | 29 (82.9%) | 6 (17.1%) |
| Total (Overall) | 103 (70.6%) | 43 (29.4%) |
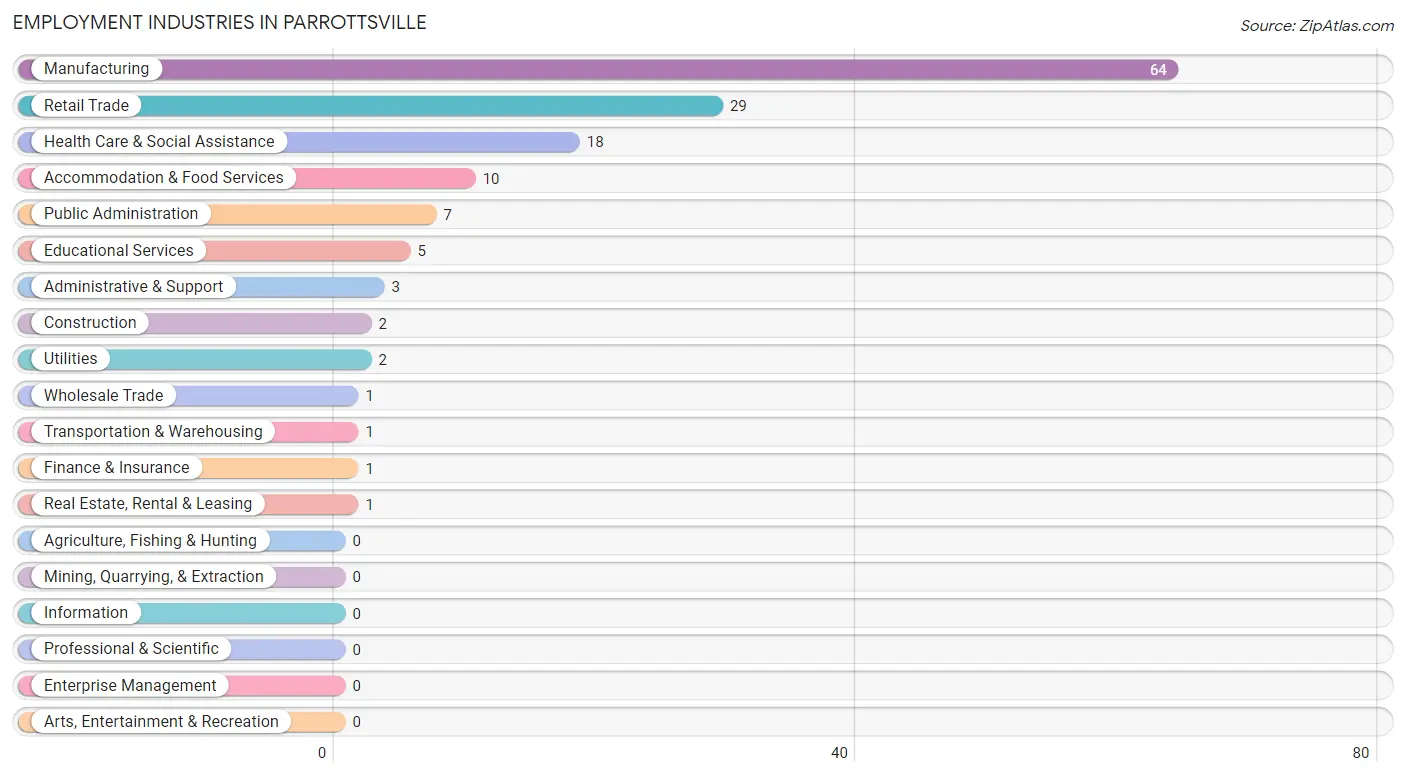
Employment Industries by Sex in Parrottsville
Employment Industries in Parrottsville
The major employment industries in Parrottsville include Manufacturing (64 | 43.8%), Retail Trade (29 | 19.9%), Health Care & Social Assistance (18 | 12.3%), Accommodation & Food Services (10 | 6.9%), and Public Administration (7 | 4.8%).
Employment Industries by Sex in Parrottsville
The Parrottsville industries that see more men than women are Construction (100.0%), Wholesale Trade (100.0%), and Transportation & Warehousing (100.0%), whereas the industries that tend to have a higher number of women are Real Estate, Rental & Leasing (100.0%), Accommodation & Food Services (80.0%), and Public Administration (71.4%).
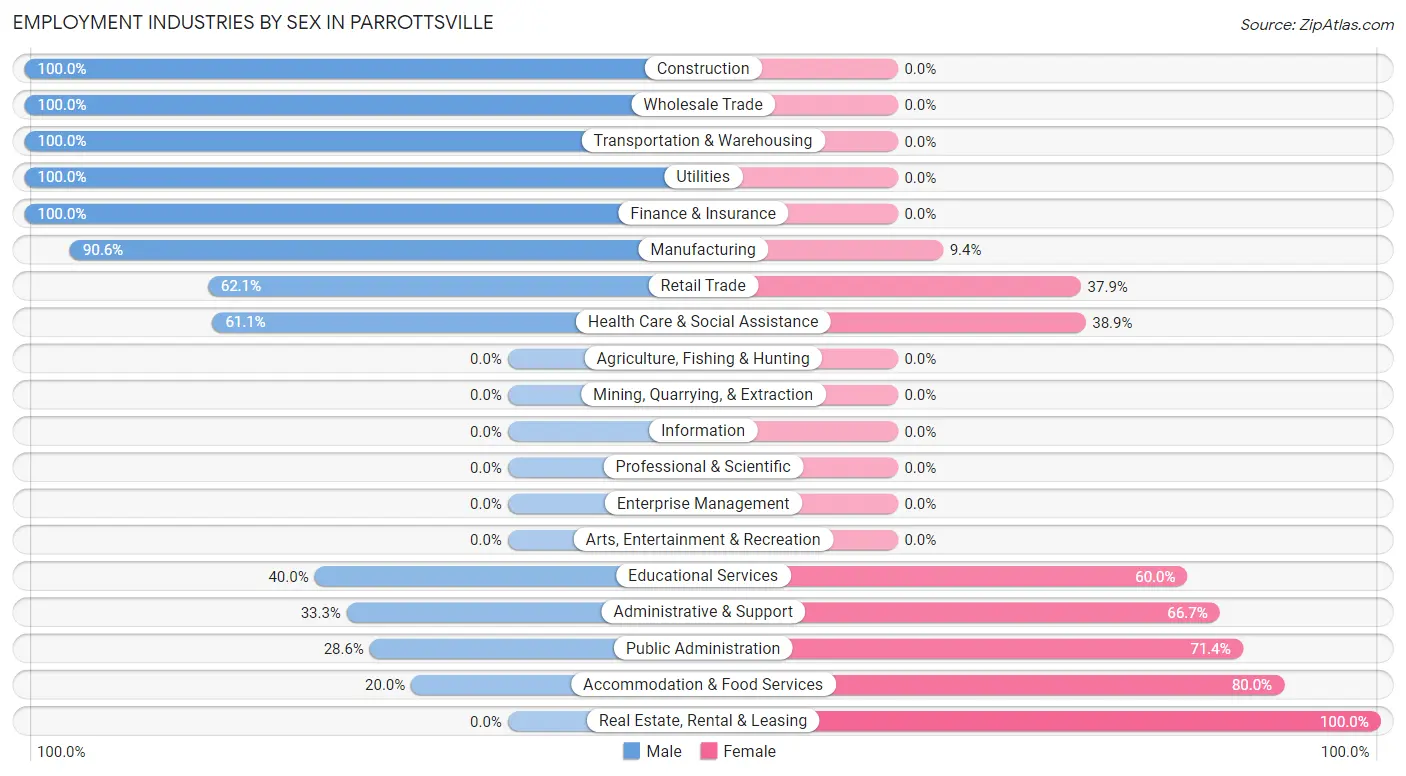
| Industry | Male | Female |
| Agriculture, Fishing & Hunting | 0 (0.0%) | 0 (0.0%) |
| Mining, Quarrying, & Extraction | 0 (0.0%) | 0 (0.0%) |
| Construction | 2 (100.0%) | 0 (0.0%) |
| Manufacturing | 58 (90.6%) | 6 (9.4%) |
| Wholesale Trade | 1 (100.0%) | 0 (0.0%) |
| Retail Trade | 18 (62.1%) | 11 (37.9%) |
| Transportation & Warehousing | 1 (100.0%) | 0 (0.0%) |
| Utilities | 2 (100.0%) | 0 (0.0%) |
| Information | 0 (0.0%) | 0 (0.0%) |
| Finance & Insurance | 1 (100.0%) | 0 (0.0%) |
| Real Estate, Rental & Leasing | 0 (0.0%) | 1 (100.0%) |
| Professional & Scientific | 0 (0.0%) | 0 (0.0%) |
| Enterprise Management | 0 (0.0%) | 0 (0.0%) |
| Administrative & Support | 1 (33.3%) | 2 (66.7%) |
| Educational Services | 2 (40.0%) | 3 (60.0%) |
| Health Care & Social Assistance | 11 (61.1%) | 7 (38.9%) |
| Arts, Entertainment & Recreation | 0 (0.0%) | 0 (0.0%) |
| Accommodation & Food Services | 2 (20.0%) | 8 (80.0%) |
| Public Administration | 2 (28.6%) | 5 (71.4%) |
| Total | 103 (70.6%) | 43 (29.4%) |
Education in Parrottsville
School Enrollment in Parrottsville
The most common levels of schooling among the 25 students in Parrottsville are high school (10 | 40.0%), elementary school (8 | 32.0%), and middle school (4 | 16.0%).
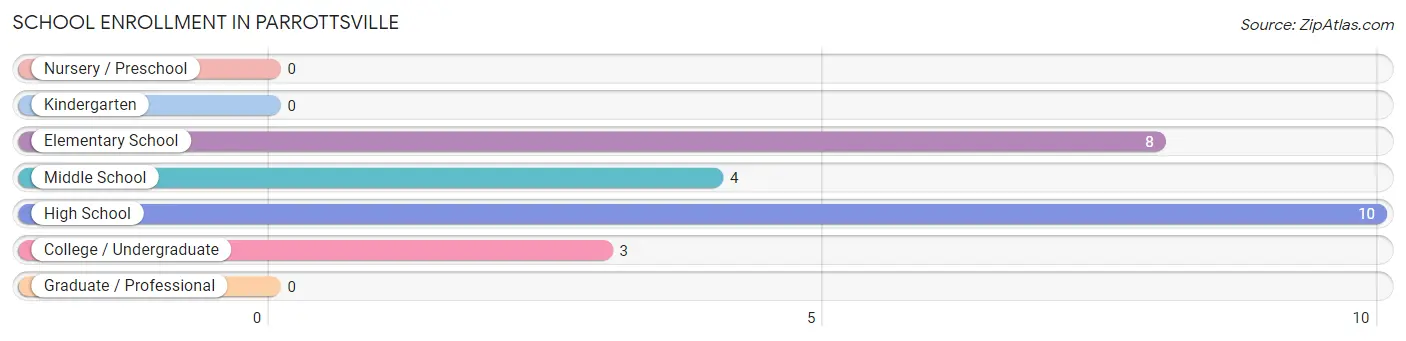
| School Level | # Students | % Students |
| Nursery / Preschool | 0 | 0.0% |
| Kindergarten | 0 | 0.0% |
| Elementary School | 8 | 32.0% |
| Middle School | 4 | 16.0% |
| High School | 10 | 40.0% |
| College / Undergraduate | 3 | 12.0% |
| Graduate / Professional | 0 | 0.0% |
| Total | 25 | 100.0% |
School Enrollment by Age by Funding Source in Parrottsville
Out of a total of 25 students who are enrolled in schools in Parrottsville, 2 (8.0%) attend a private institution, while the remaining 23 (92.0%) are enrolled in public schools. The age group of 5 to 9 year old has the highest likelihood of being enrolled in private schools, with 2 (25.0% in the age bracket) enrolled. Conversely, the age group of 10 to 14 year olds has the lowest likelihood of being enrolled in a private school, with 6 (100.0% in the age bracket) attending a public institution.
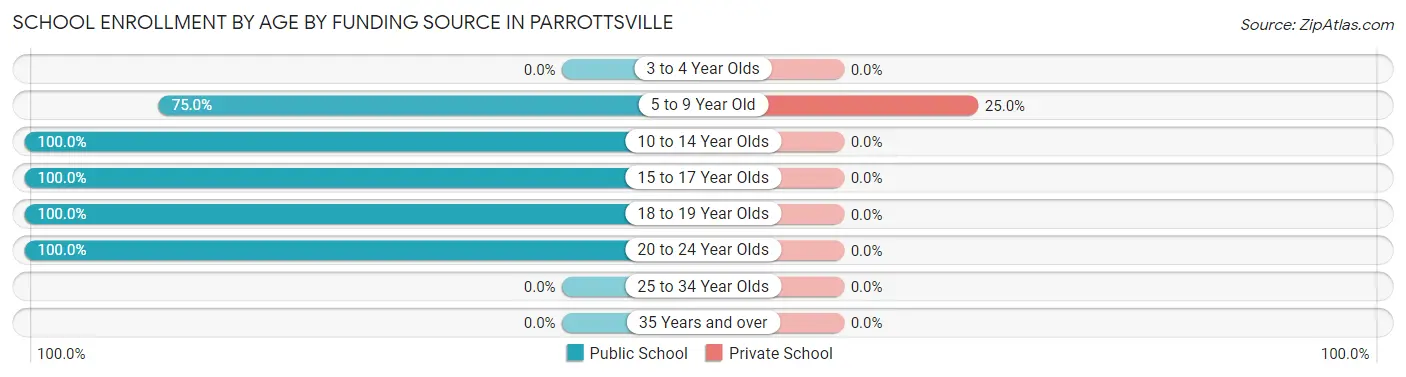
| Age Bracket | Public School | Private School |
| 3 to 4 Year Olds | 0 (0.0%) | 0 (0.0%) |
| 5 to 9 Year Old | 6 (75.0%) | 2 (25.0%) |
| 10 to 14 Year Olds | 6 (100.0%) | 0 (0.0%) |
| 15 to 17 Year Olds | 6 (100.0%) | 0 (0.0%) |
| 18 to 19 Year Olds | 4 (100.0%) | 0 (0.0%) |
| 20 to 24 Year Olds | 1 (100.0%) | 0 (0.0%) |
| 25 to 34 Year Olds | 0 (0.0%) | 0 (0.0%) |
| 35 Years and over | 0 (0.0%) | 0 (0.0%) |
| Total | 23 (92.0%) | 2 (8.0%) |
Educational Attainment by Field of Study in Parrottsville
Education (16 | 42.1%), business (8 | 21.0%), science & technology (6 | 15.8%), liberal arts & history (5 | 13.2%), and bio, nature & agricultural (2 | 5.3%) are the most common fields of study among 38 individuals in Parrottsville who have obtained a bachelor's degree or higher.
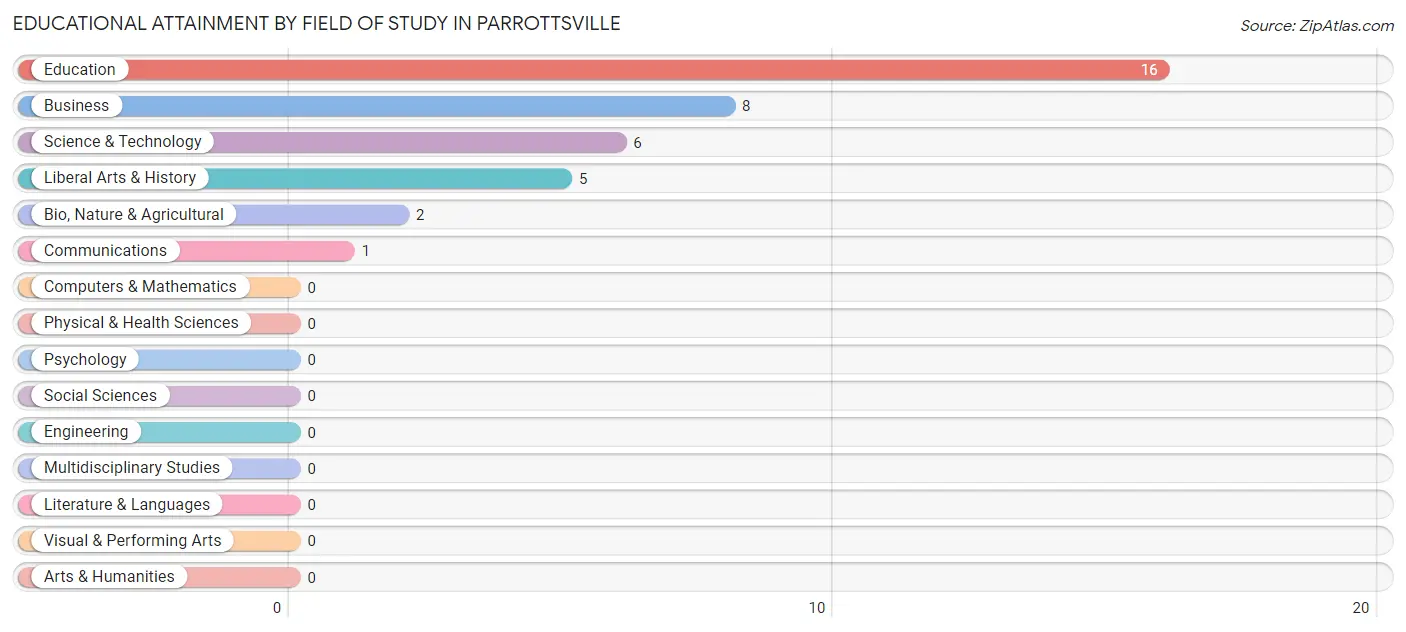
| Field of Study | # Graduates | % Graduates |
| Computers & Mathematics | 0 | 0.0% |
| Bio, Nature & Agricultural | 2 | 5.3% |
| Physical & Health Sciences | 0 | 0.0% |
| Psychology | 0 | 0.0% |
| Social Sciences | 0 | 0.0% |
| Engineering | 0 | 0.0% |
| Multidisciplinary Studies | 0 | 0.0% |
| Science & Technology | 6 | 15.8% |
| Business | 8 | 21.0% |
| Education | 16 | 42.1% |
| Literature & Languages | 0 | 0.0% |
| Liberal Arts & History | 5 | 13.2% |
| Visual & Performing Arts | 0 | 0.0% |
| Communications | 1 | 2.6% |
| Arts & Humanities | 0 | 0.0% |
| Total | 38 | 100.0% |
Transportation & Commute in Parrottsville
Vehicle Availability by Sex in Parrottsville
The most prevalent vehicle ownership categories in Parrottsville are males with 2 vehicles (35, accounting for 34.0%) and females with 2 vehicles (12, making up 81.4%).
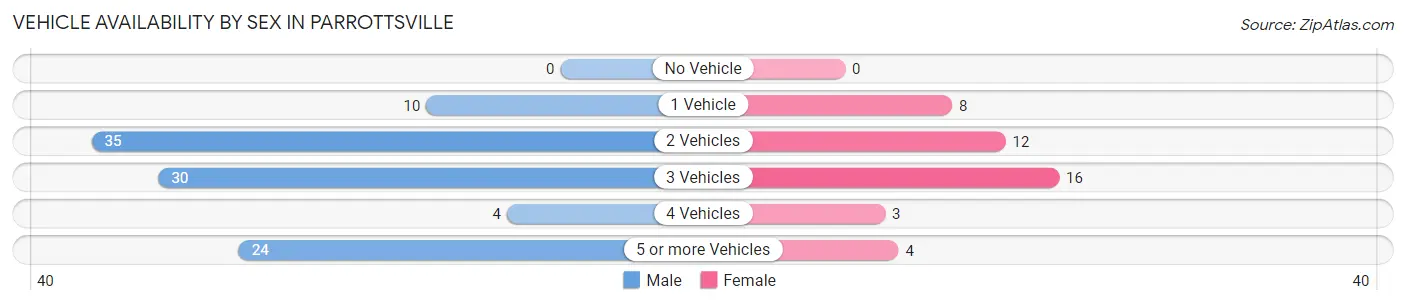
| Vehicles Available | Male | Female |
| No Vehicle | 0 (0.0%) | 0 (0.0%) |
| 1 Vehicle | 10 (9.7%) | 8 (18.6%) |
| 2 Vehicles | 35 (34.0%) | 12 (27.9%) |
| 3 Vehicles | 30 (29.1%) | 16 (37.2%) |
| 4 Vehicles | 4 (3.9%) | 3 (7.0%) |
| 5 or more Vehicles | 24 (23.3%) | 4 (9.3%) |
| Total | 103 (100.0%) | 43 (100.0%) |
Commute Time in Parrottsville
The most frequently occuring commute durations in Parrottsville are 30 to 34 minutes (28 commuters, 19.3%), 15 to 19 minutes (27 commuters, 18.6%), and 5 to 9 minutes (21 commuters, 14.5%).
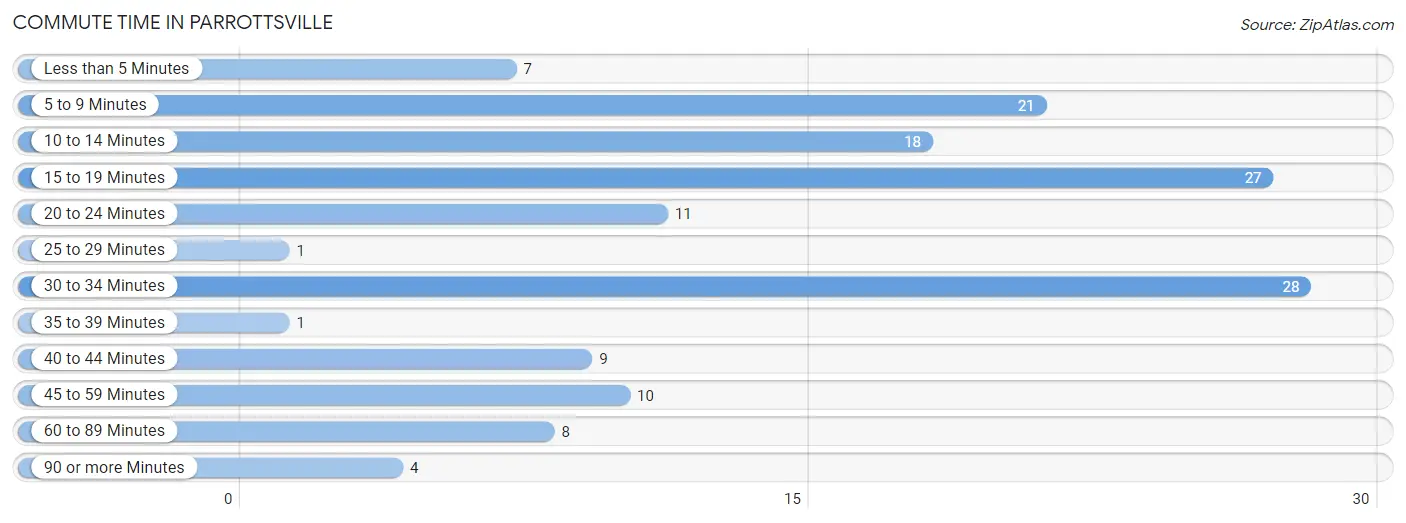
| Commute Time | # Commuters | % Commuters |
| Less than 5 Minutes | 7 | 4.8% |
| 5 to 9 Minutes | 21 | 14.5% |
| 10 to 14 Minutes | 18 | 12.4% |
| 15 to 19 Minutes | 27 | 18.6% |
| 20 to 24 Minutes | 11 | 7.6% |
| 25 to 29 Minutes | 1 | 0.7% |
| 30 to 34 Minutes | 28 | 19.3% |
| 35 to 39 Minutes | 1 | 0.7% |
| 40 to 44 Minutes | 9 | 6.2% |
| 45 to 59 Minutes | 10 | 6.9% |
| 60 to 89 Minutes | 8 | 5.5% |
| 90 or more Minutes | 4 | 2.8% |
Commute Time by Sex in Parrottsville
The most common commute times in Parrottsville are 30 to 34 minutes (25 commuters, 24.5%) for males and 20 to 24 minutes (11 commuters, 25.6%) for females.
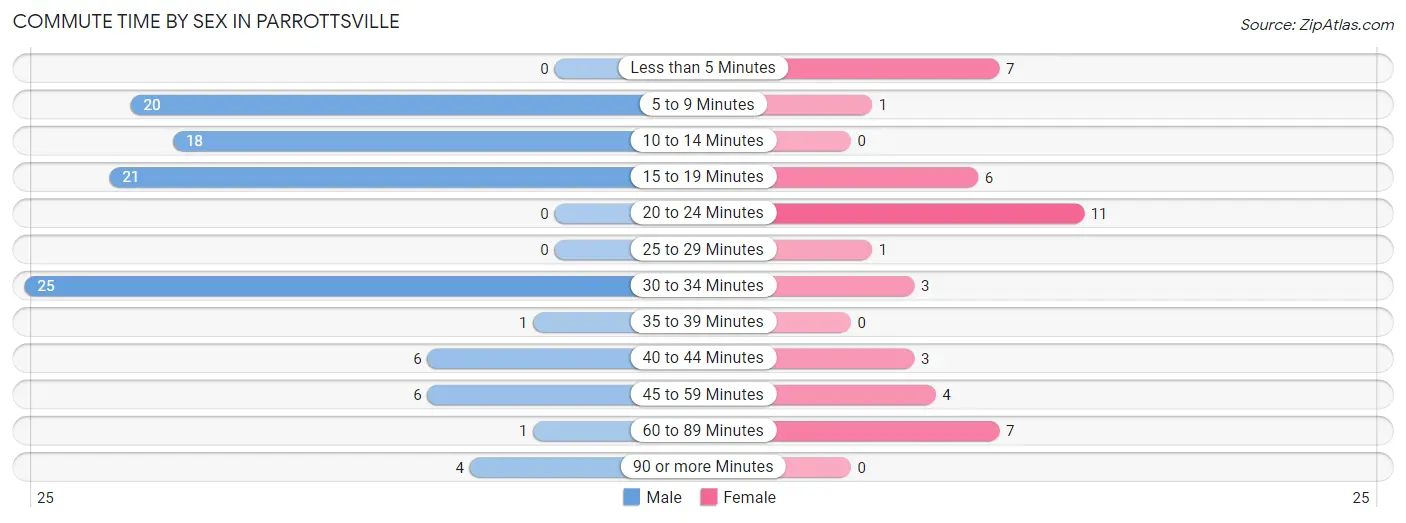
| Commute Time | Male | Female |
| Less than 5 Minutes | 0 (0.0%) | 7 (16.3%) |
| 5 to 9 Minutes | 20 (19.6%) | 1 (2.3%) |
| 10 to 14 Minutes | 18 (17.6%) | 0 (0.0%) |
| 15 to 19 Minutes | 21 (20.6%) | 6 (14.0%) |
| 20 to 24 Minutes | 0 (0.0%) | 11 (25.6%) |
| 25 to 29 Minutes | 0 (0.0%) | 1 (2.3%) |
| 30 to 34 Minutes | 25 (24.5%) | 3 (7.0%) |
| 35 to 39 Minutes | 1 (1.0%) | 0 (0.0%) |
| 40 to 44 Minutes | 6 (5.9%) | 3 (7.0%) |
| 45 to 59 Minutes | 6 (5.9%) | 4 (9.3%) |
| 60 to 89 Minutes | 1 (1.0%) | 7 (16.3%) |
| 90 or more Minutes | 4 (3.9%) | 0 (0.0%) |
Time of Departure to Work by Sex in Parrottsville
The most frequent times of departure to work in Parrottsville are 12:00 AM to 4:59 AM (46, 45.1%) for males and 6:00 AM to 6:29 AM (7, 16.3%) for females.
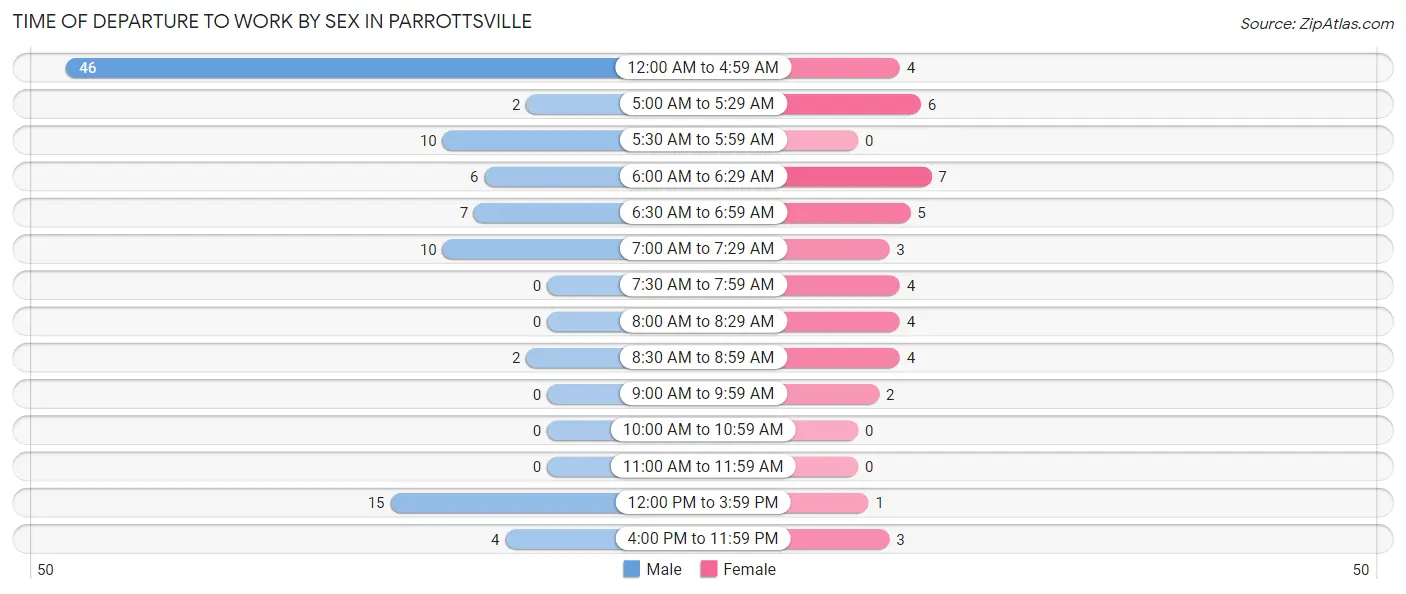
| Time of Departure | Male | Female |
| 12:00 AM to 4:59 AM | 46 (45.1%) | 4 (9.3%) |
| 5:00 AM to 5:29 AM | 2 (2.0%) | 6 (14.0%) |
| 5:30 AM to 5:59 AM | 10 (9.8%) | 0 (0.0%) |
| 6:00 AM to 6:29 AM | 6 (5.9%) | 7 (16.3%) |
| 6:30 AM to 6:59 AM | 7 (6.9%) | 5 (11.6%) |
| 7:00 AM to 7:29 AM | 10 (9.8%) | 3 (7.0%) |
| 7:30 AM to 7:59 AM | 0 (0.0%) | 4 (9.3%) |
| 8:00 AM to 8:29 AM | 0 (0.0%) | 4 (9.3%) |
| 8:30 AM to 8:59 AM | 2 (2.0%) | 4 (9.3%) |
| 9:00 AM to 9:59 AM | 0 (0.0%) | 2 (4.6%) |
| 10:00 AM to 10:59 AM | 0 (0.0%) | 0 (0.0%) |
| 11:00 AM to 11:59 AM | 0 (0.0%) | 0 (0.0%) |
| 12:00 PM to 3:59 PM | 15 (14.7%) | 1 (2.3%) |
| 4:00 PM to 11:59 PM | 4 (3.9%) | 3 (7.0%) |
| Total | 102 (100.0%) | 43 (100.0%) |
Housing Occupancy in Parrottsville
Occupancy by Ownership in Parrottsville
Of the total 141 dwellings in Parrottsville, owner-occupied units account for 69 (48.9%), while renter-occupied units make up 72 (51.1%).
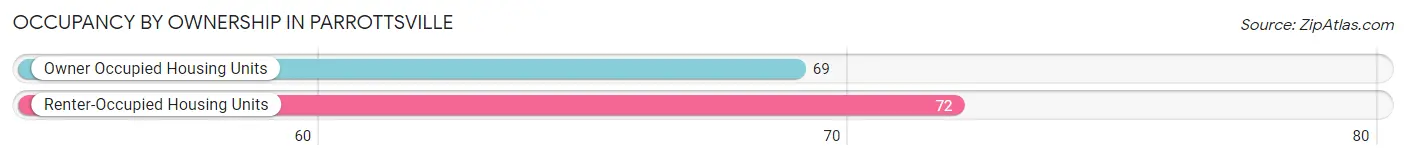
| Occupancy | # Housing Units | % Housing Units |
| Owner Occupied Housing Units | 69 | 48.9% |
| Renter-Occupied Housing Units | 72 | 51.1% |
| Total Occupied Housing Units | 141 | 100.0% |
Occupancy by Household Size in Parrottsville
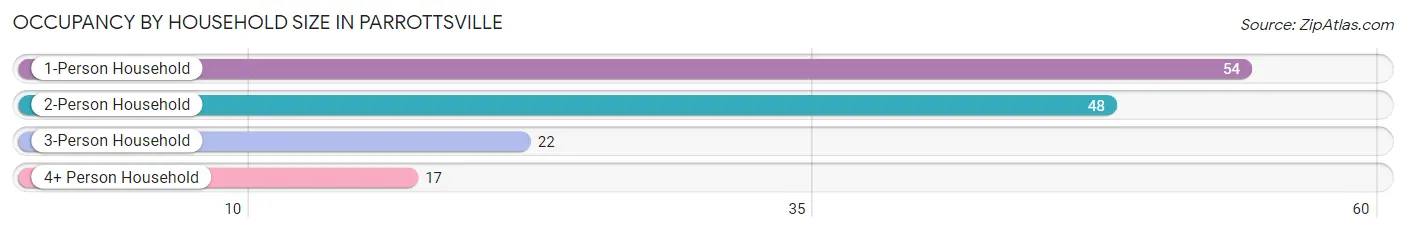
| Household Size | # Housing Units | % Housing Units |
| 1-Person Household | 54 | 38.3% |
| 2-Person Household | 48 | 34.0% |
| 3-Person Household | 22 | 15.6% |
| 4+ Person Household | 17 | 12.1% |
| Total Housing Units | 141 | 100.0% |
Occupancy by Ownership by Household Size in Parrottsville
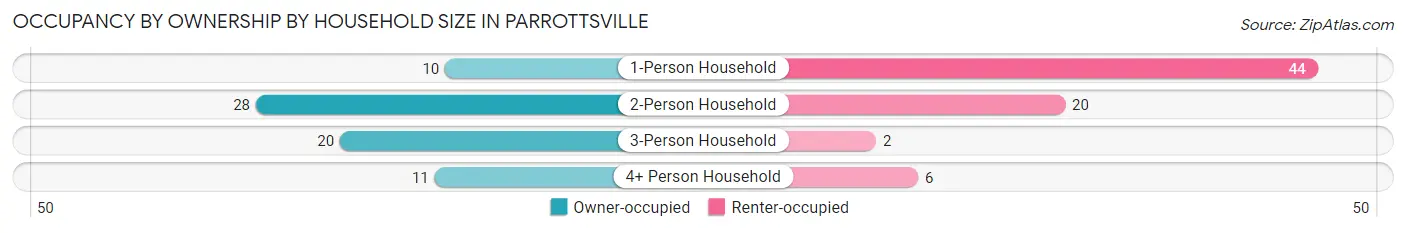
| Household Size | Owner-occupied | Renter-occupied |
| 1-Person Household | 10 (18.5%) | 44 (81.5%) |
| 2-Person Household | 28 (58.3%) | 20 (41.7%) |
| 3-Person Household | 20 (90.9%) | 2 (9.1%) |
| 4+ Person Household | 11 (64.7%) | 6 (35.3%) |
| Total Housing Units | 69 (48.9%) | 72 (51.1%) |
Occupancy by Educational Attainment in Parrottsville
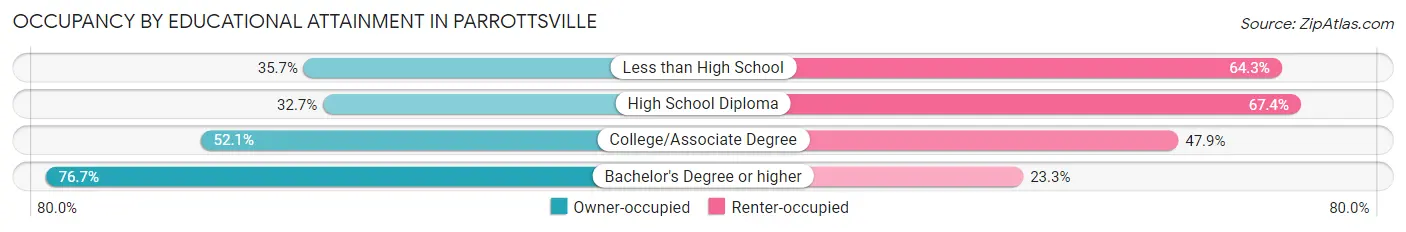
| Household Size | Owner-occupied | Renter-occupied |
| Less than High School | 5 (35.7%) | 9 (64.3%) |
| High School Diploma | 16 (32.7%) | 33 (67.3%) |
| College/Associate Degree | 25 (52.1%) | 23 (47.9%) |
| Bachelor's Degree or higher | 23 (76.7%) | 7 (23.3%) |
Occupancy by Age of Householder in Parrottsville
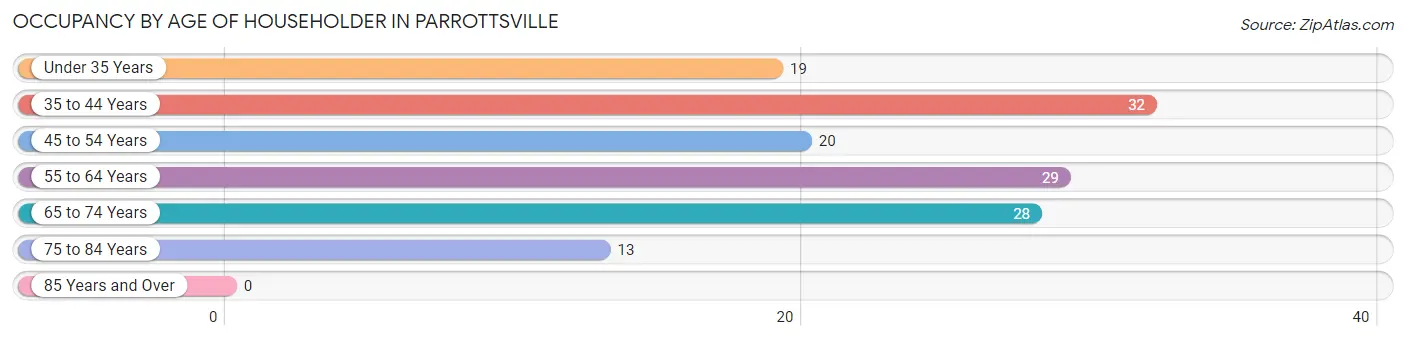
| Age Bracket | # Households | % Households |
| Under 35 Years | 19 | 13.5% |
| 35 to 44 Years | 32 | 22.7% |
| 45 to 54 Years | 20 | 14.2% |
| 55 to 64 Years | 29 | 20.6% |
| 65 to 74 Years | 28 | 19.9% |
| 75 to 84 Years | 13 | 9.2% |
| 85 Years and Over | 0 | 0.0% |
| Total | 141 | 100.0% |
Housing Finances in Parrottsville
Median Income by Occupancy in Parrottsville
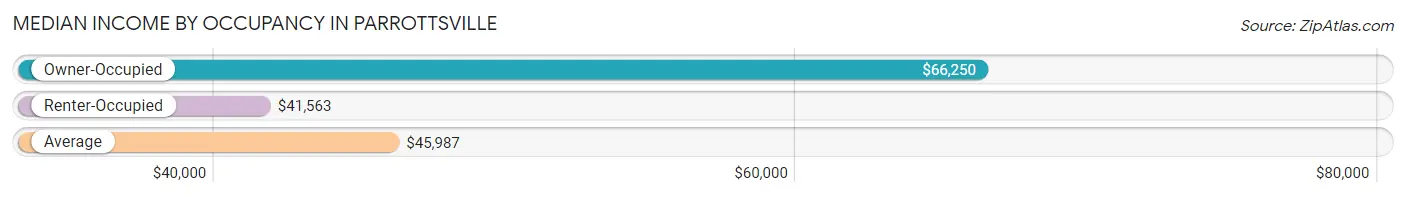
| Occupancy Type | # Households | Median Income |
| Owner-Occupied | 69 (48.9%) | $66,250 |
| Renter-Occupied | 72 (51.1%) | $41,563 |
| Average | 141 (100.0%) | $45,987 |
Occupancy by Householder Income Bracket in Parrottsville
| Income Bracket | Owner-occupied | Renter-occupied |
| Less than $5,000 | 0 (0.0%) | 2 (2.8%) |
| $5,000 to $9,999 | 4 (5.8%) | 0 (0.0%) |
| $10,000 to $14,999 | 1 (1.5%) | 0 (0.0%) |
| $15,000 to $19,999 | 9 (13.0%) | 6 (8.3%) |
| $20,000 to $24,999 | 1 (1.5%) | 5 (6.9%) |
| $25,000 to $34,999 | 3 (4.3%) | 16 (22.2%) |
| $35,000 to $49,999 | 6 (8.7%) | 29 (40.3%) |
| $50,000 to $74,999 | 23 (33.3%) | 2 (2.8%) |
| $75,000 to $99,999 | 20 (29.0%) | 1 (1.4%) |
| $100,000 to $149,999 | 2 (2.9%) | 3 (4.2%) |
| $150,000 or more | 0 (0.0%) | 8 (11.1%) |
| Total | 69 (100.0%) | 72 (100.0%) |
Monthly Housing Cost Tiers in Parrottsville
| Monthly Cost | Owner-occupied | Renter-occupied |
| Less than $300 | 7 (10.1%) | 0 (0.0%) |
| $300 to $499 | 16 (23.2%) | 0 (0.0%) |
| $500 to $799 | 9 (13.0%) | 45 (62.5%) |
| $800 to $999 | 6 (8.7%) | 24 (33.3%) |
| $1,000 to $1,499 | 23 (33.3%) | 1 (1.4%) |
| $1,500 to $1,999 | 8 (11.6%) | 0 (0.0%) |
| $2,000 to $2,499 | 0 (0.0%) | 0 (0.0%) |
| $2,500 to $2,999 | 0 (0.0%) | 0 (0.0%) |
| $3,000 or more | 0 (0.0%) | 0 (0.0%) |
| Total | 69 (100.0%) | 72 (100.0%) |
Physical Housing Characteristics in Parrottsville
Housing Structures in Parrottsville
| Structure Type | # Housing Units | % Housing Units |
| Single Unit, Detached | 43 | 30.5% |
| Single Unit, Attached | 0 | 0.0% |
| 2 Unit Apartments | 0 | 0.0% |
| 3 or 4 Unit Apartments | 41 | 29.1% |
| 5 to 9 Unit Apartments | 22 | 15.6% |
| 10 or more Apartments | 0 | 0.0% |
| Mobile Home / Other | 35 | 24.8% |
| Total | 141 | 100.0% |
Housing Structures by Occupancy in Parrottsville
| Structure Type | Owner-occupied | Renter-occupied |
| Single Unit, Detached | 41 (95.4%) | 2 (4.6%) |
| Single Unit, Attached | 0 (0.0%) | 0 (0.0%) |
| 2 Unit Apartments | 0 (0.0%) | 0 (0.0%) |
| 3 or 4 Unit Apartments | 0 (0.0%) | 41 (100.0%) |
| 5 to 9 Unit Apartments | 0 (0.0%) | 22 (100.0%) |
| 10 or more Apartments | 0 (0.0%) | 0 (0.0%) |
| Mobile Home / Other | 28 (80.0%) | 7 (20.0%) |
| Total | 69 (48.9%) | 72 (51.1%) |
Housing Structures by Number of Rooms in Parrottsville
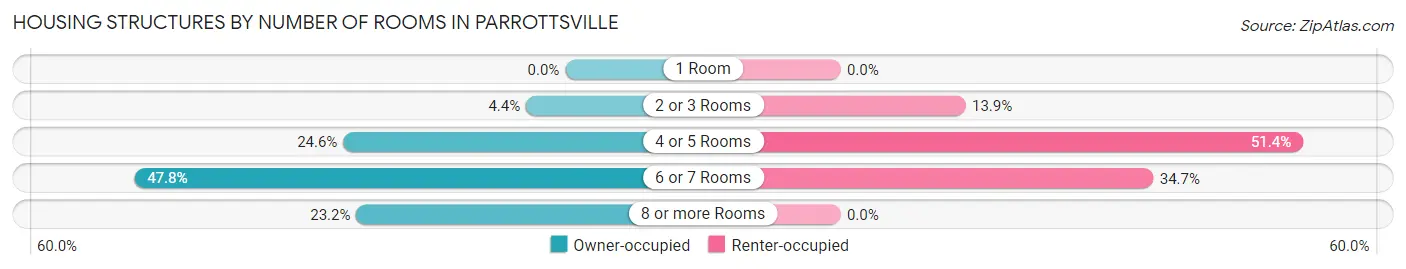
| Number of Rooms | Owner-occupied | Renter-occupied |
| 1 Room | 0 (0.0%) | 0 (0.0%) |
| 2 or 3 Rooms | 3 (4.3%) | 10 (13.9%) |
| 4 or 5 Rooms | 17 (24.6%) | 37 (51.4%) |
| 6 or 7 Rooms | 33 (47.8%) | 25 (34.7%) |
| 8 or more Rooms | 16 (23.2%) | 0 (0.0%) |
| Total | 69 (100.0%) | 72 (100.0%) |
Housing Structure by Heating Type in Parrottsville
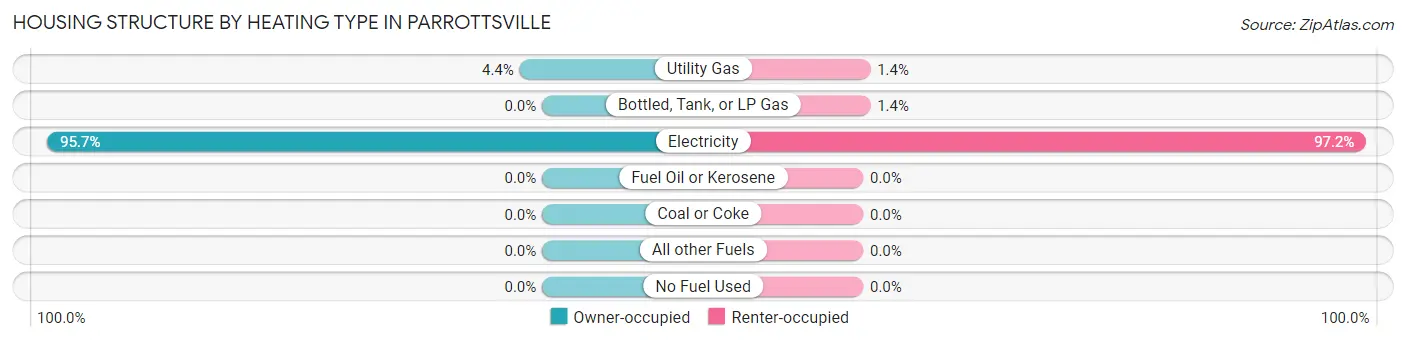
| Heating Type | Owner-occupied | Renter-occupied |
| Utility Gas | 3 (4.3%) | 1 (1.4%) |
| Bottled, Tank, or LP Gas | 0 (0.0%) | 1 (1.4%) |
| Electricity | 66 (95.7%) | 70 (97.2%) |
| Fuel Oil or Kerosene | 0 (0.0%) | 0 (0.0%) |
| Coal or Coke | 0 (0.0%) | 0 (0.0%) |
| All other Fuels | 0 (0.0%) | 0 (0.0%) |
| No Fuel Used | 0 (0.0%) | 0 (0.0%) |
| Total | 69 (100.0%) | 72 (100.0%) |
Household Vehicle Usage in Parrottsville
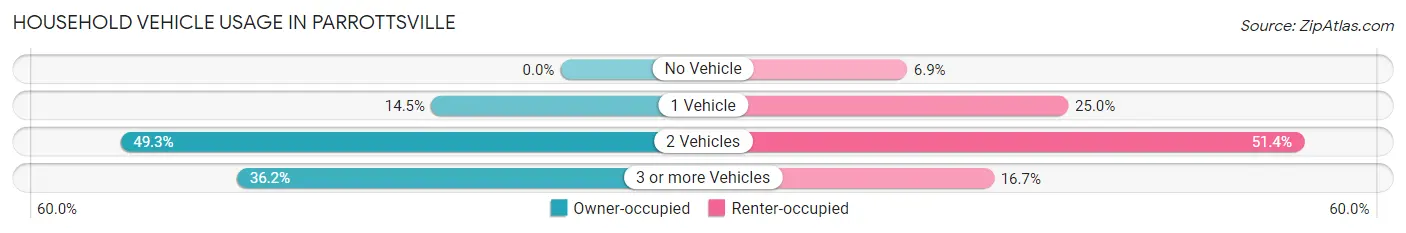
| Vehicles per Household | Owner-occupied | Renter-occupied |
| No Vehicle | 0 (0.0%) | 5 (6.9%) |
| 1 Vehicle | 10 (14.5%) | 18 (25.0%) |
| 2 Vehicles | 34 (49.3%) | 37 (51.4%) |
| 3 or more Vehicles | 25 (36.2%) | 12 (16.7%) |
| Total | 69 (100.0%) | 72 (100.0%) |
Real Estate & Mortgages in Parrottsville
Real Estate and Mortgage Overview in Parrottsville
| Characteristic | Without Mortgage | With Mortgage |
| Housing Units | 28 | 41 |
| Median Property Value | $90,000 | $137,500 |
| Median Household Income | - | - |
| Monthly Housing Costs | $425 | $0 |
| Real Estate Taxes | $900 | $0 |
Property Value by Mortgage Status in Parrottsville
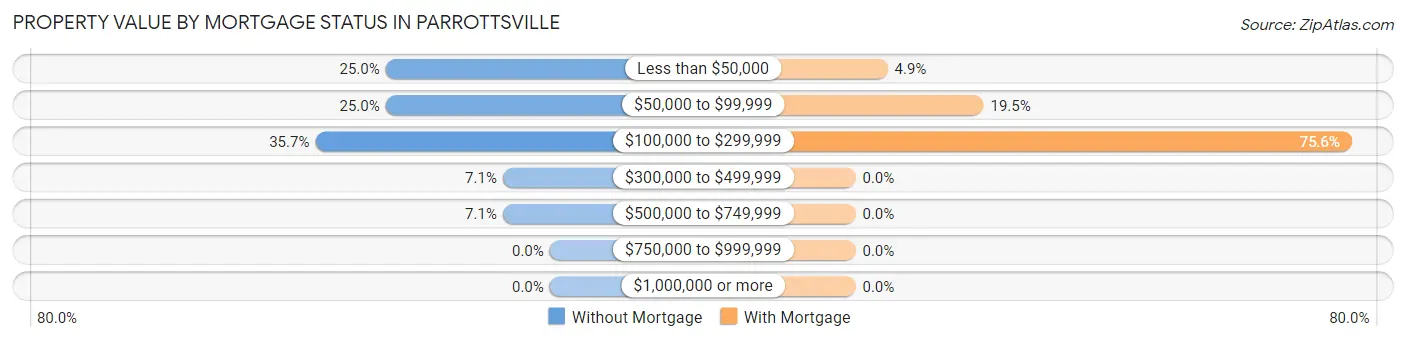
| Property Value | Without Mortgage | With Mortgage |
| Less than $50,000 | 7 (25.0%) | 2 (4.9%) |
| $50,000 to $99,999 | 7 (25.0%) | 8 (19.5%) |
| $100,000 to $299,999 | 10 (35.7%) | 31 (75.6%) |
| $300,000 to $499,999 | 2 (7.1%) | 0 (0.0%) |
| $500,000 to $749,999 | 2 (7.1%) | 0 (0.0%) |
| $750,000 to $999,999 | 0 (0.0%) | 0 (0.0%) |
| $1,000,000 or more | 0 (0.0%) | 0 (0.0%) |
| Total | 28 (100.0%) | 41 (100.0%) |
Household Income by Mortgage Status in Parrottsville
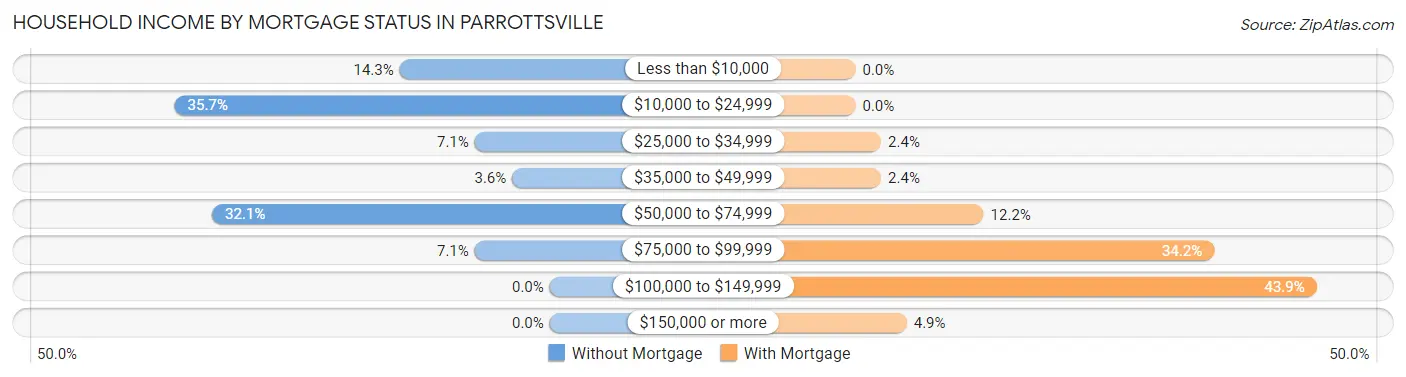
| Household Income | Without Mortgage | With Mortgage |
| Less than $10,000 | 4 (14.3%) | 0 (0.0%) |
| $10,000 to $24,999 | 10 (35.7%) | 0 (0.0%) |
| $25,000 to $34,999 | 2 (7.1%) | 1 (2.4%) |
| $35,000 to $49,999 | 1 (3.6%) | 1 (2.4%) |
| $50,000 to $74,999 | 9 (32.1%) | 5 (12.2%) |
| $75,000 to $99,999 | 2 (7.1%) | 14 (34.2%) |
| $100,000 to $149,999 | 0 (0.0%) | 18 (43.9%) |
| $150,000 or more | 0 (0.0%) | 2 (4.9%) |
| Total | 28 (100.0%) | 41 (100.0%) |
Property Value to Household Income Ratio in Parrottsville
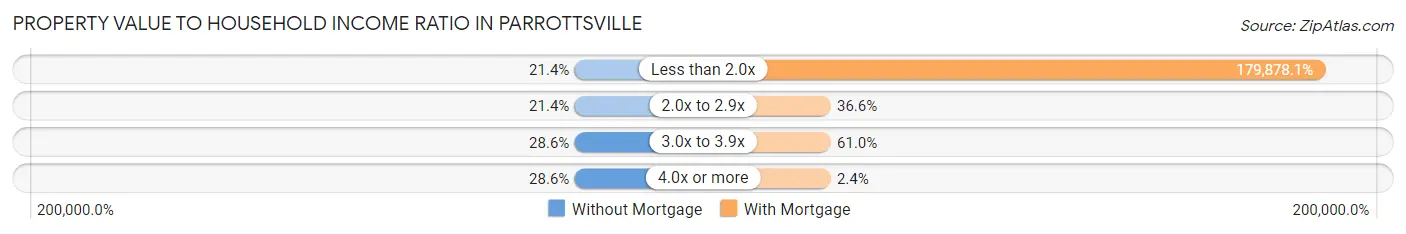
| Value-to-Income Ratio | Without Mortgage | With Mortgage |
| Less than 2.0x | 6 (21.4%) | 73,750 (179,878.1%) |
| 2.0x to 2.9x | 6 (21.4%) | 15 (36.6%) |
| 3.0x to 3.9x | 8 (28.6%) | 25 (61.0%) |
| 4.0x or more | 8 (28.6%) | 1 (2.4%) |
| Total | 28 (100.0%) | 41 (100.0%) |
Real Estate Taxes by Mortgage Status in Parrottsville
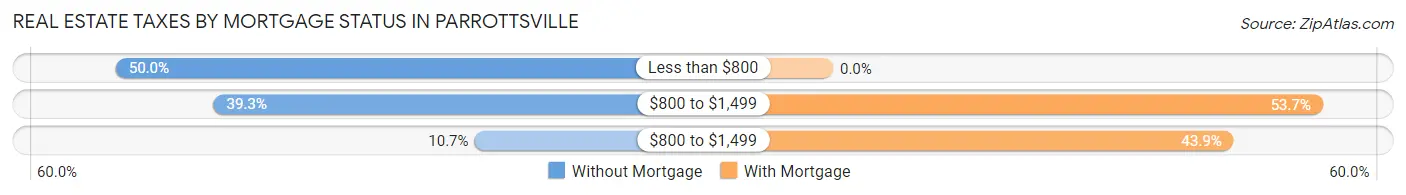
| Property Taxes | Without Mortgage | With Mortgage |
| Less than $800 | 14 (50.0%) | 0 (0.0%) |
| $800 to $1,499 | 11 (39.3%) | 22 (53.7%) |
| $800 to $1,499 | 3 (10.7%) | 18 (43.9%) |
| Total | 28 (100.0%) | 41 (100.0%) |
Health & Disability in Parrottsville
Health Insurance Coverage by Age in Parrottsville
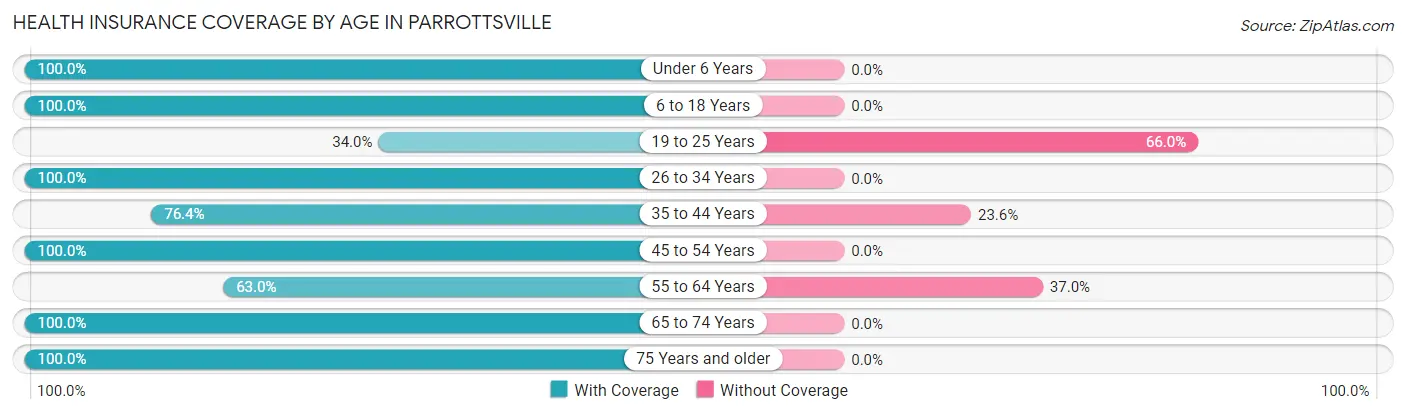
| Age Bracket | With Coverage | Without Coverage |
| Under 6 Years | 49 (100.0%) | 0 (0.0%) |
| 6 to 18 Years | 24 (100.0%) | 0 (0.0%) |
| 19 to 25 Years | 16 (34.0%) | 31 (66.0%) |
| 26 to 34 Years | 21 (100.0%) | 0 (0.0%) |
| 35 to 44 Years | 42 (76.4%) | 13 (23.6%) |
| 45 to 54 Years | 34 (100.0%) | 0 (0.0%) |
| 55 to 64 Years | 34 (63.0%) | 20 (37.0%) |
| 65 to 74 Years | 38 (100.0%) | 0 (0.0%) |
| 75 Years and older | 29 (100.0%) | 0 (0.0%) |
| Total | 287 (81.8%) | 64 (18.2%) |
Health Insurance Coverage by Citizenship Status in Parrottsville
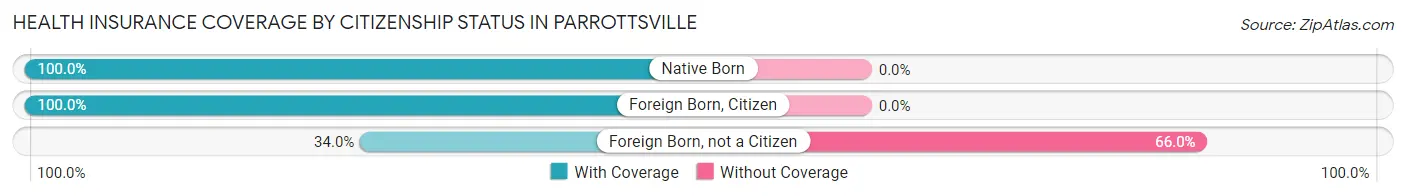
| Citizenship Status | With Coverage | Without Coverage |
| Native Born | 49 (100.0%) | 0 (0.0%) |
| Foreign Born, Citizen | 24 (100.0%) | 0 (0.0%) |
| Foreign Born, not a Citizen | 16 (34.0%) | 31 (66.0%) |
Health Insurance Coverage by Household Income in Parrottsville
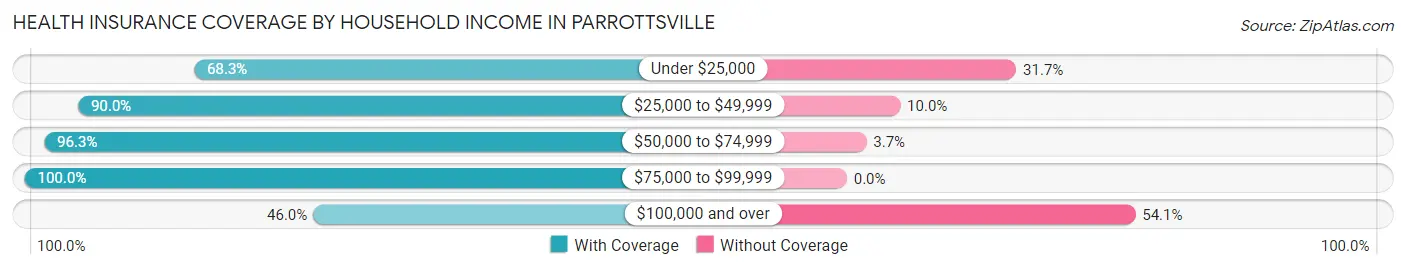
| Household Income | With Coverage | Without Coverage |
| Under $25,000 | 71 (68.3%) | 33 (31.7%) |
| $25,000 to $49,999 | 72 (90.0%) | 8 (10.0%) |
| $50,000 to $74,999 | 79 (96.3%) | 3 (3.7%) |
| $75,000 to $99,999 | 48 (100.0%) | 0 (0.0%) |
| $100,000 and over | 17 (46.0%) | 20 (54.0%) |
Public vs Private Health Insurance Coverage by Age in Parrottsville
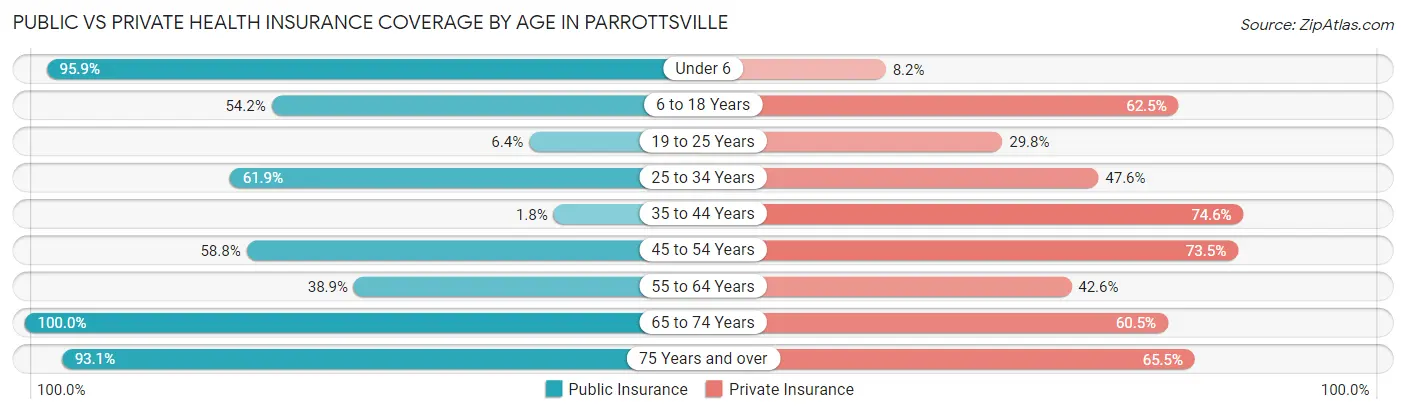
| Age Bracket | Public Insurance | Private Insurance |
| Under 6 | 47 (95.9%) | 4 (8.2%) |
| 6 to 18 Years | 13 (54.2%) | 15 (62.5%) |
| 19 to 25 Years | 3 (6.4%) | 14 (29.8%) |
| 25 to 34 Years | 13 (61.9%) | 10 (47.6%) |
| 35 to 44 Years | 1 (1.8%) | 41 (74.6%) |
| 45 to 54 Years | 20 (58.8%) | 25 (73.5%) |
| 55 to 64 Years | 21 (38.9%) | 23 (42.6%) |
| 65 to 74 Years | 38 (100.0%) | 23 (60.5%) |
| 75 Years and over | 27 (93.1%) | 19 (65.5%) |
| Total | 183 (52.1%) | 174 (49.6%) |
Disability Status by Sex by Age in Parrottsville
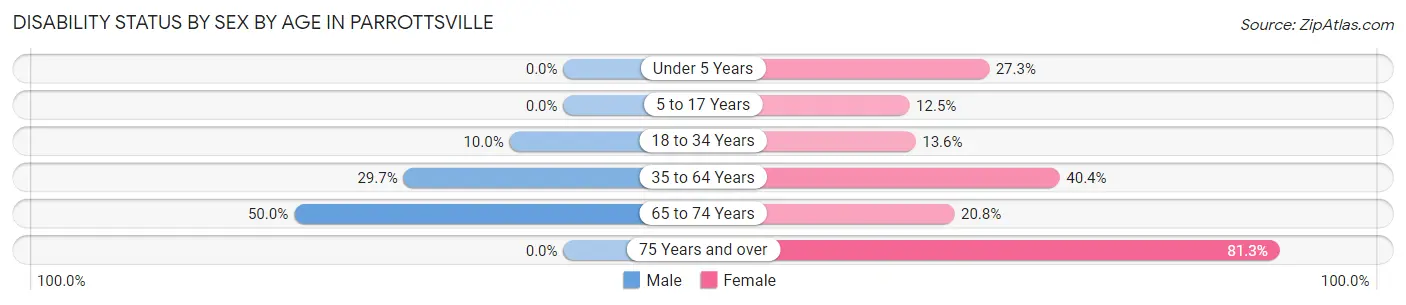
| Age Bracket | Male | Female |
| Under 5 Years | 0 (0.0%) | 3 (27.3%) |
| 5 to 17 Years | 0 (0.0%) | 2 (12.5%) |
| 18 to 34 Years | 5 (10.0%) | 3 (13.6%) |
| 35 to 64 Years | 27 (29.7%) | 21 (40.4%) |
| 65 to 74 Years | 7 (50.0%) | 5 (20.8%) |
| 75 Years and over | 0 (0.0%) | 13 (81.2%) |
Disability Class by Sex by Age in Parrottsville
Disability Class: Hearing Difficulty
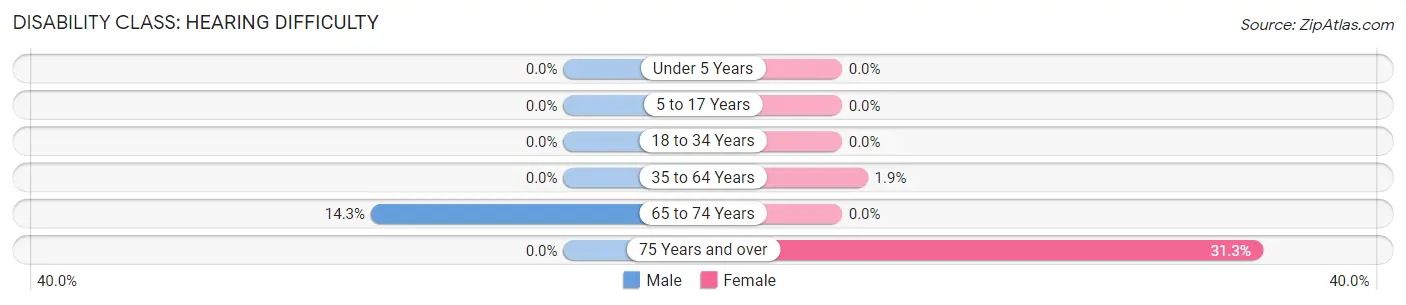
| Age Bracket | Male | Female |
| Under 5 Years | 0 (0.0%) | 0 (0.0%) |
| 5 to 17 Years | 0 (0.0%) | 0 (0.0%) |
| 18 to 34 Years | 0 (0.0%) | 0 (0.0%) |
| 35 to 64 Years | 0 (0.0%) | 1 (1.9%) |
| 65 to 74 Years | 2 (14.3%) | 0 (0.0%) |
| 75 Years and over | 0 (0.0%) | 5 (31.2%) |
Disability Class: Vision Difficulty
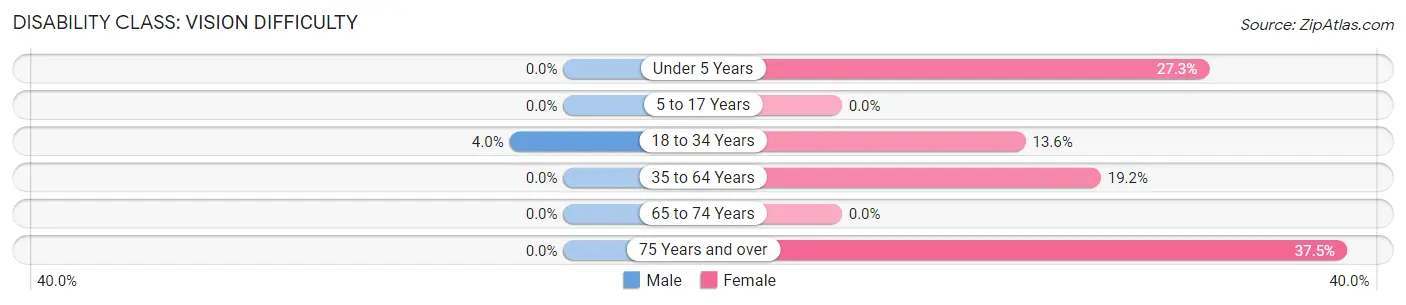
| Age Bracket | Male | Female |
| Under 5 Years | 0 (0.0%) | 3 (27.3%) |
| 5 to 17 Years | 0 (0.0%) | 0 (0.0%) |
| 18 to 34 Years | 2 (4.0%) | 3 (13.6%) |
| 35 to 64 Years | 0 (0.0%) | 10 (19.2%) |
| 65 to 74 Years | 0 (0.0%) | 0 (0.0%) |
| 75 Years and over | 0 (0.0%) | 6 (37.5%) |
Disability Class: Cognitive Difficulty
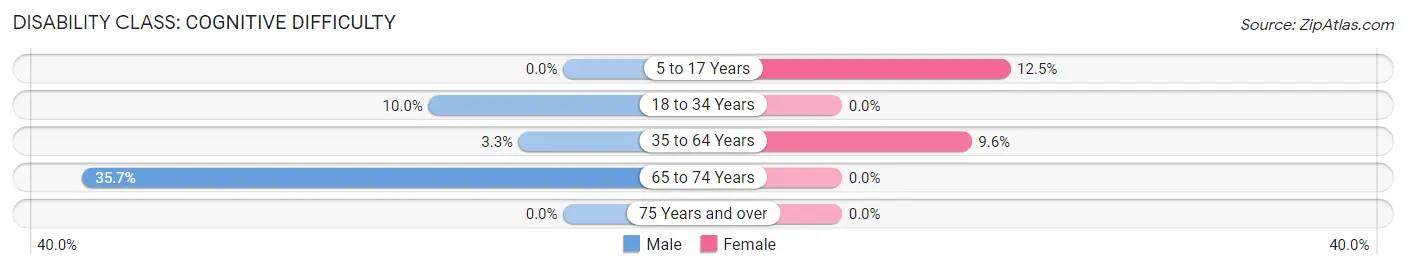
| Age Bracket | Male | Female |
| 5 to 17 Years | 0 (0.0%) | 2 (12.5%) |
| 18 to 34 Years | 5 (10.0%) | 0 (0.0%) |
| 35 to 64 Years | 3 (3.3%) | 5 (9.6%) |
| 65 to 74 Years | 5 (35.7%) | 0 (0.0%) |
| 75 Years and over | 0 (0.0%) | 0 (0.0%) |
Disability Class: Ambulatory Difficulty
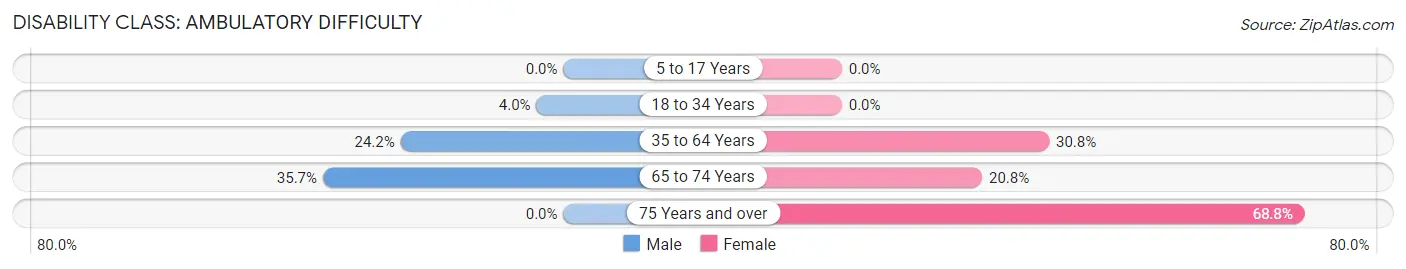
| Age Bracket | Male | Female |
| 5 to 17 Years | 0 (0.0%) | 0 (0.0%) |
| 18 to 34 Years | 2 (4.0%) | 0 (0.0%) |
| 35 to 64 Years | 22 (24.2%) | 16 (30.8%) |
| 65 to 74 Years | 5 (35.7%) | 5 (20.8%) |
| 75 Years and over | 0 (0.0%) | 11 (68.8%) |
Disability Class: Self-Care Difficulty
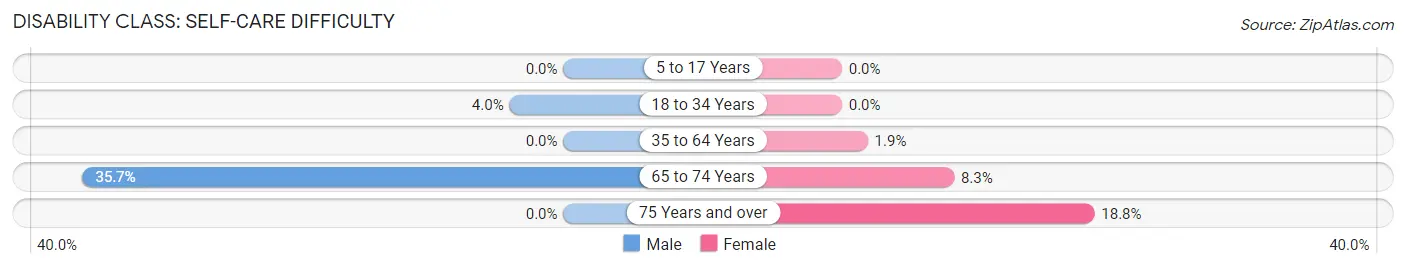
| Age Bracket | Male | Female |
| 5 to 17 Years | 0 (0.0%) | 0 (0.0%) |
| 18 to 34 Years | 2 (4.0%) | 0 (0.0%) |
| 35 to 64 Years | 0 (0.0%) | 1 (1.9%) |
| 65 to 74 Years | 5 (35.7%) | 2 (8.3%) |
| 75 Years and over | 0 (0.0%) | 3 (18.8%) |
Technology Access in Parrottsville
Computing Device Access in Parrottsville
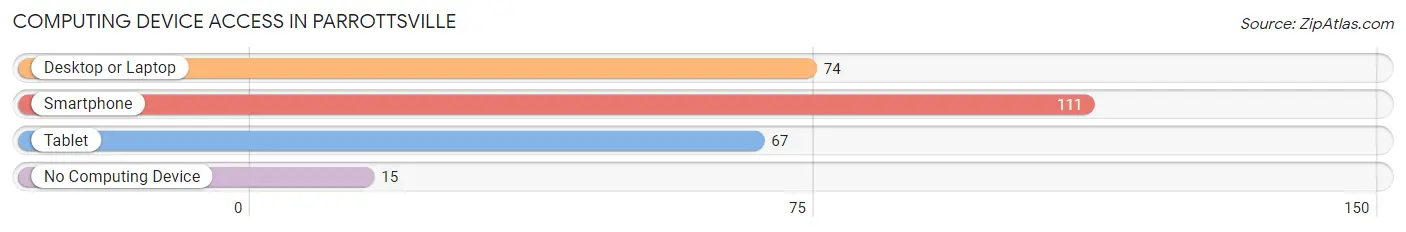
| Device Type | # Households | % Households |
| Desktop or Laptop | 74 | 52.5% |
| Smartphone | 111 | 78.7% |
| Tablet | 67 | 47.5% |
| No Computing Device | 15 | 10.6% |
| Total | 141 | 100.0% |
Internet Access in Parrottsville
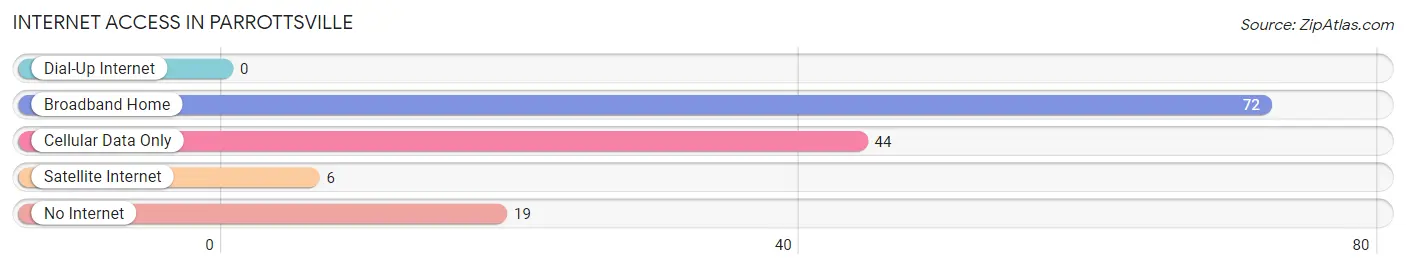
| Internet Type | # Households | % Households |
| Dial-Up Internet | 0 | 0.0% |
| Broadband Home | 72 | 51.1% |
| Cellular Data Only | 44 | 31.2% |
| Satellite Internet | 6 | 4.3% |
| No Internet | 19 | 13.5% |
| Total | 141 | 100.0% |
Parrottsville Summary
Parrottsville is a small town located in Cocke County, Tennessee. It is situated in the foothills of the Great Smoky Mountains, about 25 miles east of Knoxville. The town was founded in 1820 and named after the Parrott family, who were among the first settlers in the area. The population of Parrottsville was 1,093 at the 2010 census.
Geography
Parrottsville is located at 35°48'25"N 83°7'25"W (35.806944, -83.123611). The town is situated in the foothills of the Great Smoky Mountains, about 25 miles east of Knoxville. The elevation of Parrottsville is 1,068 feet above sea level. The town is located in the Eastern Time Zone.
The town is surrounded by the Cherokee National Forest, which covers over 640,000 acres of land. The forest is home to a variety of wildlife, including black bears, white-tailed deer, wild turkeys, and a variety of birds. The forest also provides recreational opportunities such as camping, hiking, fishing, and hunting.
Climate
Parrottsville has a humid subtropical climate, with hot, humid summers and mild winters. The average annual temperature is 61°F, with an average high of 79°F in July and an average low of 43°F in January. The average annual precipitation is 48 inches, with the wettest month being May, when an average of 6.2 inches of rain falls.
Demographics
As of the 2010 census, the population of Parrottsville was 1,093. The racial makeup of the town was 97.2% White, 0.7% African American, 0.2% Native American, 0.2% Asian, 0.2% from other races, and 1.7% from two or more races. Hispanic or Latino of any race were 0.7% of the population.
The median age in Parrottsville was 43.2 years, with 24.2% of the population under the age of 18, 8.2% between 18 and 24, 24.2% between 25 and 44, 28.2% between 45 and 64, and 15.2% 65 years of age or older. The median household income was $31,250, and the median family income was $37,500.
Economy
Parrottsville’s economy is largely based on agriculture and tourism. The town is home to several farms, which produce a variety of crops, including corn, soybeans, hay, and tobacco. The town is also home to several tourist attractions, including the Great Smoky Mountains National Park, the Appalachian Trail, and the Cherokee National Forest.
The town is also home to several small businesses, including restaurants, retail stores, and service providers. The town is served by the Cocke County School System, which provides educational opportunities for the town’s children.
Conclusion
Parrottsville is a small town located in Cocke County, Tennessee. It is situated in the foothills of the Great Smoky Mountains, about 25 miles east of Knoxville. The town was founded in 1820 and named after the Parrott family, who were among the first settlers in the area. The population of Parrottsville was 1,093 at the 2010 census. The town is surrounded by the Cherokee National Forest, which provides recreational opportunities such as camping, hiking, fishing, and hunting. Parrottsville’s economy is largely based on agriculture and tourism. The town is home to several farms, which produce a variety of crops, as well as several tourist attractions. The town is also home to several small businesses, including restaurants, retail stores, and service providers.
Common Questions
What is Per Capita Income in Parrottsville?
Per Capita income in Parrottsville is $23,619.
What is the Median Family Income in Parrottsville?
Median Family Income in Parrottsville is $67,273.
What is the Median Household income in Parrottsville?
Median Household Income in Parrottsville is $45,987.
What is Income or Wage Gap in Parrottsville?
Income or Wage Gap in Parrottsville is 55.8%.
Women in Parrottsville earn 44.2 cents for every dollar earned by a man.
What is Family Income Deficit in Parrottsville?
Family Income Deficit in Parrottsville is $17,775.
Families that are below poverty line in Parrottsville earn $17,775 less on average than the poverty threshold level.
What is Inequality or Gini Index in Parrottsville?
Inequality or Gini Index in Parrottsville is 0.36.
What is the Total Population of Parrottsville?
Total Population of Parrottsville is 351.
What is the Total Male Population of Parrottsville?
Total Male Population of Parrottsville is 210.
What is the Total Female Population of Parrottsville?
Total Female Population of Parrottsville is 141.
What is the Ratio of Males per 100 Females in Parrottsville?
There are 148.94 Males per 100 Females in Parrottsville.
What is the Ratio of Females per 100 Males in Parrottsville?
There are 67.14 Females per 100 Males in Parrottsville.
What is the Median Population Age in Parrottsville?
Median Population Age in Parrottsville is 43.8 Years.
What is the Average Family Size in Parrottsville
Average Family Size in Parrottsville is 3.4 People.
What is the Average Household Size in Parrottsville
Average Household Size in Parrottsville is 2.5 People.
How Large is the Labor Force in Parrottsville?
There are 151 People in the Labor Forcein in Parrottsville.
What is the Percentage of People in the Labor Force in Parrottsville?
52.4% of People are in the Labor Force in Parrottsville.
What is the Unemployment Rate in Parrottsville?
Unemployment Rate in Parrottsville is 3.3%.