Grimsley, TN Map & Demographics
Grimsley Map
Grimsley Overview
$20,154
PER CAPITA INCOME
$54,271
AVG FAMILY INCOME
$33,750
AVG HOUSEHOLD INCOME
10.7%
WAGE / INCOME GAP [ % ]
89.3¢/ $1
WAGE / INCOME GAP [ $ ]
0.30
INEQUALITY / GINI INDEX
795
TOTAL POPULATION
347
MALE POPULATION
448
FEMALE POPULATION
77.46
MALES / 100 FEMALES
129.11
FEMALES / 100 MALES
47.0
MEDIAN AGE
3.5
AVG FAMILY SIZE
2.6
AVG HOUSEHOLD SIZE
480
LABOR FORCE [ PEOPLE ]
66.3%
PERCENT IN LABOR FORCE
20.6%
UNEMPLOYMENT RATE
Grimsley Zip Codes
Grimsley Area Codes
Income in Grimsley
Income Overview in Grimsley
Per Capita Income in Grimsley is $20,154, while median incomes of families and households are $54,271 and $33,750 respectively.
| Characteristic | Number | Measure |
| Per Capita Income | 795 | $20,154 |
| Median Family Income | 185 | $54,271 |
| Mean Family Income | 185 | $58,977 |
| Median Household Income | 305 | $33,750 |
| Mean Household Income | 305 | $45,554 |
| Income Deficit | 185 | $0 |
| Wage / Income Gap (%) | 795 | 10.75% |
| Wage / Income Gap ($) | 795 | 89.25¢ per $1 |
| Gini / Inequality Index | 795 | 0.30 |
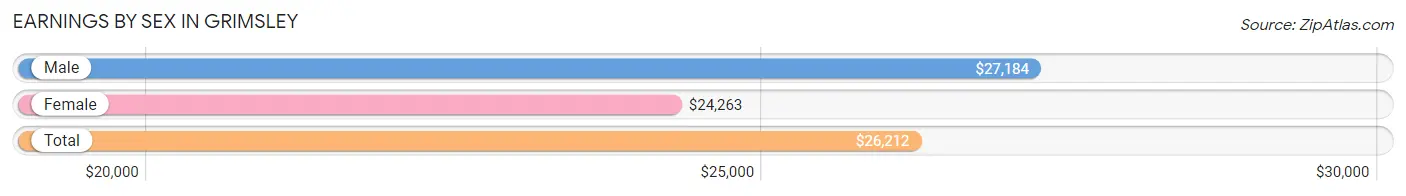
Earnings by Sex in Grimsley
Average Earnings in Grimsley are $26,212, $27,184 for men and $24,263 for women, a difference of 10.7%.
| Sex | Number | Average Earnings |
| Male | 259 (60.8%) | $27,184 |
| Female | 167 (39.2%) | $24,263 |
| Total | 426 (100.0%) | $26,212 |
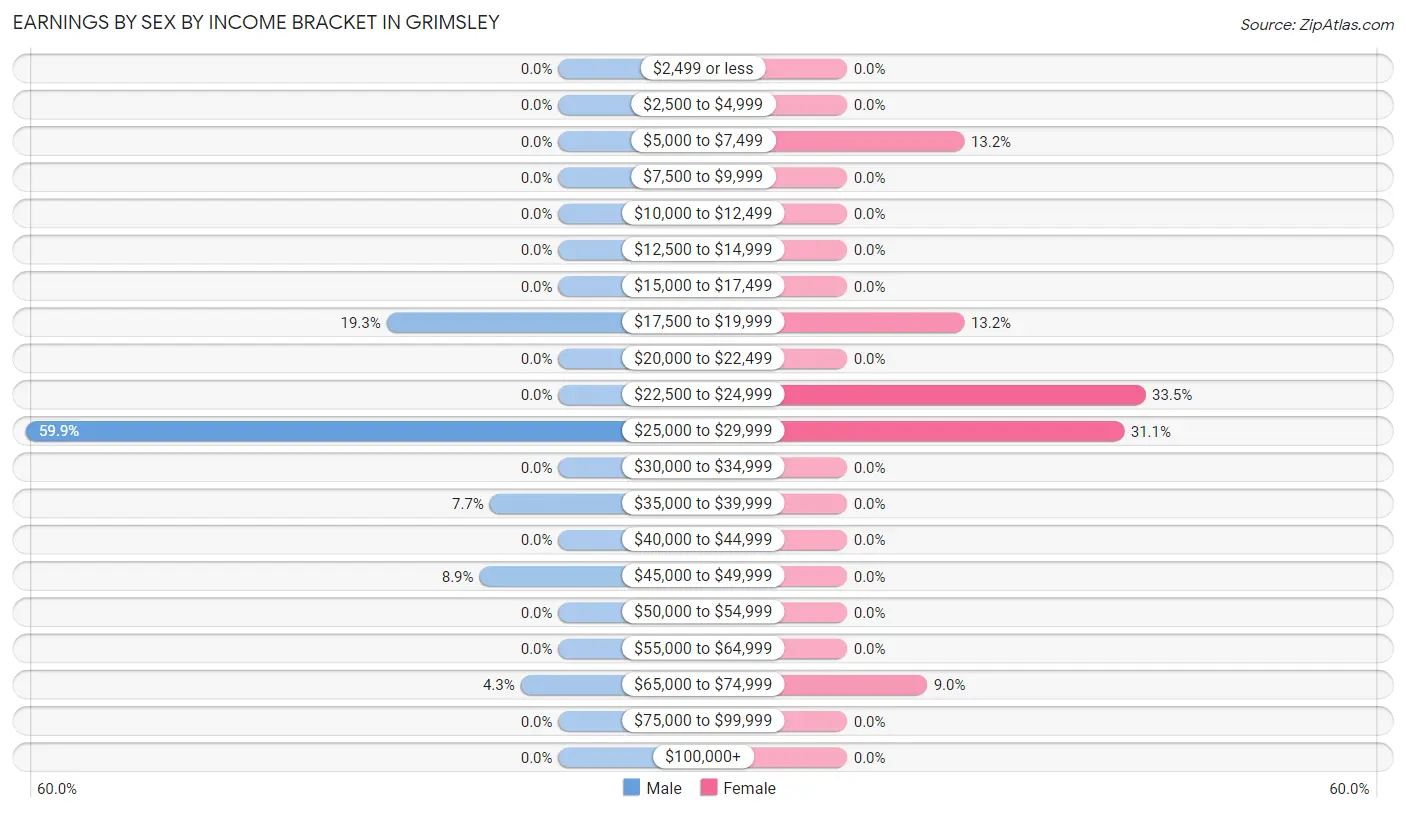
Earnings by Sex by Income Bracket in Grimsley
The most common earnings brackets in Grimsley are $25,000 to $29,999 for men (155 | 59.9%) and $22,500 to $24,999 for women (56 | 33.5%).
| Income | Male | Female |
| $2,499 or less | 0 (0.0%) | 0 (0.0%) |
| $2,500 to $4,999 | 0 (0.0%) | 0 (0.0%) |
| $5,000 to $7,499 | 0 (0.0%) | 22 (13.2%) |
| $7,500 to $9,999 | 0 (0.0%) | 0 (0.0%) |
| $10,000 to $12,499 | 0 (0.0%) | 0 (0.0%) |
| $12,500 to $14,999 | 0 (0.0%) | 0 (0.0%) |
| $15,000 to $17,499 | 0 (0.0%) | 0 (0.0%) |
| $17,500 to $19,999 | 50 (19.3%) | 22 (13.2%) |
| $20,000 to $22,499 | 0 (0.0%) | 0 (0.0%) |
| $22,500 to $24,999 | 0 (0.0%) | 56 (33.5%) |
| $25,000 to $29,999 | 155 (59.9%) | 52 (31.1%) |
| $30,000 to $34,999 | 0 (0.0%) | 0 (0.0%) |
| $35,000 to $39,999 | 20 (7.7%) | 0 (0.0%) |
| $40,000 to $44,999 | 0 (0.0%) | 0 (0.0%) |
| $45,000 to $49,999 | 23 (8.9%) | 0 (0.0%) |
| $50,000 to $54,999 | 0 (0.0%) | 0 (0.0%) |
| $55,000 to $64,999 | 0 (0.0%) | 0 (0.0%) |
| $65,000 to $74,999 | 11 (4.3%) | 15 (9.0%) |
| $75,000 to $99,999 | 0 (0.0%) | 0 (0.0%) |
| $100,000+ | 0 (0.0%) | 0 (0.0%) |
| Total | 259 (100.0%) | 167 (100.0%) |
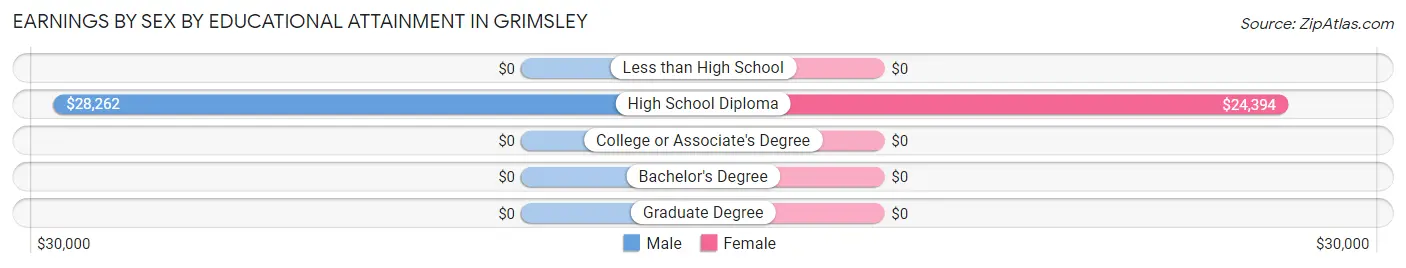
Earnings by Sex by Educational Attainment in Grimsley
Average earnings in Grimsley are $28,242 for men and $24,464 for women, a difference of 13.4%. Men with an educational attainment of high school diploma enjoy the highest average annual earnings of $28,262, while those with high school diploma education earn the least with $28,262. Women with an educational attainment of high school diploma earn the most with the average annual earnings of $24,394, while those with high school diploma education have the smallest earnings of $24,394.
| Educational Attainment | Male Income | Female Income |
| Less than High School | - | - |
| High School Diploma | $28,262 | $24,394 |
| College or Associate's Degree | - | - |
| Bachelor's Degree | - | - |
| Graduate Degree | - | - |
| Total | $28,242 | $24,464 |
Family Income in Grimsley
Family Income Brackets in Grimsley
According to the Grimsley family income data, there are 91 families falling into the $50,000 to $74,999 income range, which is the most common income bracket and makes up 49.2% of all families.

| Income Bracket | # Families | % Families |
| Less than $10,000 | 0 | 0.0% |
| $10,000 to $14,999 | 0 | 0.0% |
| $15,000 to $24,999 | 0 | 0.0% |
| $25,000 to $34,999 | 46 | 24.9% |
| $35,000 to $49,999 | 21 | 11.4% |
| $50,000 to $74,999 | 91 | 49.2% |
| $75,000 to $99,999 | 20 | 10.8% |
| $100,000 to $149,999 | 7 | 3.8% |
| $150,000 to $199,999 | 0 | 0.0% |
| $200,000+ | 0 | 0.0% |
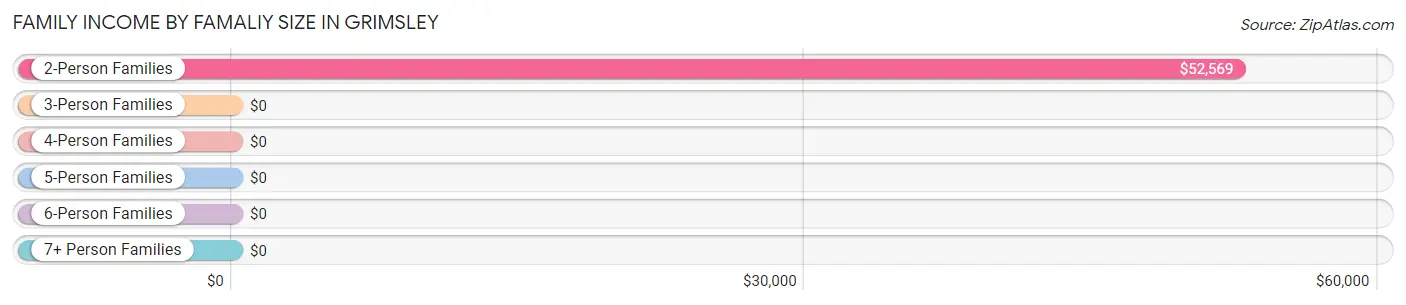
Family Income by Famaliy Size in Grimsley
2-person families (136 | 73.5%) account for the highest median family income in Grimsley with $52,569 per family, while 2-person families (136 | 73.5%) have the highest median income of $26,284 per family member.
| Income Bracket | # Families | Median Income |
| 2-Person Families | 136 (73.5%) | $52,569 |
| 3-Person Families | 7 (3.8%) | $0 |
| 4-Person Families | 0 (0.0%) | $0 |
| 5-Person Families | 0 (0.0%) | $0 |
| 6-Person Families | 22 (11.9%) | $0 |
| 7+ Person Families | 20 (10.8%) | $0 |
| Total | 185 (100.0%) | $54,271 |
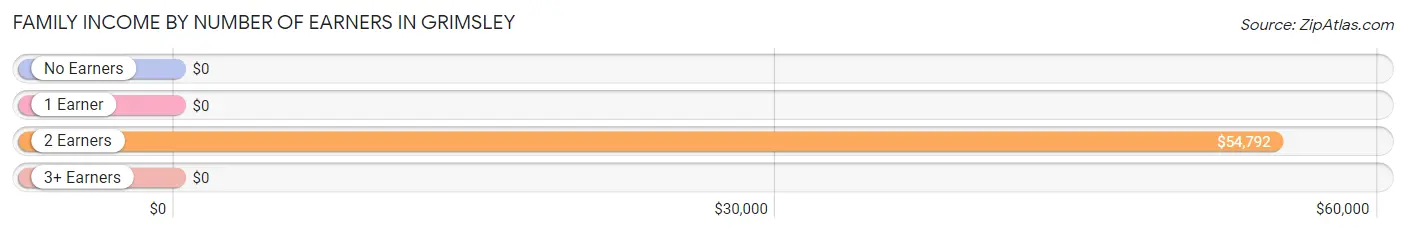
Family Income by Number of Earners in Grimsley
| Number of Earners | # Families | Median Income |
| No Earners | 46 (24.9%) | $0 |
| 1 Earner | 11 (5.9%) | $0 |
| 2 Earners | 108 (58.4%) | $54,792 |
| 3+ Earners | 20 (10.8%) | $0 |
| Total | 185 (100.0%) | $54,271 |
Household Income in Grimsley
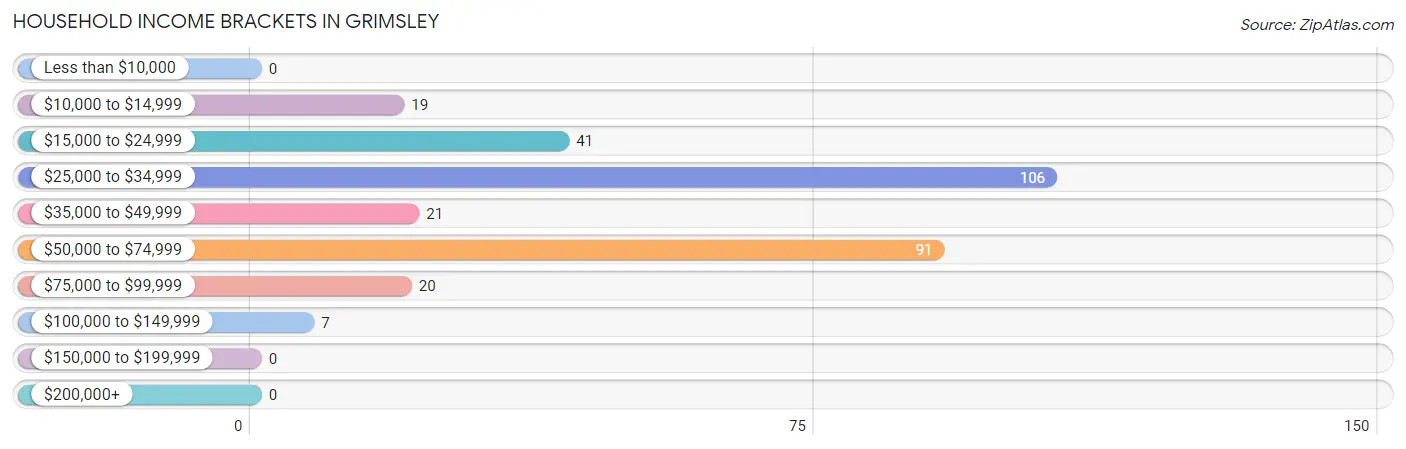
Household Income Brackets in Grimsley
With 106 households falling in the category, the $25,000 to $34,999 income range is the most frequent in Grimsley, accounting for 34.7% of all households.
| Income Bracket | # Households | % Households |
| Less than $10,000 | 0 | 0.0% |
| $10,000 to $14,999 | 19 | 6.2% |
| $15,000 to $24,999 | 41 | 13.4% |
| $25,000 to $34,999 | 106 | 34.8% |
| $35,000 to $49,999 | 21 | 6.9% |
| $50,000 to $74,999 | 91 | 29.8% |
| $75,000 to $99,999 | 20 | 6.6% |
| $100,000 to $149,999 | 7 | 2.3% |
| $150,000 to $199,999 | 0 | 0.0% |
| $200,000+ | 0 | 0.0% |
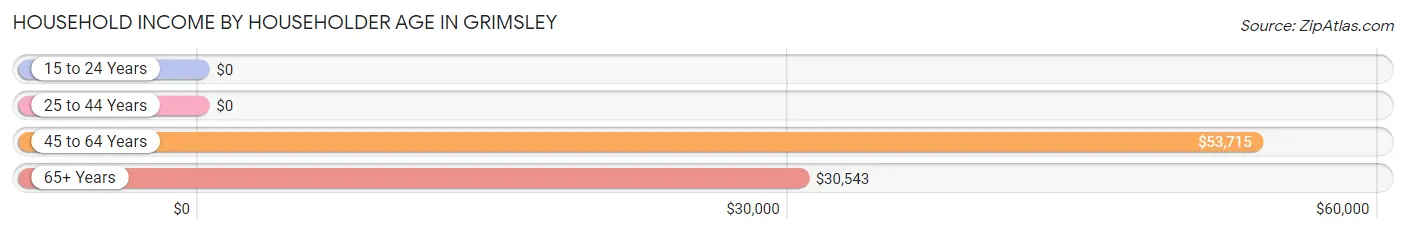
Household Income by Householder Age in Grimsley
The median household income in Grimsley is $33,750, with the highest median household income of $53,715 found in the 45 to 64 years age bracket for the primary householder. A total of 77 households (25.3%) fall into this category. Meanwhile, the 15 to 24 years age bracket for the primary householder has the lowest median household income of $0, with 22 households (7.2%) in this group.
| Income Bracket | # Households | Median Income |
| 15 to 24 Years | 22 (7.2%) | $0 |
| 25 to 44 Years | 66 (21.6%) | $0 |
| 45 to 64 Years | 77 (25.3%) | $53,715 |
| 65+ Years | 140 (45.9%) | $30,543 |
| Total | 305 (100.0%) | $33,750 |
Poverty in Grimsley
Income Below Poverty by Sex and Age in Grimsley
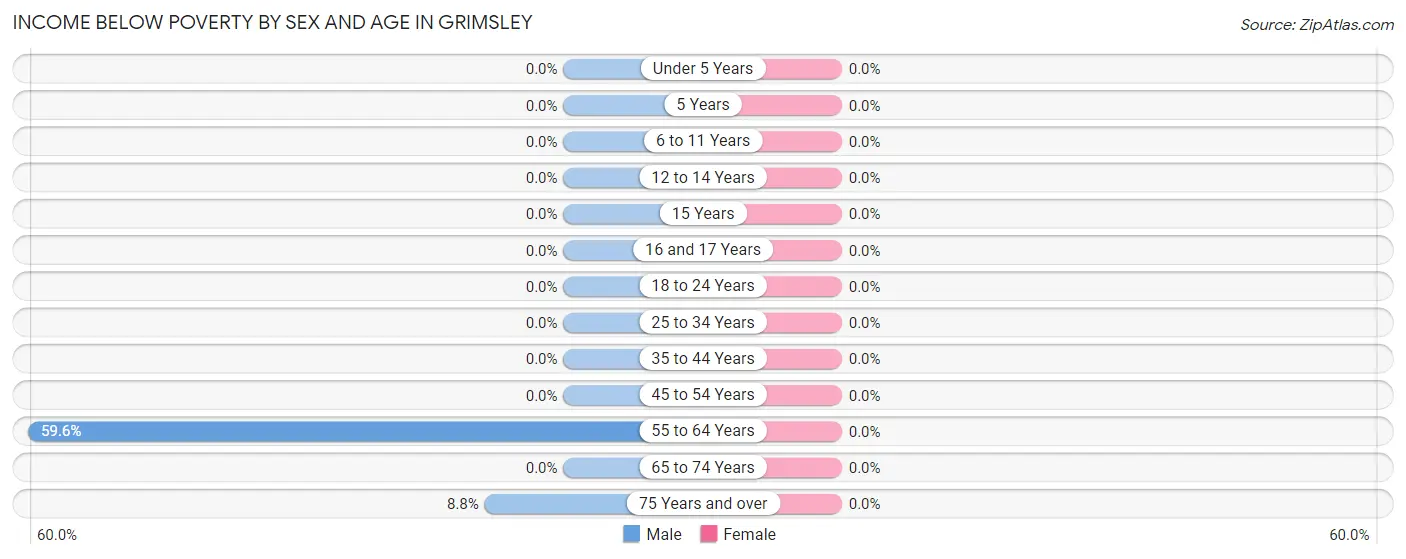
| Age Bracket | Male | Female |
| Under 5 Years | 0 (0.0%) | 0 (0.0%) |
| 5 Years | 0 (0.0%) | 0 (0.0%) |
| 6 to 11 Years | 0 (0.0%) | 0 (0.0%) |
| 12 to 14 Years | 0 (0.0%) | 0 (0.0%) |
| 15 Years | 0 (0.0%) | 0 (0.0%) |
| 16 and 17 Years | 0 (0.0%) | 0 (0.0%) |
| 18 to 24 Years | 0 (0.0%) | 0 (0.0%) |
| 25 to 34 Years | 0 (0.0%) | 0 (0.0%) |
| 35 to 44 Years | 0 (0.0%) | 0 (0.0%) |
| 45 to 54 Years | 0 (0.0%) | 0 (0.0%) |
| 55 to 64 Years | 31 (59.6%) | 0 (0.0%) |
| 65 to 74 Years | 0 (0.0%) | 0 (0.0%) |
| 75 Years and over | 5 (8.8%) | 0 (0.0%) |
| Total | 36 (10.4%) | 0 (0.0%) |
Income Above Poverty by Sex and Age in Grimsley
According to the poverty statistics in Grimsley, males aged 18 to 24 years and females aged 6 to 11 years are the age groups that are most secure financially, with 100.0% of males and 100.0% of females in these age groups living above the poverty line.
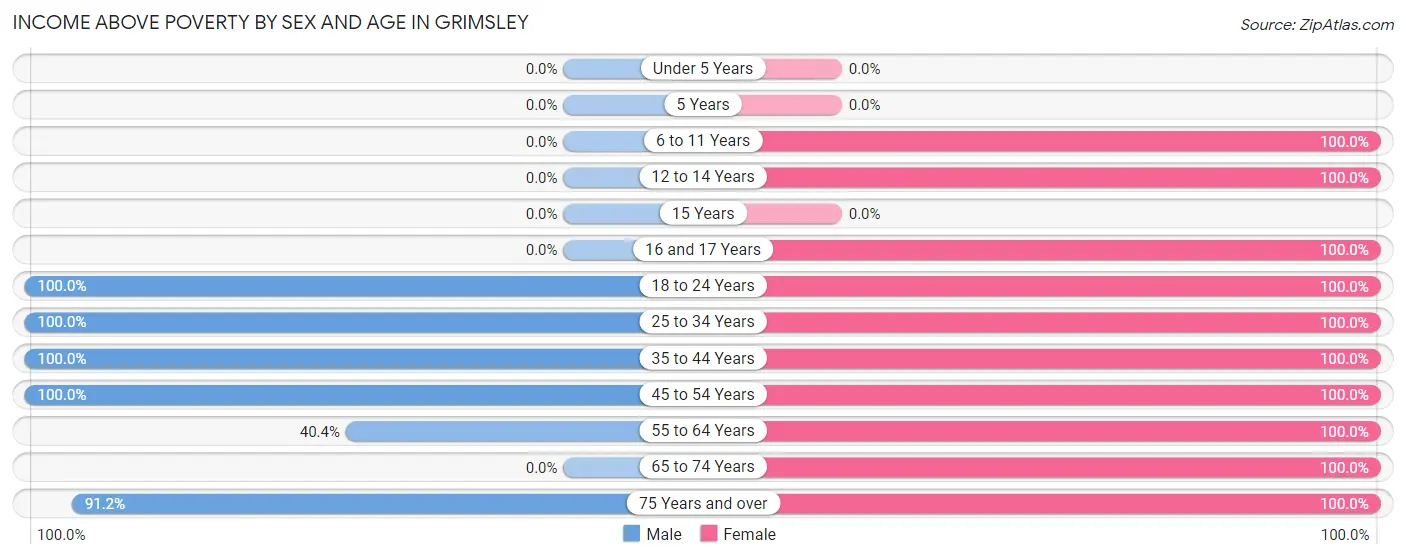
| Age Bracket | Male | Female |
| Under 5 Years | 0 (0.0%) | 0 (0.0%) |
| 5 Years | 0 (0.0%) | 0 (0.0%) |
| 6 to 11 Years | 0 (0.0%) | 48 (100.0%) |
| 12 to 14 Years | 0 (0.0%) | 23 (100.0%) |
| 15 Years | 0 (0.0%) | 0 (0.0%) |
| 16 and 17 Years | 0 (0.0%) | 76 (100.0%) |
| 18 to 24 Years | 107 (100.0%) | 43 (100.0%) |
| 25 to 34 Years | 11 (100.0%) | 33 (100.0%) |
| 35 to 44 Years | 33 (100.0%) | 22 (100.0%) |
| 45 to 54 Years | 87 (100.0%) | 61 (100.0%) |
| 55 to 64 Years | 21 (40.4%) | 38 (100.0%) |
| 65 to 74 Years | 0 (0.0%) | 27 (100.0%) |
| 75 Years and over | 52 (91.2%) | 77 (100.0%) |
| Total | 311 (89.6%) | 448 (100.0%) |
Income Below Poverty Among Married-Couple Families in Grimsley
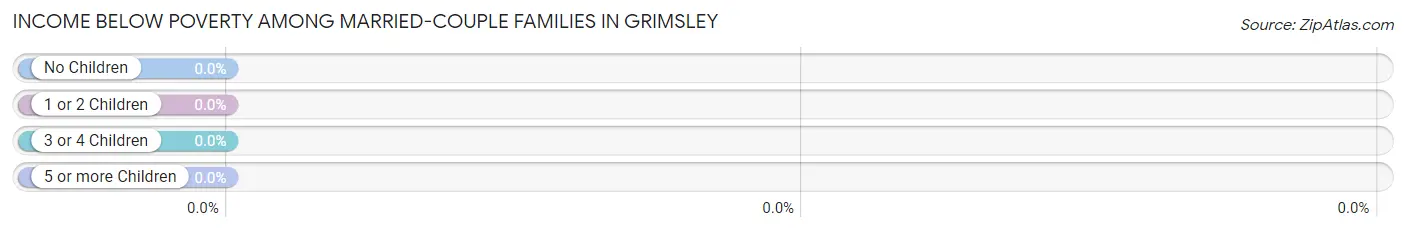
| Children | Above Poverty | Below Poverty |
| No Children | 136 (100.0%) | 0 (0.0%) |
| 1 or 2 Children | 0 (0.0%) | 0 (0.0%) |
| 3 or 4 Children | 42 (100.0%) | 0 (0.0%) |
| 5 or more Children | 0 (0.0%) | 0 (0.0%) |
| Total | 178 (100.0%) | 0 (0.0%) |
Income Below Poverty Among Single-Parent Households in Grimsley
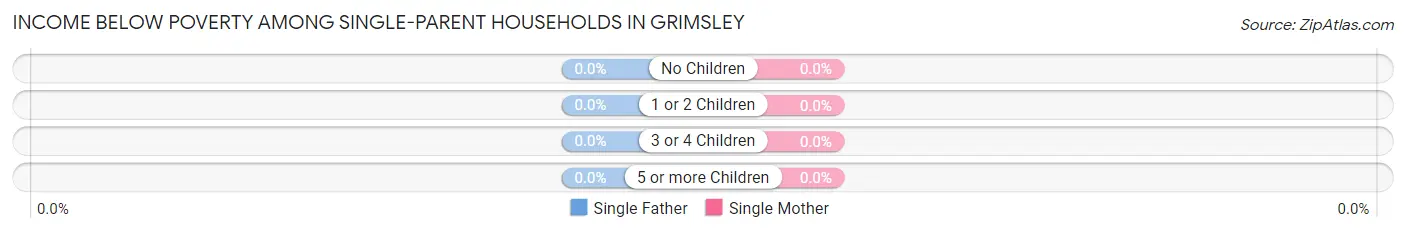
| Children | Single Father | Single Mother |
| No Children | 0 (0.0%) | 0 (0.0%) |
| 1 or 2 Children | 0 (0.0%) | 0 (0.0%) |
| 3 or 4 Children | 0 (0.0%) | 0 (0.0%) |
| 5 or more Children | 0 (0.0%) | 0 (0.0%) |
| Total | 0 (0.0%) | 0 (0.0%) |
Income Below Poverty Among Married-Couple vs Single-Parent Households in Grimsley
| Children | Married-Couple Families | Single-Parent Households |
| No Children | 0 (0.0%) | 0 (0.0%) |
| 1 or 2 Children | 0 (0.0%) | 0 (0.0%) |
| 3 or 4 Children | 0 (0.0%) | 0 (0.0%) |
| 5 or more Children | 0 (0.0%) | 0 (0.0%) |
| Total | 0 (0.0%) | 0 (0.0%) |
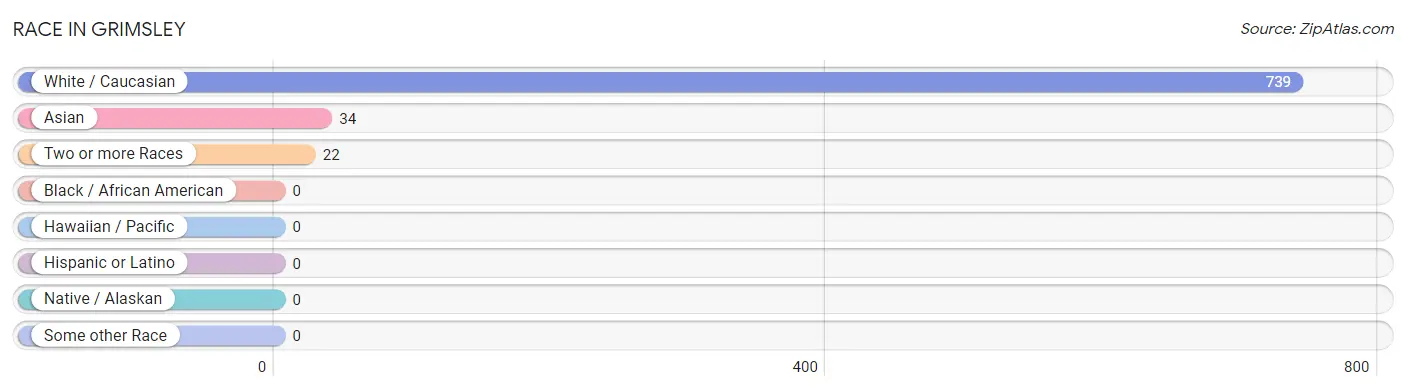
Race in Grimsley
The most populous races in Grimsley are White / Caucasian (739 | 93.0%), Asian (34 | 4.3%), and Two or more Races (22 | 2.8%).
| Race | # Population | % Population |
| Asian | 34 | 4.3% |
| Black / African American | 0 | 0.0% |
| Hawaiian / Pacific | 0 | 0.0% |
| Hispanic or Latino | 0 | 0.0% |
| Native / Alaskan | 0 | 0.0% |
| White / Caucasian | 739 | 93.0% |
| Two or more Races | 22 | 2.8% |
| Some other Race | 0 | 0.0% |
| Total | 795 | 100.0% |
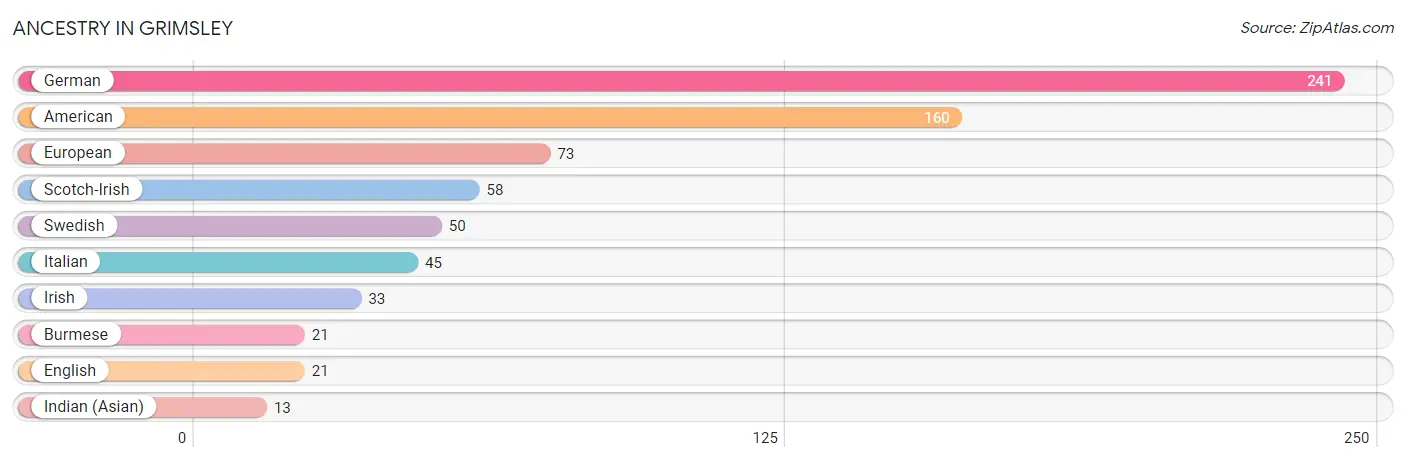
Ancestry in Grimsley
The most populous ancestries reported in Grimsley are German (241 | 30.3%), American (160 | 20.1%), European (73 | 9.2%), Scotch-Irish (58 | 7.3%), and Swedish (50 | 6.3%), together accounting for 73.2% of all Grimsley residents.
| Ancestry | # Population | % Population |
| American | 160 | 20.1% |
| Burmese | 21 | 2.6% |
| English | 21 | 2.6% |
| European | 73 | 9.2% |
| German | 241 | 30.3% |
| Indian (Asian) | 13 | 1.6% |
| Irish | 33 | 4.2% |
| Italian | 45 | 5.7% |
| Scotch-Irish | 58 | 7.3% |
| Swedish | 50 | 6.3% | View All 10 Rows |
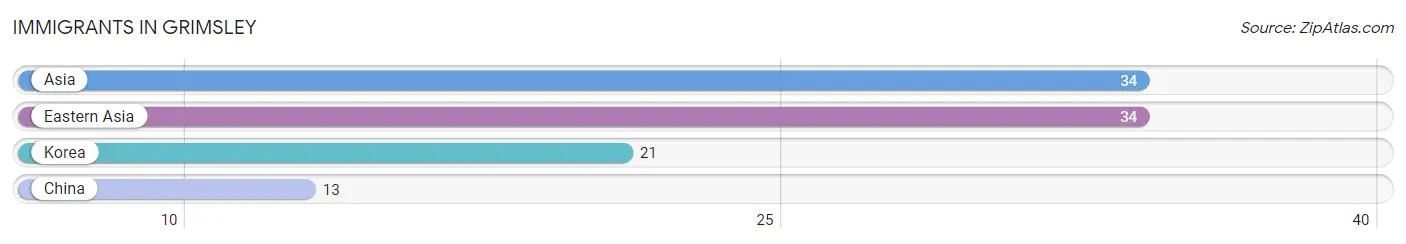
Immigrants in Grimsley
The most numerous immigrant groups reported in Grimsley came from Asia (34 | 4.3%), Eastern Asia (34 | 4.3%), Korea (21 | 2.6%), and China (13 | 1.6%), together accounting for 12.8% of all Grimsley residents.
| Immigration Origin | # Population | % Population |
| Asia | 34 | 4.3% |
| China | 13 | 1.6% |
| Eastern Asia | 34 | 4.3% |
| Korea | 21 | 2.6% | View All 4 Rows |
Sex and Age in Grimsley
Sex and Age in Grimsley
The most populous age groups in Grimsley are 20 to 24 Years (107 | 30.8%) for men and 15 to 19 Years (89 | 19.9%) for women.
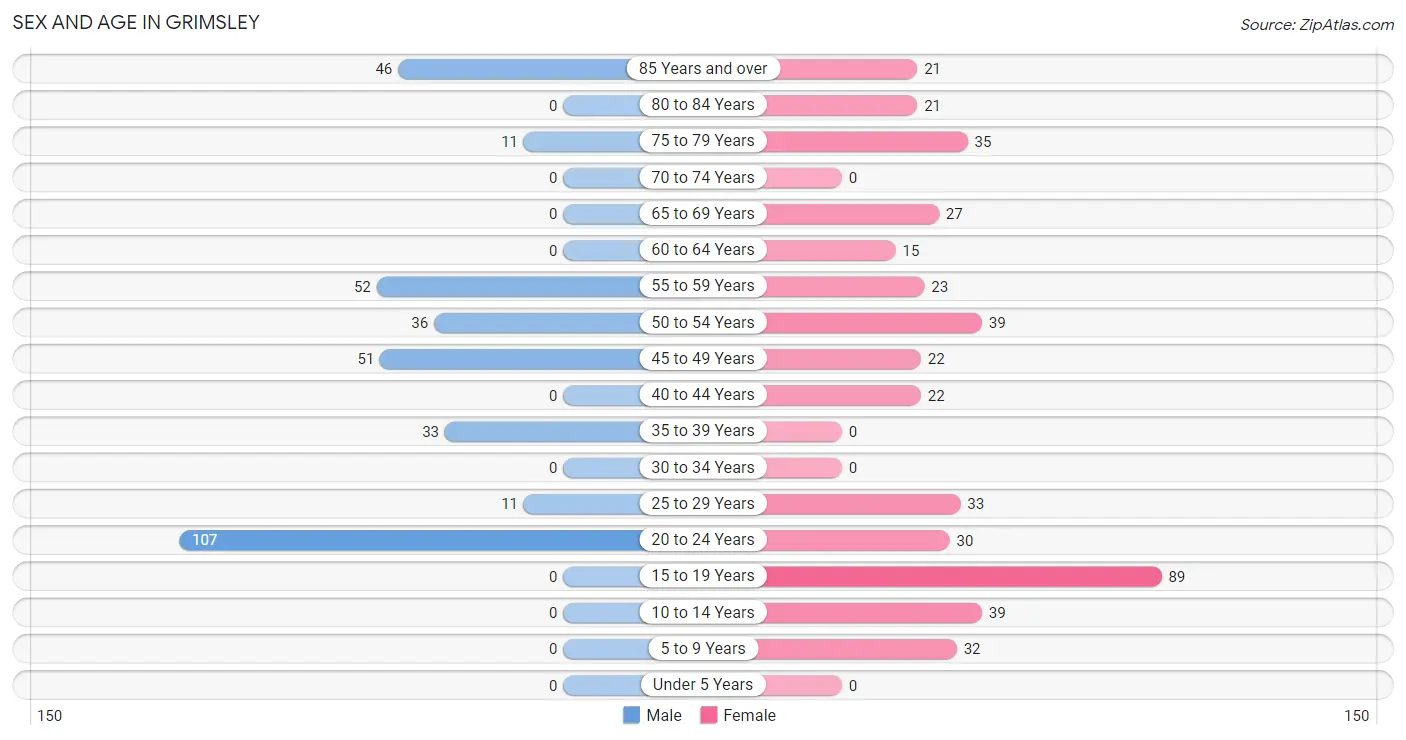
| Age Bracket | Male | Female |
| Under 5 Years | 0 (0.0%) | 0 (0.0%) |
| 5 to 9 Years | 0 (0.0%) | 32 (7.1%) |
| 10 to 14 Years | 0 (0.0%) | 39 (8.7%) |
| 15 to 19 Years | 0 (0.0%) | 89 (19.9%) |
| 20 to 24 Years | 107 (30.8%) | 30 (6.7%) |
| 25 to 29 Years | 11 (3.2%) | 33 (7.4%) |
| 30 to 34 Years | 0 (0.0%) | 0 (0.0%) |
| 35 to 39 Years | 33 (9.5%) | 0 (0.0%) |
| 40 to 44 Years | 0 (0.0%) | 22 (4.9%) |
| 45 to 49 Years | 51 (14.7%) | 22 (4.9%) |
| 50 to 54 Years | 36 (10.4%) | 39 (8.7%) |
| 55 to 59 Years | 52 (15.0%) | 23 (5.1%) |
| 60 to 64 Years | 0 (0.0%) | 15 (3.4%) |
| 65 to 69 Years | 0 (0.0%) | 27 (6.0%) |
| 70 to 74 Years | 0 (0.0%) | 0 (0.0%) |
| 75 to 79 Years | 11 (3.2%) | 35 (7.8%) |
| 80 to 84 Years | 0 (0.0%) | 21 (4.7%) |
| 85 Years and over | 46 (13.3%) | 21 (4.7%) |
| Total | 347 (100.0%) | 448 (100.0%) |
Families and Households in Grimsley
Median Family Size in Grimsley
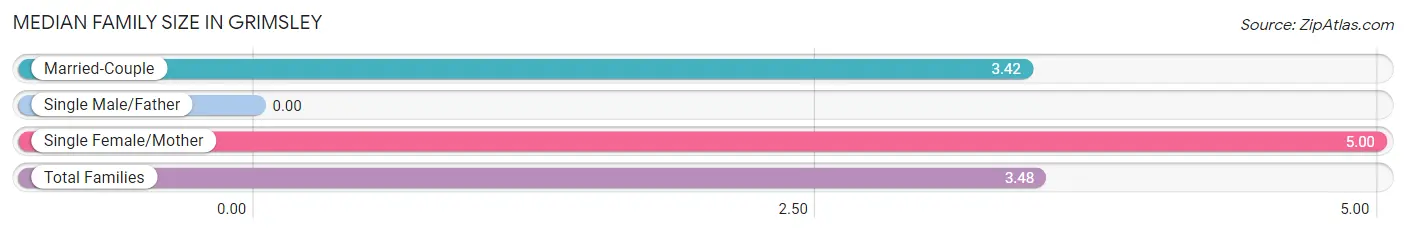
| Family Type | # Families | Family Size |
| Married-Couple | 178 (96.2%) | 3.42 |
| Single Male/Father | 0 (0.0%) | - |
| Single Female/Mother | 7 (3.8%) | 5.00 |
| Total Families | 185 (100.0%) | 3.48 |
Median Household Size in Grimsley
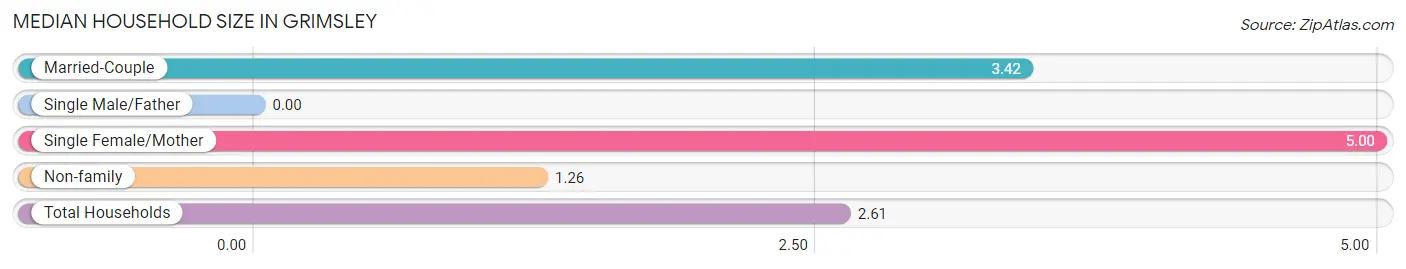
| Household Type | # Households | Household Size |
| Married-Couple | 178 (58.4%) | 3.42 |
| Single Male/Father | 0 (0.0%) | - |
| Single Female/Mother | 7 (2.3%) | 5.00 |
| Non-family | 120 (39.3%) | 1.26 |
| Total Households | 305 (100.0%) | 2.61 |
Household Size by Marriage Status in Grimsley
Out of a total of 305 households in Grimsley, 185 (60.7%) are family households, while 120 (39.3%) are nonfamily households. The most numerous type of family households are 2-person households, comprising 136, and the most common type of nonfamily households are 1-person households, comprising 106.
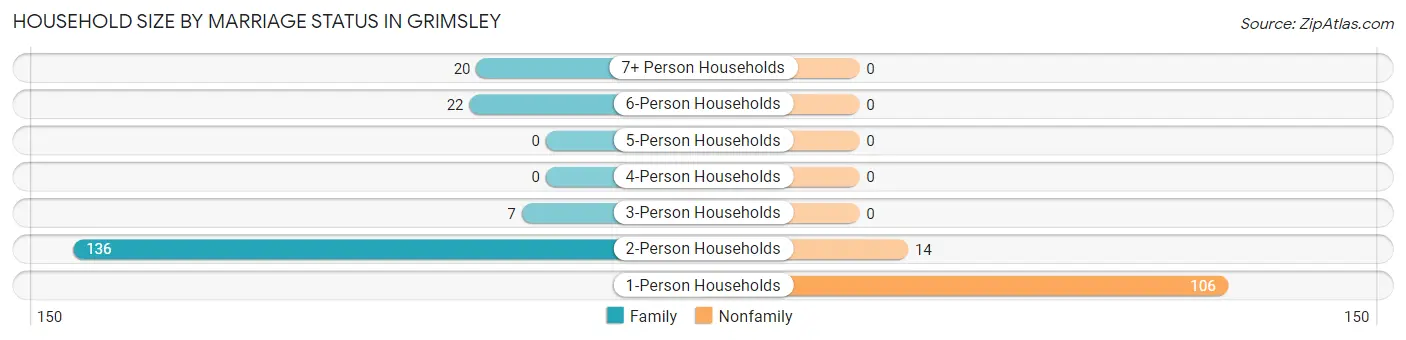
| Household Size | Family Households | Nonfamily Households |
| 1-Person Households | - | 106 (34.7%) |
| 2-Person Households | 136 (44.6%) | 14 (4.6%) |
| 3-Person Households | 7 (2.3%) | 0 (0.0%) |
| 4-Person Households | 0 (0.0%) | 0 (0.0%) |
| 5-Person Households | 0 (0.0%) | 0 (0.0%) |
| 6-Person Households | 22 (7.2%) | 0 (0.0%) |
| 7+ Person Households | 20 (6.6%) | 0 (0.0%) |
| Total | 185 (60.7%) | 120 (39.3%) |
Female Fertility in Grimsley
Fertility by Age in Grimsley
| Age Bracket | Women with Births | Births / 1,000 Women |
| 15 to 19 years | 0 (0.0%) | 0.0 |
| 20 to 34 years | 0 (0.0%) | 0.0 |
| 35 to 50 years | 0 (0.0%) | 0.0 |
| Total | 0 (0.0%) | 0.0 |
Fertility by Age by Marriage Status in Grimsley
| Age Bracket | Married | Unmarried |
| 15 to 19 years | 0 (0.0%) | 0 (0.0%) |
| 20 to 34 years | 0 (0.0%) | 0 (0.0%) |
| 35 to 50 years | 0 (0.0%) | 0 (0.0%) |
| Total | 0 (0.0%) | 0 (0.0%) |
Fertility by Education in Grimsley
| Educational Attainment | Women with Births | Births / 1,000 Women |
| Less than High School | 0 (0.0%) | 0.0 |
| High School Diploma | 0 (0.0%) | 0.0 |
| College or Associate's Degree | 0 (0.0%) | 0.0 |
| Bachelor's Degree | 0 (0.0%) | 0.0 |
| Graduate Degree | 0 (0.0%) | 0.0 |
| Total | 0 (0.0%) | 0.0 |
Fertility by Education by Marriage Status in Grimsley
| Educational Attainment | Married | Unmarried |
| Less than High School | 0 (0.0%) | 0 (0.0%) |
| High School Diploma | 0 (0.0%) | 0 (0.0%) |
| College or Associate's Degree | 0 (0.0%) | 0 (0.0%) |
| Bachelor's Degree | 0 (0.0%) | 0 (0.0%) |
| Graduate Degree | 0 (0.0%) | 0 (0.0%) |
| Total | 0 (0.0%) | 0 (0.0%) |
Employment Characteristics in Grimsley
Employment by Class of Employer in Grimsley
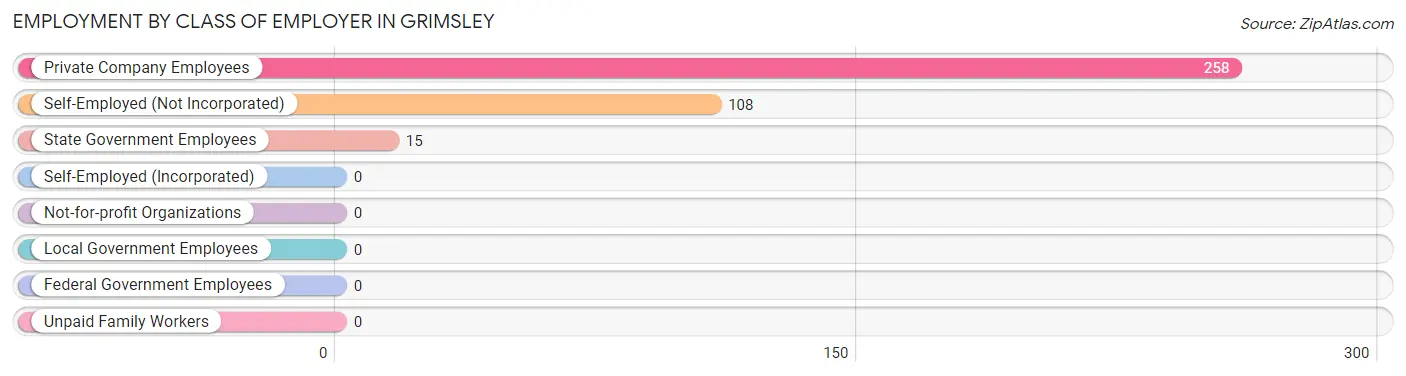
Among the 381 employed individuals in Grimsley, private company employees (258 | 67.7%), self-employed (not incorporated) (108 | 28.3%), and state government employees (15 | 3.9%) make up the most common classes of employment.
| Employer Class | # Employees | % Employees |
| Private Company Employees | 258 | 67.7% |
| Self-Employed (Incorporated) | 0 | 0.0% |
| Self-Employed (Not Incorporated) | 108 | 28.3% |
| Not-for-profit Organizations | 0 | 0.0% |
| Local Government Employees | 0 | 0.0% |
| State Government Employees | 15 | 3.9% |
| Federal Government Employees | 0 | 0.0% |
| Unpaid Family Workers | 0 | 0.0% |
| Total | 381 | 100.0% |
Employment Status by Age in Grimsley
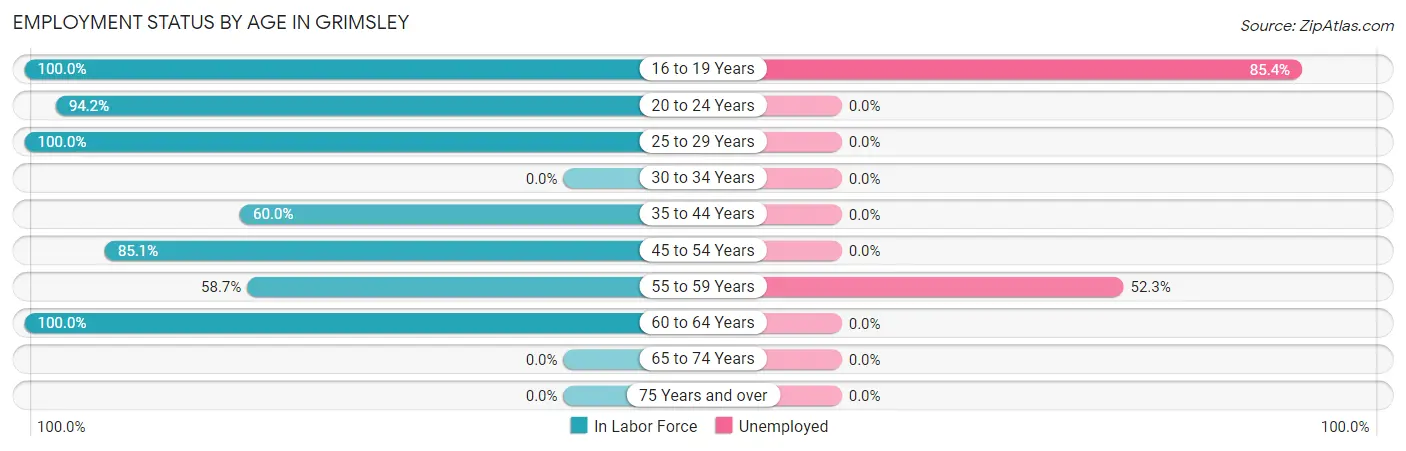
According to the labor force statistics for Grimsley, out of the total population over 16 years of age (724), 66.3% or 480 individuals are in the labor force, with 20.6% or 99 of them unemployed. The age group with the highest labor force participation rate is 16 to 19 years, with 100.0% or 89 individuals in the labor force. Within the labor force, the 16 to 19 years age range has the highest percentage of unemployed individuals, with 85.4% or 76 of them being unemployed.
| Age Bracket | In Labor Force | Unemployed |
| 16 to 19 Years | 89 (100.0%) | 76 (85.4%) |
| 20 to 24 Years | 129 (94.2%) | 0 (0.0%) |
| 25 to 29 Years | 44 (100.0%) | 0 (0.0%) |
| 30 to 34 Years | 0 (0.0%) | 0 (0.0%) |
| 35 to 44 Years | 33 (60.0%) | 0 (0.0%) |
| 45 to 54 Years | 126 (85.1%) | 0 (0.0%) |
| 55 to 59 Years | 44 (58.7%) | 23 (52.3%) |
| 60 to 64 Years | 15 (100.0%) | 0 (0.0%) |
| 65 to 74 Years | 0 (0.0%) | 0 (0.0%) |
| 75 Years and over | 0 (0.0%) | 0 (0.0%) |
| Total | 480 (66.3%) | 99 (20.6%) |
Employment Status by Educational Attainment in Grimsley
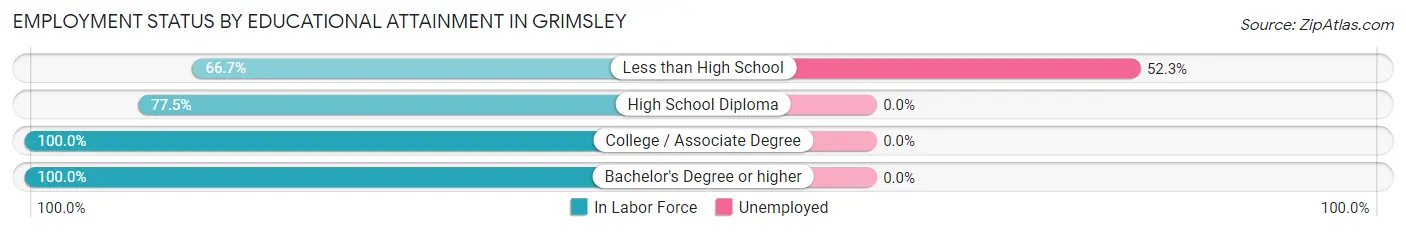
According to labor force statistics for Grimsley, 77.7% of individuals (262) out of the total population between 25 and 64 years of age (337) are in the labor force, with 8.8% or 23 of them being unemployed. The group with the highest labor force participation rate are those with the educational attainment of college / associate degree, with 100.0% or 20 individuals in the labor force. Within the labor force, individuals with less than high school education have the highest percentage of unemployment, with 52.3% or 23 of them being unemployed.
| Educational Attainment | In Labor Force | Unemployed |
| Less than High School | 44 (66.7%) | 35 (52.3%) |
| High School Diploma | 183 (77.5%) | 0 (0.0%) |
| College / Associate Degree | 20 (100.0%) | 0 (0.0%) |
| Bachelor's Degree or higher | 15 (100.0%) | 0 (0.0%) |
| Total | 262 (77.7%) | 30 (8.8%) |
Employment Occupations by Sex in Grimsley
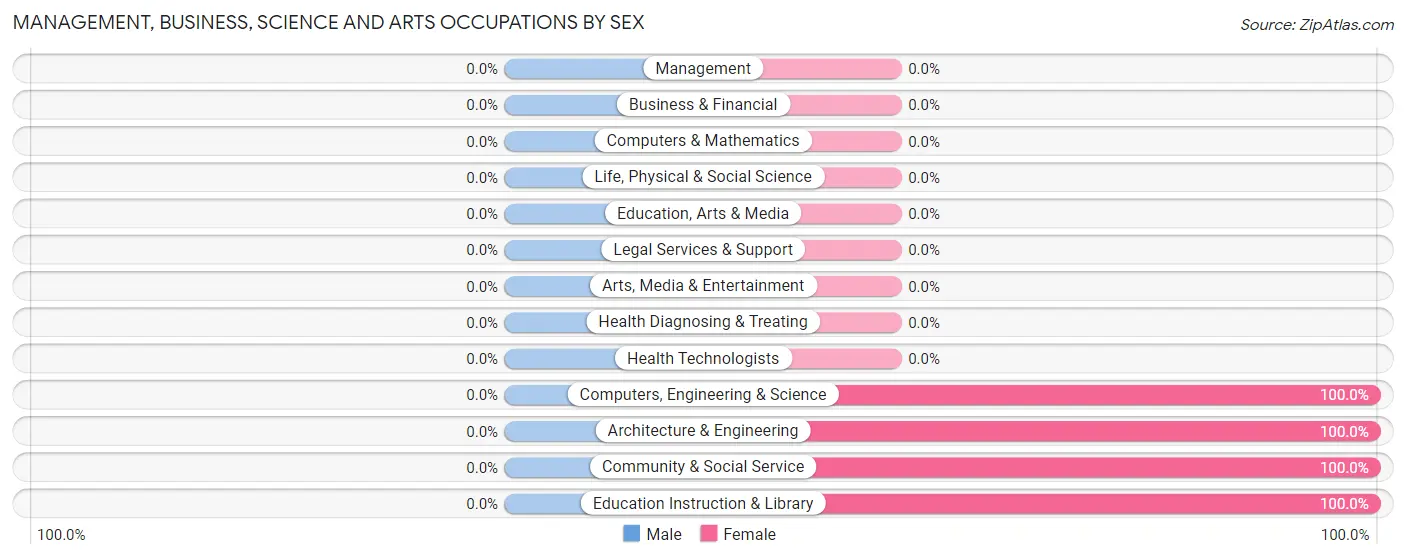
Management, Business, Science and Arts Occupations
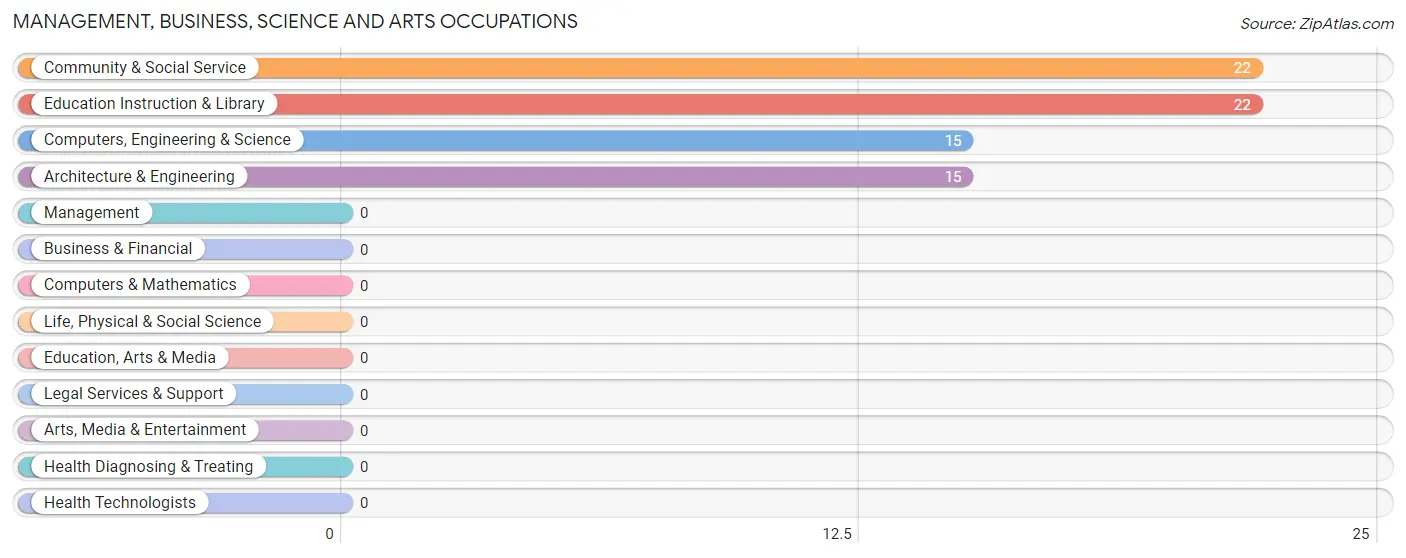
The most common Management, Business, Science and Arts occupations in Grimsley are Community & Social Service (22 | 5.8%), Education Instruction & Library (22 | 5.8%), Computers, Engineering & Science (15 | 3.9%), and Architecture & Engineering (15 | 3.9%).
Management, Business, Science and Arts Occupations by Sex
| Occupation | Male | Female |
| Management | 0 (0.0%) | 0 (0.0%) |
| Business & Financial | 0 (0.0%) | 0 (0.0%) |
| Computers, Engineering & Science | 0 (0.0%) | 15 (100.0%) |
| Computers & Mathematics | 0 (0.0%) | 0 (0.0%) |
| Architecture & Engineering | 0 (0.0%) | 15 (100.0%) |
| Life, Physical & Social Science | 0 (0.0%) | 0 (0.0%) |
| Community & Social Service | 0 (0.0%) | 22 (100.0%) |
| Education, Arts & Media | 0 (0.0%) | 0 (0.0%) |
| Legal Services & Support | 0 (0.0%) | 0 (0.0%) |
| Education Instruction & Library | 0 (0.0%) | 22 (100.0%) |
| Arts, Media & Entertainment | 0 (0.0%) | 0 (0.0%) |
| Health Diagnosing & Treating | 0 (0.0%) | 0 (0.0%) |
| Health Technologists | 0 (0.0%) | 0 (0.0%) |
| Total (Category) | 0 (0.0%) | 37 (100.0%) |
| Total (Overall) | 259 (68.0%) | 122 (32.0%) |
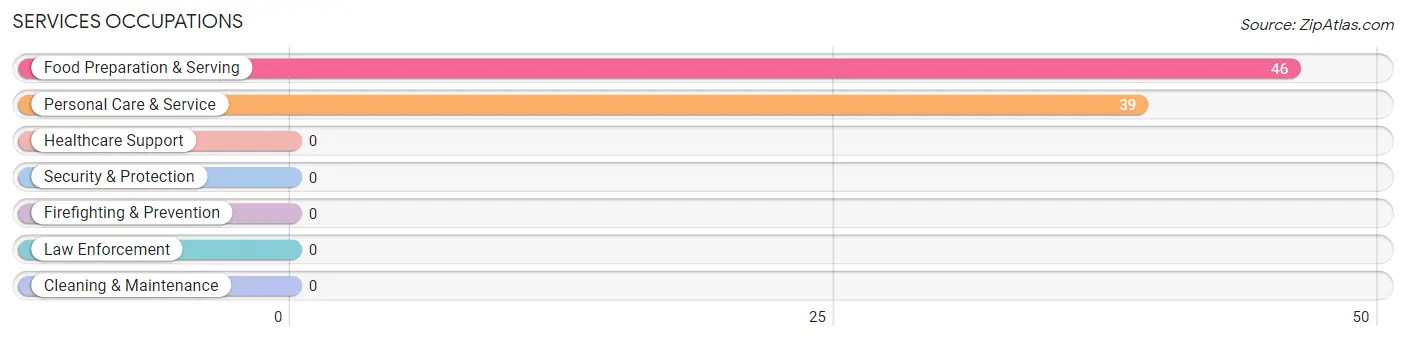
Services Occupations
The most common Services occupations in Grimsley are Food Preparation & Serving (46 | 12.1%), and Personal Care & Service (39 | 10.2%).
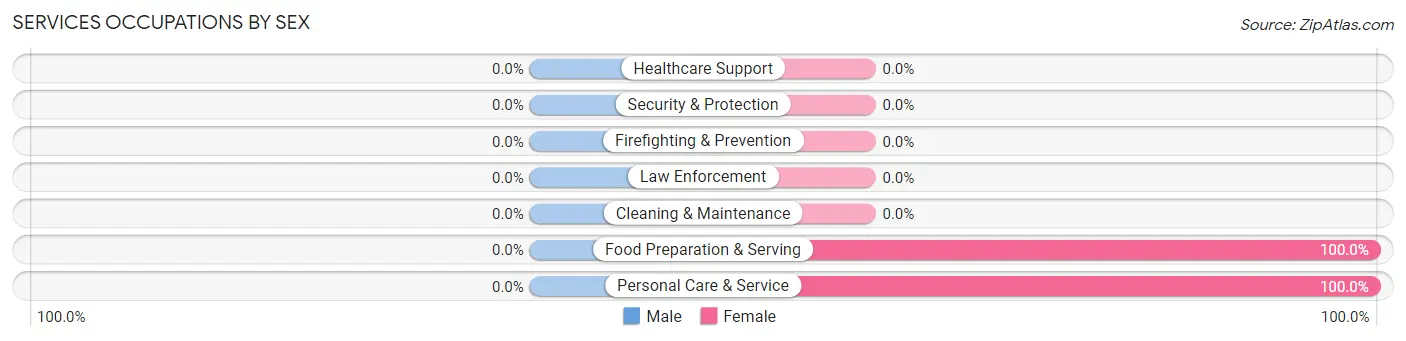
Services Occupations by Sex
| Occupation | Male | Female |
| Healthcare Support | 0 (0.0%) | 0 (0.0%) |
| Security & Protection | 0 (0.0%) | 0 (0.0%) |
| Firefighting & Prevention | 0 (0.0%) | 0 (0.0%) |
| Law Enforcement | 0 (0.0%) | 0 (0.0%) |
| Food Preparation & Serving | 0 (0.0%) | 46 (100.0%) |
| Cleaning & Maintenance | 0 (0.0%) | 0 (0.0%) |
| Personal Care & Service | 0 (0.0%) | 39 (100.0%) |
| Total (Category) | 0 (0.0%) | 85 (100.0%) |
| Total (Overall) | 259 (68.0%) | 122 (32.0%) |
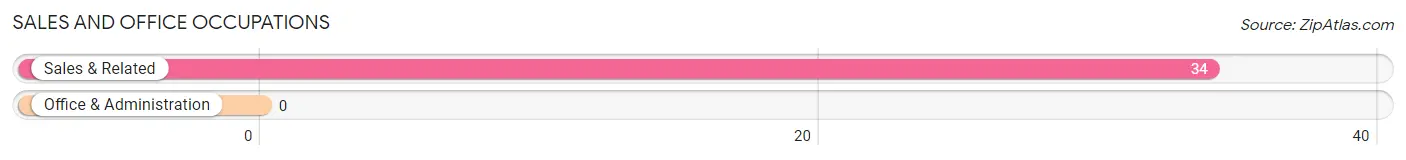
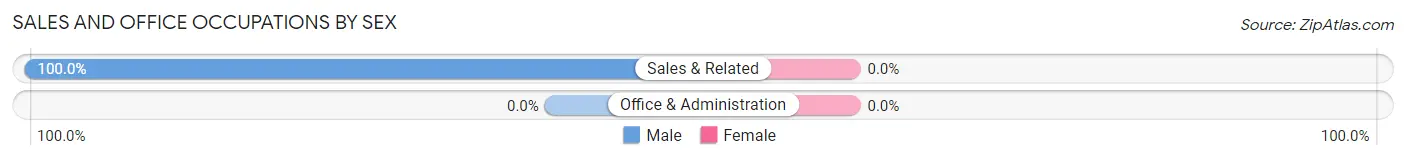
Sales and Office Occupations
The most common Sales and Office occupations in Grimsley are , and Sales & Related (34 | 8.9%).
Sales and Office Occupations by Sex
| Occupation | Male | Female |
| Sales & Related | 34 (100.0%) | 0 (0.0%) |
| Office & Administration | 0 (0.0%) | 0 (0.0%) |
| Total (Category) | 34 (100.0%) | 0 (0.0%) |
| Total (Overall) | 259 (68.0%) | 122 (32.0%) |
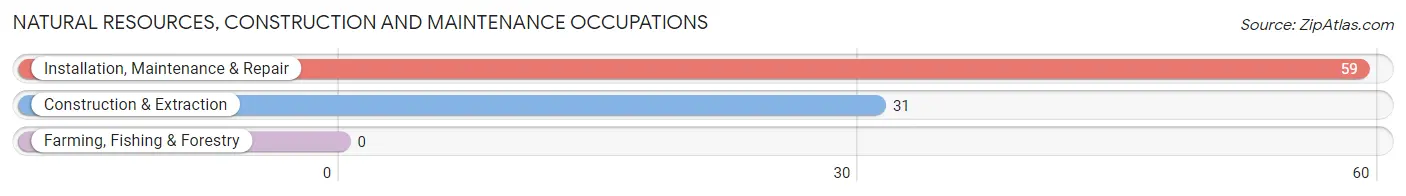
Natural Resources, Construction and Maintenance Occupations
The most common Natural Resources, Construction and Maintenance occupations in Grimsley are Installation, Maintenance & Repair (59 | 15.5%), and Construction & Extraction (31 | 8.1%).
Natural Resources, Construction and Maintenance Occupations by Sex
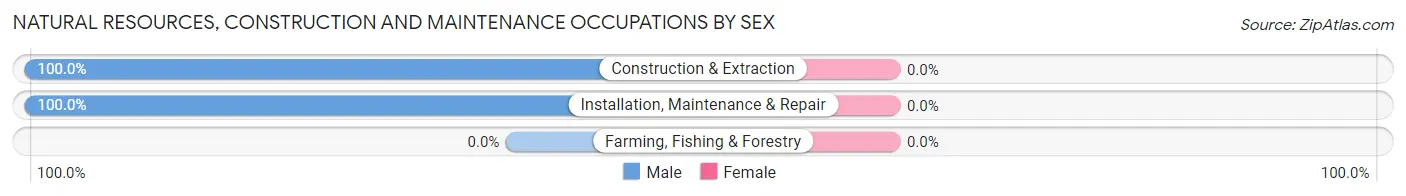
| Occupation | Male | Female |
| Farming, Fishing & Forestry | 0 (0.0%) | 0 (0.0%) |
| Construction & Extraction | 31 (100.0%) | 0 (0.0%) |
| Installation, Maintenance & Repair | 59 (100.0%) | 0 (0.0%) |
| Total (Category) | 90 (100.0%) | 0 (0.0%) |
| Total (Overall) | 259 (68.0%) | 122 (32.0%) |
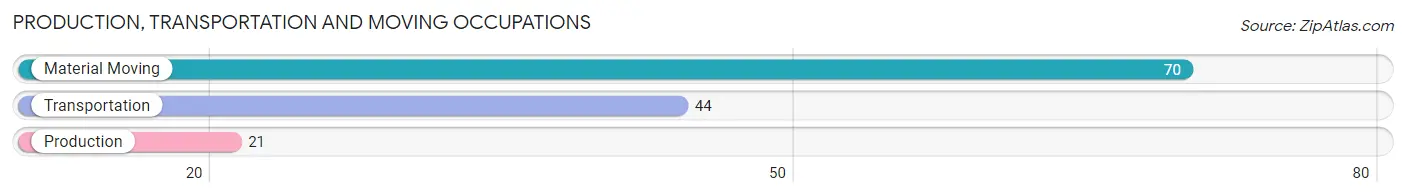
Production, Transportation and Moving Occupations
The most common Production, Transportation and Moving occupations in Grimsley are Material Moving (70 | 18.4%), Transportation (44 | 11.6%), and Production (21 | 5.5%).
Production, Transportation and Moving Occupations by Sex
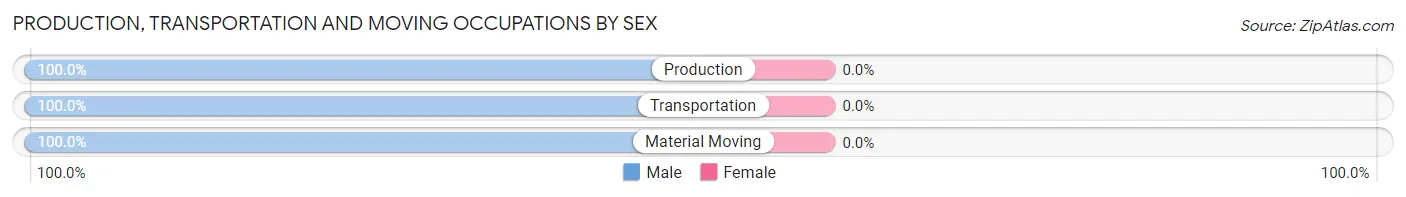
| Occupation | Male | Female |
| Production | 21 (100.0%) | 0 (0.0%) |
| Transportation | 44 (100.0%) | 0 (0.0%) |
| Material Moving | 70 (100.0%) | 0 (0.0%) |
| Total (Category) | 135 (100.0%) | 0 (0.0%) |
| Total (Overall) | 259 (68.0%) | 122 (32.0%) |
Employment Industries by Sex in Grimsley
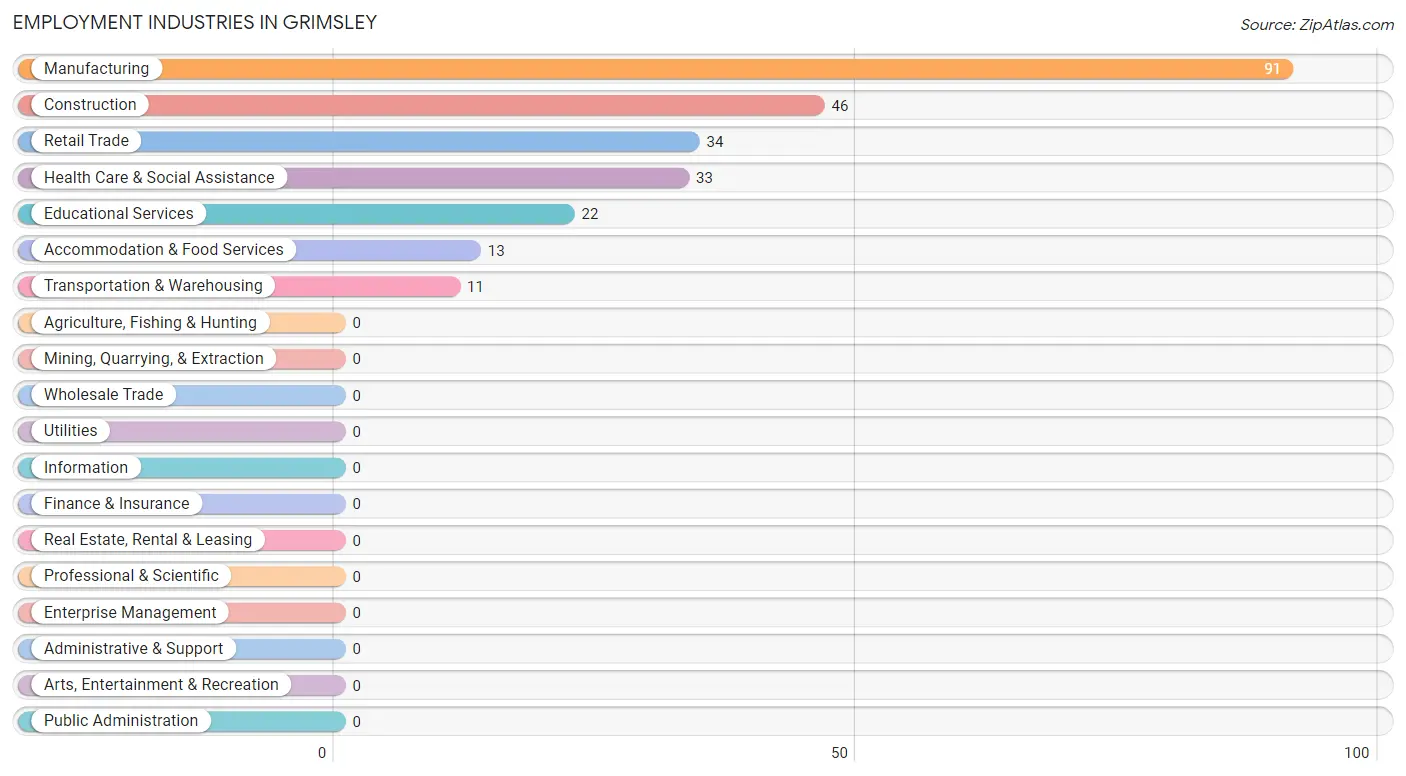
Employment Industries in Grimsley
The major employment industries in Grimsley include Manufacturing (91 | 23.9%), Construction (46 | 12.1%), Retail Trade (34 | 8.9%), Health Care & Social Assistance (33 | 8.7%), and Educational Services (22 | 5.8%).
Employment Industries by Sex in Grimsley
The Grimsley industries that see more men than women are Manufacturing (100.0%), Retail Trade (100.0%), and Transportation & Warehousing (100.0%), whereas the industries that tend to have a higher number of women are Educational Services (100.0%), Health Care & Social Assistance (100.0%), and Accommodation & Food Services (100.0%).
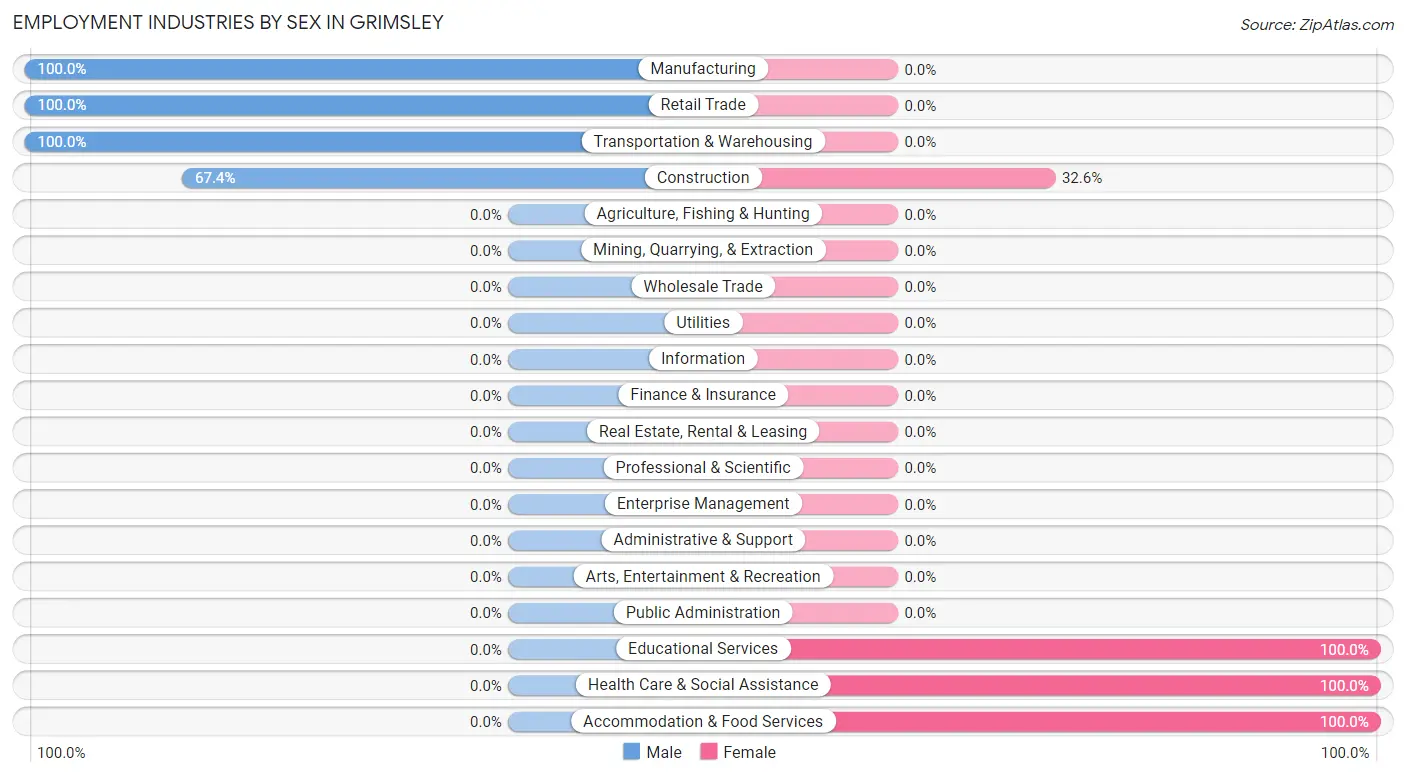
| Industry | Male | Female |
| Agriculture, Fishing & Hunting | 0 (0.0%) | 0 (0.0%) |
| Mining, Quarrying, & Extraction | 0 (0.0%) | 0 (0.0%) |
| Construction | 31 (67.4%) | 15 (32.6%) |
| Manufacturing | 91 (100.0%) | 0 (0.0%) |
| Wholesale Trade | 0 (0.0%) | 0 (0.0%) |
| Retail Trade | 34 (100.0%) | 0 (0.0%) |
| Transportation & Warehousing | 11 (100.0%) | 0 (0.0%) |
| Utilities | 0 (0.0%) | 0 (0.0%) |
| Information | 0 (0.0%) | 0 (0.0%) |
| Finance & Insurance | 0 (0.0%) | 0 (0.0%) |
| Real Estate, Rental & Leasing | 0 (0.0%) | 0 (0.0%) |
| Professional & Scientific | 0 (0.0%) | 0 (0.0%) |
| Enterprise Management | 0 (0.0%) | 0 (0.0%) |
| Administrative & Support | 0 (0.0%) | 0 (0.0%) |
| Educational Services | 0 (0.0%) | 22 (100.0%) |
| Health Care & Social Assistance | 0 (0.0%) | 33 (100.0%) |
| Arts, Entertainment & Recreation | 0 (0.0%) | 0 (0.0%) |
| Accommodation & Food Services | 0 (0.0%) | 13 (100.0%) |
| Public Administration | 0 (0.0%) | 0 (0.0%) |
| Total | 259 (68.0%) | 122 (32.0%) |
Education in Grimsley
School Enrollment in Grimsley
The most common levels of schooling among the 160 students in Grimsley are high school (99 | 61.9%), elementary school (48 | 30.0%), and college / undergraduate (13 | 8.1%).
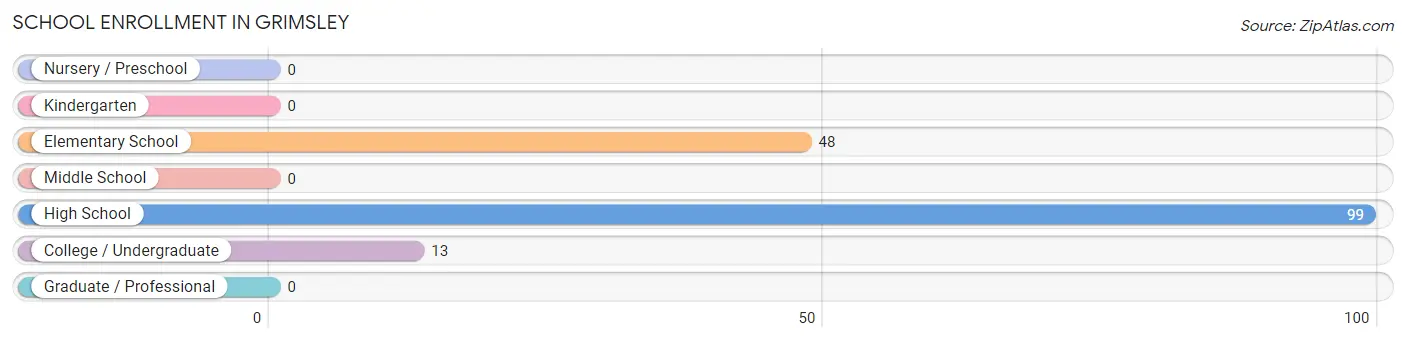
| School Level | # Students | % Students |
| Nursery / Preschool | 0 | 0.0% |
| Kindergarten | 0 | 0.0% |
| Elementary School | 48 | 30.0% |
| Middle School | 0 | 0.0% |
| High School | 99 | 61.9% |
| College / Undergraduate | 13 | 8.1% |
| Graduate / Professional | 0 | 0.0% |
| Total | 160 | 100.0% |
School Enrollment by Age by Funding Source in Grimsley
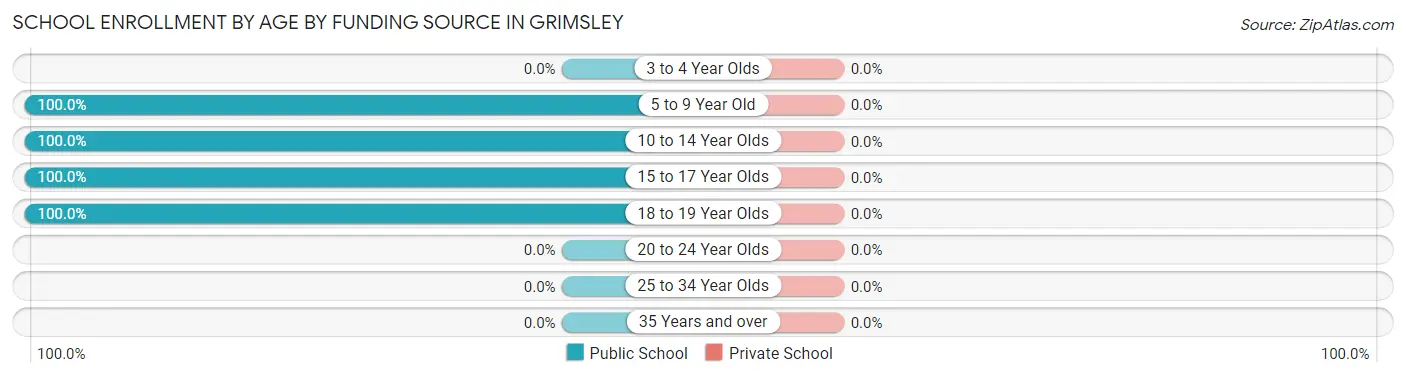
| Age Bracket | Public School | Private School |
| 3 to 4 Year Olds | 0 (0.0%) | 0 (0.0%) |
| 5 to 9 Year Old | 32 (100.0%) | 0 (0.0%) |
| 10 to 14 Year Olds | 39 (100.0%) | 0 (0.0%) |
| 15 to 17 Year Olds | 76 (100.0%) | 0 (0.0%) |
| 18 to 19 Year Olds | 13 (100.0%) | 0 (0.0%) |
| 20 to 24 Year Olds | 0 (0.0%) | 0 (0.0%) |
| 25 to 34 Year Olds | 0 (0.0%) | 0 (0.0%) |
| 35 Years and over | 0 (0.0%) | 0 (0.0%) |
| Total | 160 (100.0%) | 0 (0.0%) |
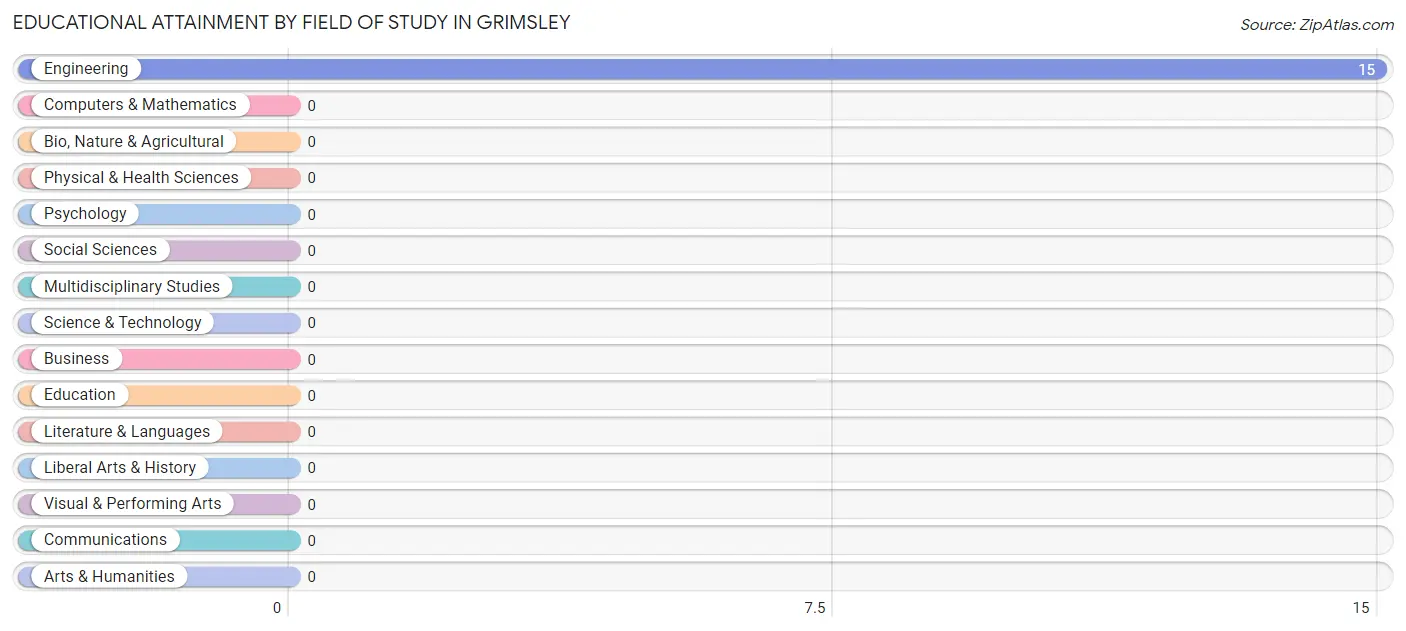
Educational Attainment by Field of Study in Grimsley
, and engineering (15 | 100.0%) are the most common fields of study among 15 individuals in Grimsley who have obtained a bachelor's degree or higher.
| Field of Study | # Graduates | % Graduates |
| Computers & Mathematics | 0 | 0.0% |
| Bio, Nature & Agricultural | 0 | 0.0% |
| Physical & Health Sciences | 0 | 0.0% |
| Psychology | 0 | 0.0% |
| Social Sciences | 0 | 0.0% |
| Engineering | 15 | 100.0% |
| Multidisciplinary Studies | 0 | 0.0% |
| Science & Technology | 0 | 0.0% |
| Business | 0 | 0.0% |
| Education | 0 | 0.0% |
| Literature & Languages | 0 | 0.0% |
| Liberal Arts & History | 0 | 0.0% |
| Visual & Performing Arts | 0 | 0.0% |
| Communications | 0 | 0.0% |
| Arts & Humanities | 0 | 0.0% |
| Total | 15 | 100.0% |
Transportation & Commute in Grimsley
Vehicle Availability by Sex in Grimsley
The most prevalent vehicle ownership categories in Grimsley are males with 4 vehicles (194, accounting for 74.9%) and females with 4 vehicles (94, making up 159.0%).
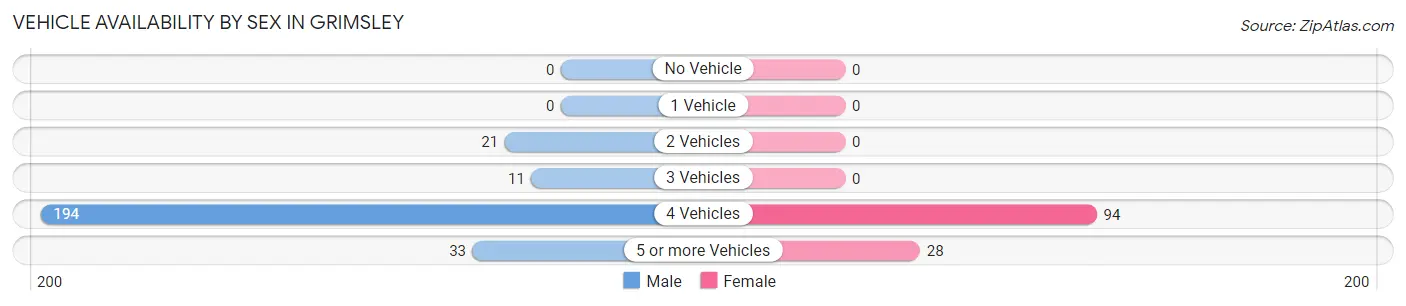
| Vehicles Available | Male | Female |
| No Vehicle | 0 (0.0%) | 0 (0.0%) |
| 1 Vehicle | 0 (0.0%) | 0 (0.0%) |
| 2 Vehicles | 21 (8.1%) | 0 (0.0%) |
| 3 Vehicles | 11 (4.3%) | 0 (0.0%) |
| 4 Vehicles | 194 (74.9%) | 94 (77.0%) |
| 5 or more Vehicles | 33 (12.7%) | 28 (23.0%) |
| Total | 259 (100.0%) | 122 (100.0%) |
Commute Time in Grimsley
The most frequently occuring commute durations in Grimsley are 30 to 34 minutes (89 commuters, 25.8%), 5 to 9 minutes (75 commuters, 21.7%), and 20 to 24 minutes (55 commuters, 15.9%).
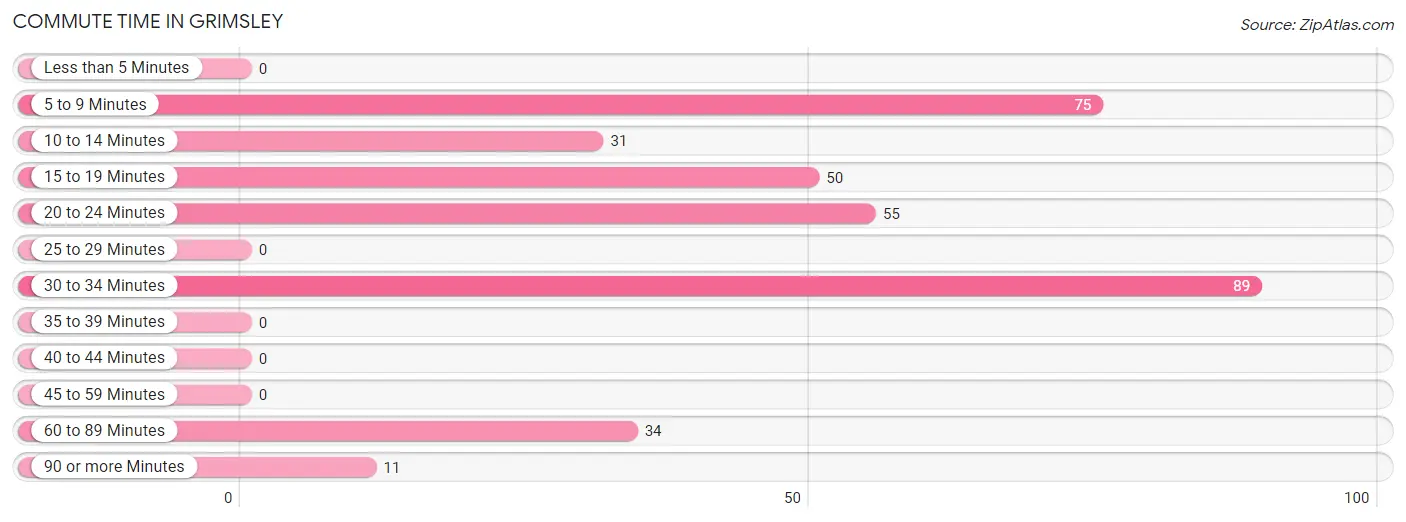
| Commute Time | # Commuters | % Commuters |
| Less than 5 Minutes | 0 | 0.0% |
| 5 to 9 Minutes | 75 | 21.7% |
| 10 to 14 Minutes | 31 | 9.0% |
| 15 to 19 Minutes | 50 | 14.5% |
| 20 to 24 Minutes | 55 | 15.9% |
| 25 to 29 Minutes | 0 | 0.0% |
| 30 to 34 Minutes | 89 | 25.8% |
| 35 to 39 Minutes | 0 | 0.0% |
| 40 to 44 Minutes | 0 | 0.0% |
| 45 to 59 Minutes | 0 | 0.0% |
| 60 to 89 Minutes | 34 | 9.9% |
| 90 or more Minutes | 11 | 3.2% |
Commute Time by Sex in Grimsley
The most common commute times in Grimsley are 15 to 19 minutes (50 commuters, 21.0%) for males and 30 to 34 minutes (46 commuters, 43.0%) for females.
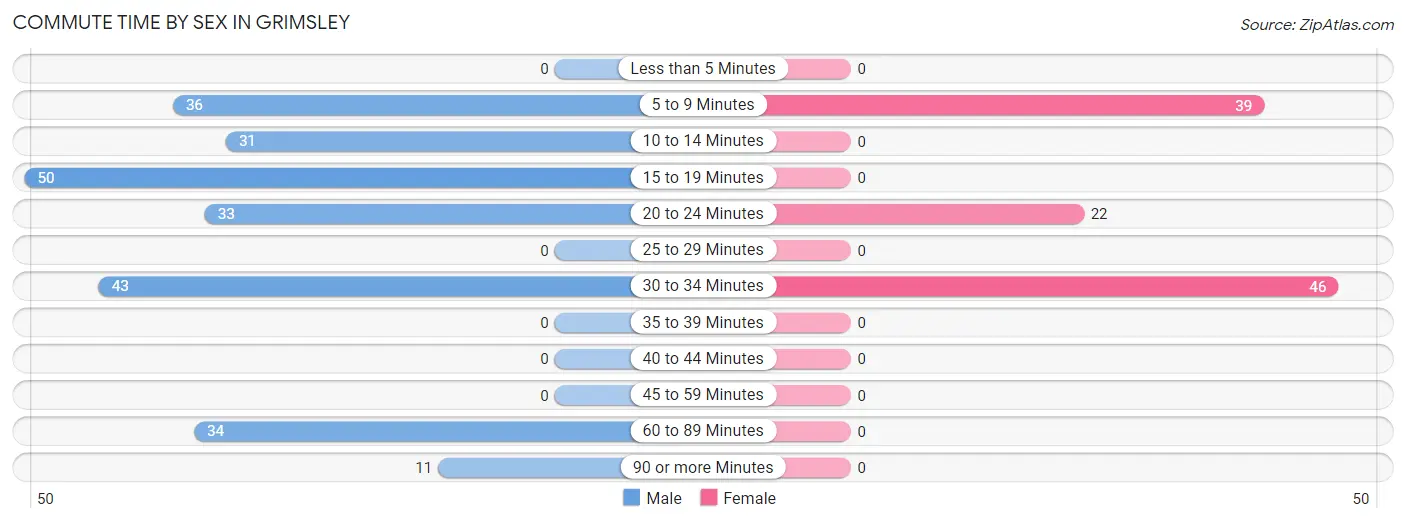
| Commute Time | Male | Female |
| Less than 5 Minutes | 0 (0.0%) | 0 (0.0%) |
| 5 to 9 Minutes | 36 (15.1%) | 39 (36.4%) |
| 10 to 14 Minutes | 31 (13.0%) | 0 (0.0%) |
| 15 to 19 Minutes | 50 (21.0%) | 0 (0.0%) |
| 20 to 24 Minutes | 33 (13.9%) | 22 (20.6%) |
| 25 to 29 Minutes | 0 (0.0%) | 0 (0.0%) |
| 30 to 34 Minutes | 43 (18.1%) | 46 (43.0%) |
| 35 to 39 Minutes | 0 (0.0%) | 0 (0.0%) |
| 40 to 44 Minutes | 0 (0.0%) | 0 (0.0%) |
| 45 to 59 Minutes | 0 (0.0%) | 0 (0.0%) |
| 60 to 89 Minutes | 34 (14.3%) | 0 (0.0%) |
| 90 or more Minutes | 11 (4.6%) | 0 (0.0%) |
Time of Departure to Work by Sex in Grimsley
The most frequent times of departure to work in Grimsley are 8:00 AM to 8:29 AM (70, 29.4%) for males and 7:00 AM to 7:29 AM (61, 57.0%) for females.
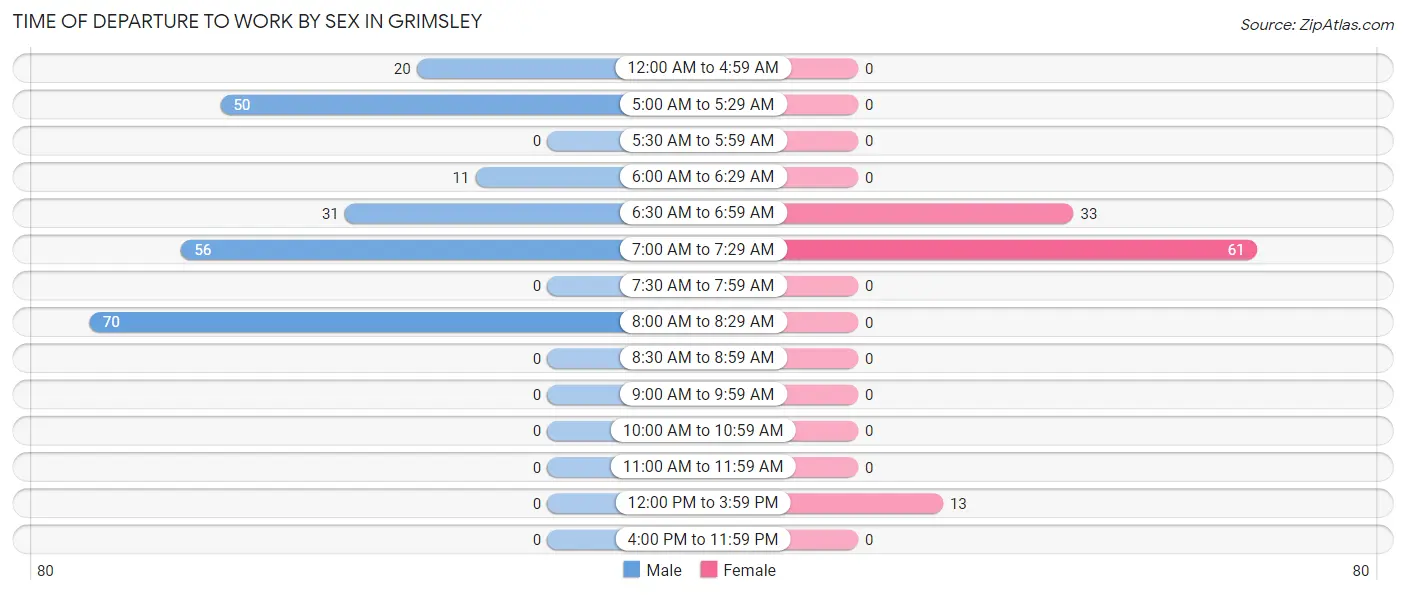
| Time of Departure | Male | Female |
| 12:00 AM to 4:59 AM | 20 (8.4%) | 0 (0.0%) |
| 5:00 AM to 5:29 AM | 50 (21.0%) | 0 (0.0%) |
| 5:30 AM to 5:59 AM | 0 (0.0%) | 0 (0.0%) |
| 6:00 AM to 6:29 AM | 11 (4.6%) | 0 (0.0%) |
| 6:30 AM to 6:59 AM | 31 (13.0%) | 33 (30.8%) |
| 7:00 AM to 7:29 AM | 56 (23.5%) | 61 (57.0%) |
| 7:30 AM to 7:59 AM | 0 (0.0%) | 0 (0.0%) |
| 8:00 AM to 8:29 AM | 70 (29.4%) | 0 (0.0%) |
| 8:30 AM to 8:59 AM | 0 (0.0%) | 0 (0.0%) |
| 9:00 AM to 9:59 AM | 0 (0.0%) | 0 (0.0%) |
| 10:00 AM to 10:59 AM | 0 (0.0%) | 0 (0.0%) |
| 11:00 AM to 11:59 AM | 0 (0.0%) | 0 (0.0%) |
| 12:00 PM to 3:59 PM | 0 (0.0%) | 13 (12.1%) |
| 4:00 PM to 11:59 PM | 0 (0.0%) | 0 (0.0%) |
| Total | 238 (100.0%) | 107 (100.0%) |
Housing Occupancy in Grimsley
Occupancy by Ownership in Grimsley
Of the total 305 dwellings in Grimsley, owner-occupied units account for 284 (93.1%), while renter-occupied units make up 21 (6.9%).
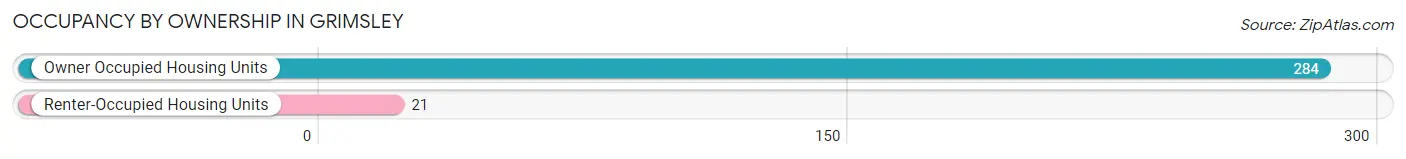
| Occupancy | # Housing Units | % Housing Units |
| Owner Occupied Housing Units | 284 | 93.1% |
| Renter-Occupied Housing Units | 21 | 6.9% |
| Total Occupied Housing Units | 305 | 100.0% |
Occupancy by Household Size in Grimsley
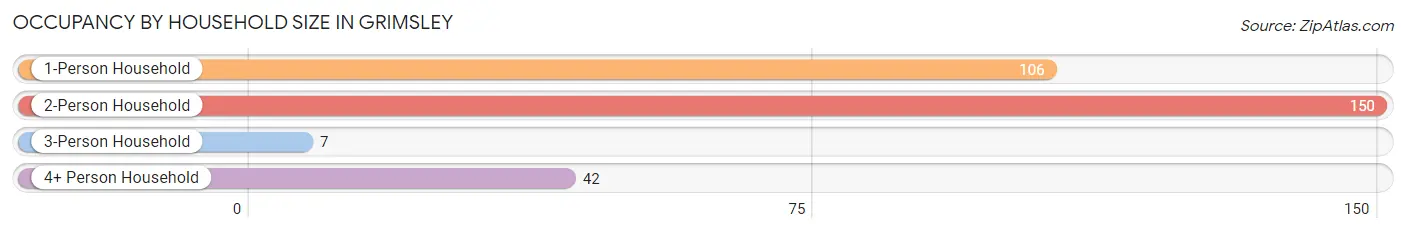
| Household Size | # Housing Units | % Housing Units |
| 1-Person Household | 106 | 34.7% |
| 2-Person Household | 150 | 49.2% |
| 3-Person Household | 7 | 2.3% |
| 4+ Person Household | 42 | 13.8% |
| Total Housing Units | 305 | 100.0% |
Occupancy by Ownership by Household Size in Grimsley
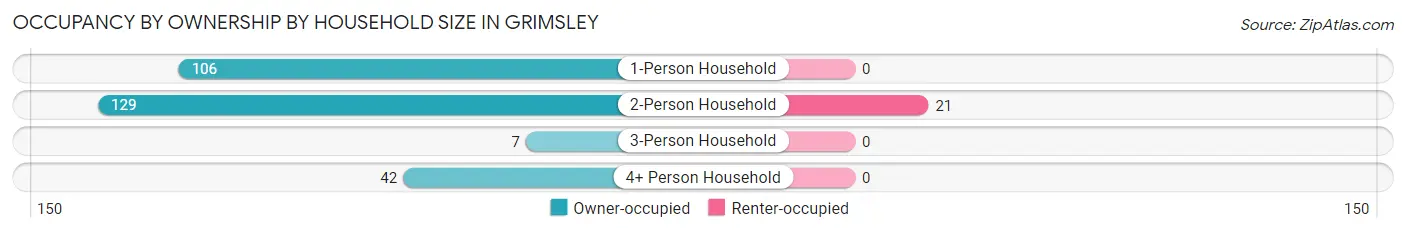
| Household Size | Owner-occupied | Renter-occupied |
| 1-Person Household | 106 (100.0%) | 0 (0.0%) |
| 2-Person Household | 129 (86.0%) | 21 (14.0%) |
| 3-Person Household | 7 (100.0%) | 0 (0.0%) |
| 4+ Person Household | 42 (100.0%) | 0 (0.0%) |
| Total Housing Units | 284 (93.1%) | 21 (6.9%) |
Occupancy by Educational Attainment in Grimsley
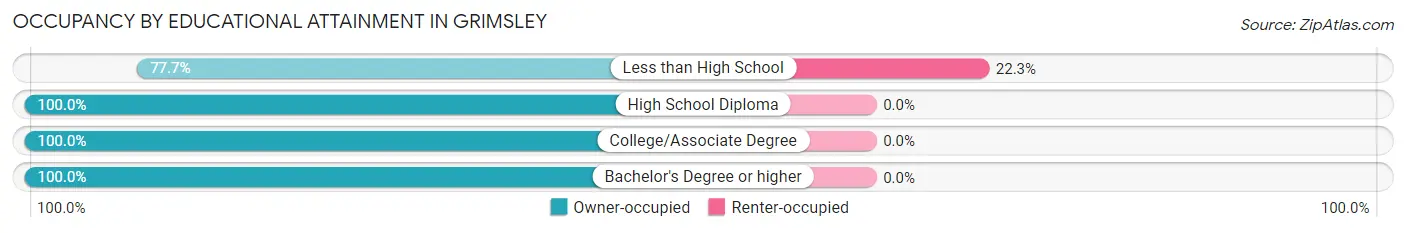
| Household Size | Owner-occupied | Renter-occupied |
| Less than High School | 73 (77.7%) | 21 (22.3%) |
| High School Diploma | 163 (100.0%) | 0 (0.0%) |
| College/Associate Degree | 26 (100.0%) | 0 (0.0%) |
| Bachelor's Degree or higher | 22 (100.0%) | 0 (0.0%) |
Occupancy by Age of Householder in Grimsley
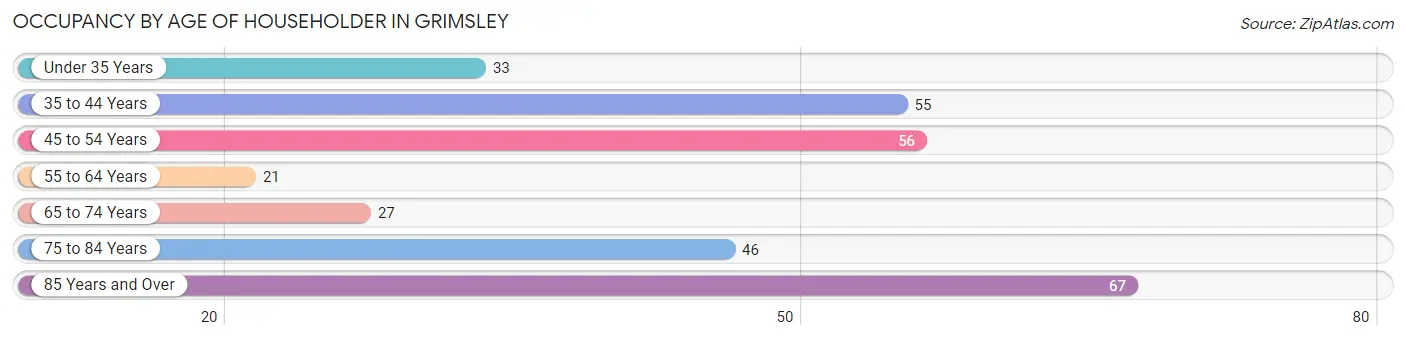
| Age Bracket | # Households | % Households |
| Under 35 Years | 33 | 10.8% |
| 35 to 44 Years | 55 | 18.0% |
| 45 to 54 Years | 56 | 18.4% |
| 55 to 64 Years | 21 | 6.9% |
| 65 to 74 Years | 27 | 8.8% |
| 75 to 84 Years | 46 | 15.1% |
| 85 Years and Over | 67 | 22.0% |
| Total | 305 | 100.0% |
Housing Finances in Grimsley
Median Income by Occupancy in Grimsley
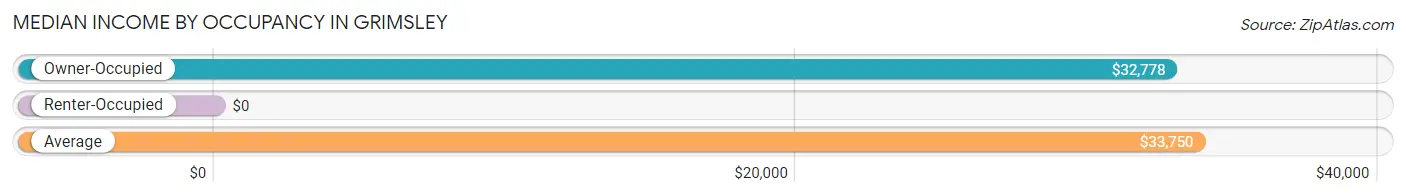
| Occupancy Type | # Households | Median Income |
| Owner-Occupied | 284 (93.1%) | $32,778 |
| Renter-Occupied | 21 (6.9%) | $0 |
| Average | 305 (100.0%) | $33,750 |
Occupancy by Householder Income Bracket in Grimsley
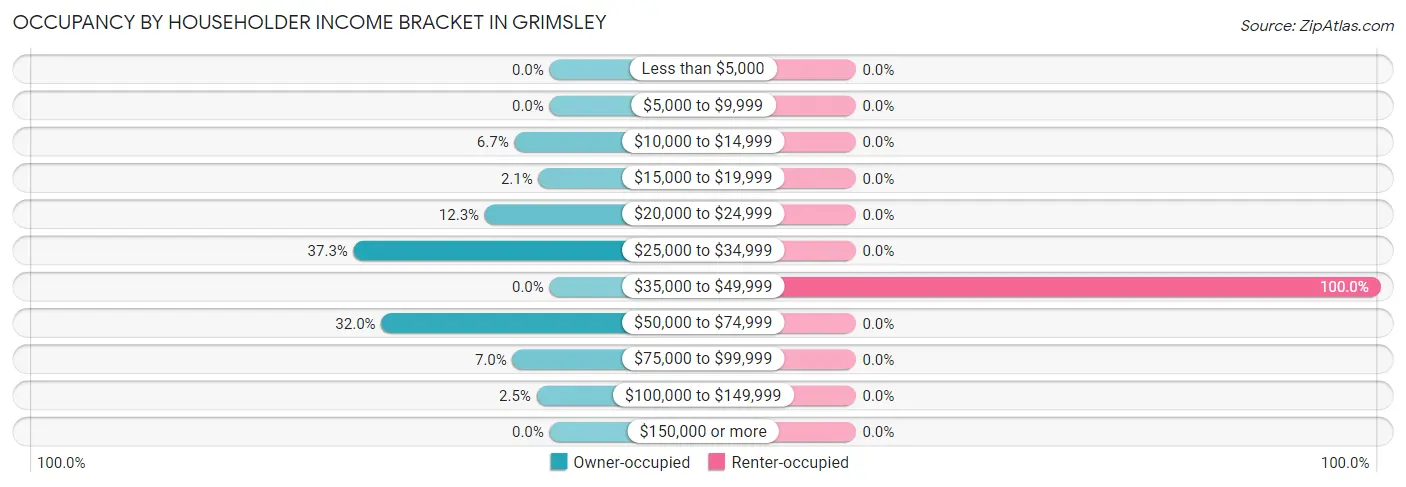
| Income Bracket | Owner-occupied | Renter-occupied |
| Less than $5,000 | 0 (0.0%) | 0 (0.0%) |
| $5,000 to $9,999 | 0 (0.0%) | 0 (0.0%) |
| $10,000 to $14,999 | 19 (6.7%) | 0 (0.0%) |
| $15,000 to $19,999 | 6 (2.1%) | 0 (0.0%) |
| $20,000 to $24,999 | 35 (12.3%) | 0 (0.0%) |
| $25,000 to $34,999 | 106 (37.3%) | 0 (0.0%) |
| $35,000 to $49,999 | 0 (0.0%) | 21 (100.0%) |
| $50,000 to $74,999 | 91 (32.0%) | 0 (0.0%) |
| $75,000 to $99,999 | 20 (7.0%) | 0 (0.0%) |
| $100,000 to $149,999 | 7 (2.5%) | 0 (0.0%) |
| $150,000 or more | 0 (0.0%) | 0 (0.0%) |
| Total | 284 (100.0%) | 21 (100.0%) |
Monthly Housing Cost Tiers in Grimsley
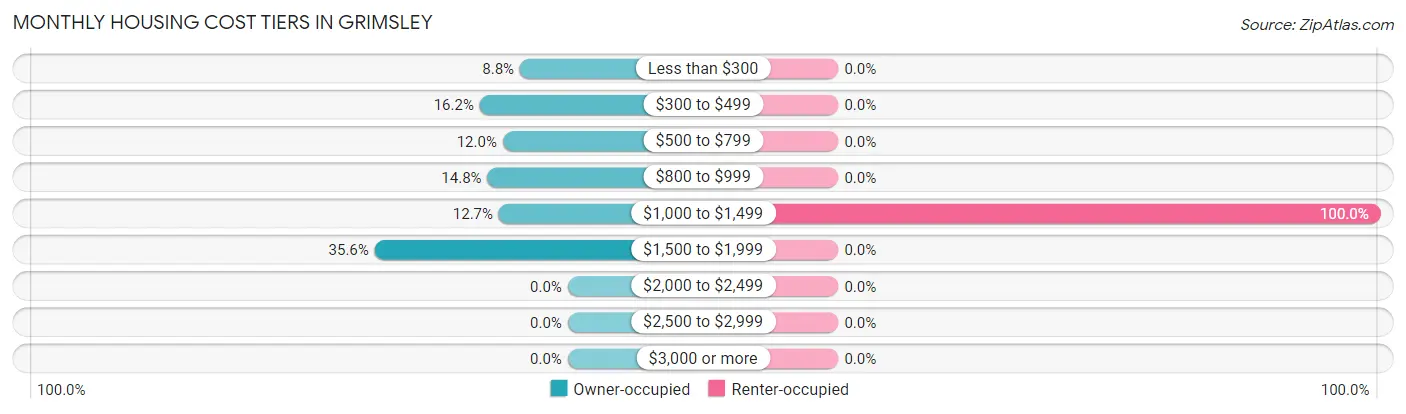
| Monthly Cost | Owner-occupied | Renter-occupied |
| Less than $300 | 25 (8.8%) | 0 (0.0%) |
| $300 to $499 | 46 (16.2%) | 0 (0.0%) |
| $500 to $799 | 34 (12.0%) | 0 (0.0%) |
| $800 to $999 | 42 (14.8%) | 0 (0.0%) |
| $1,000 to $1,499 | 36 (12.7%) | 21 (100.0%) |
| $1,500 to $1,999 | 101 (35.6%) | 0 (0.0%) |
| $2,000 to $2,499 | 0 (0.0%) | 0 (0.0%) |
| $2,500 to $2,999 | 0 (0.0%) | 0 (0.0%) |
| $3,000 or more | 0 (0.0%) | 0 (0.0%) |
| Total | 284 (100.0%) | 21 (100.0%) |
Physical Housing Characteristics in Grimsley
Housing Structures in Grimsley
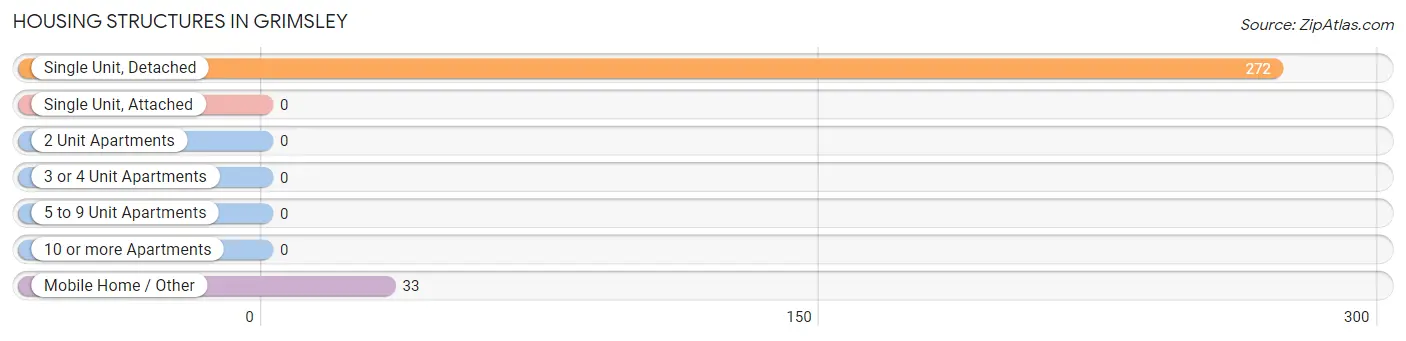
| Structure Type | # Housing Units | % Housing Units |
| Single Unit, Detached | 272 | 89.2% |
| Single Unit, Attached | 0 | 0.0% |
| 2 Unit Apartments | 0 | 0.0% |
| 3 or 4 Unit Apartments | 0 | 0.0% |
| 5 to 9 Unit Apartments | 0 | 0.0% |
| 10 or more Apartments | 0 | 0.0% |
| Mobile Home / Other | 33 | 10.8% |
| Total | 305 | 100.0% |
Housing Structures by Occupancy in Grimsley
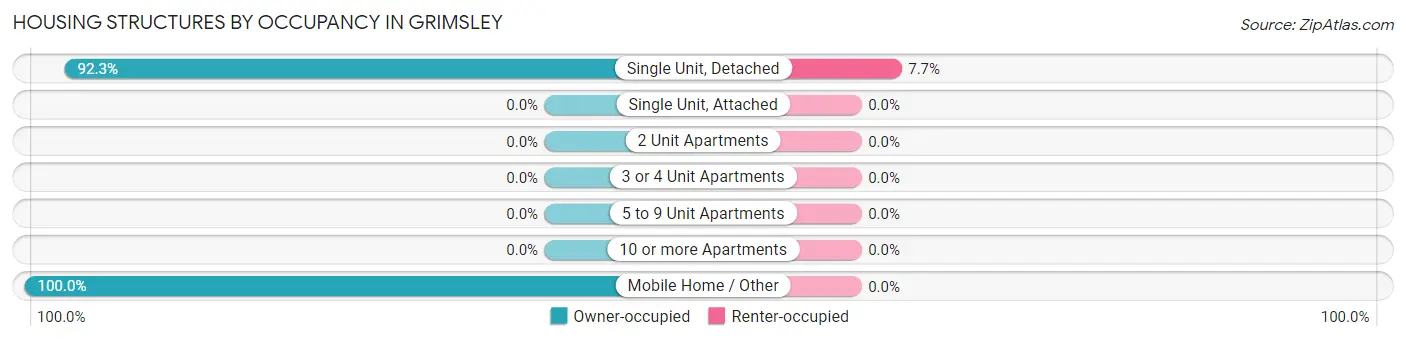
| Structure Type | Owner-occupied | Renter-occupied |
| Single Unit, Detached | 251 (92.3%) | 21 (7.7%) |
| Single Unit, Attached | 0 (0.0%) | 0 (0.0%) |
| 2 Unit Apartments | 0 (0.0%) | 0 (0.0%) |
| 3 or 4 Unit Apartments | 0 (0.0%) | 0 (0.0%) |
| 5 to 9 Unit Apartments | 0 (0.0%) | 0 (0.0%) |
| 10 or more Apartments | 0 (0.0%) | 0 (0.0%) |
| Mobile Home / Other | 33 (100.0%) | 0 (0.0%) |
| Total | 284 (93.1%) | 21 (6.9%) |
Housing Structures by Number of Rooms in Grimsley
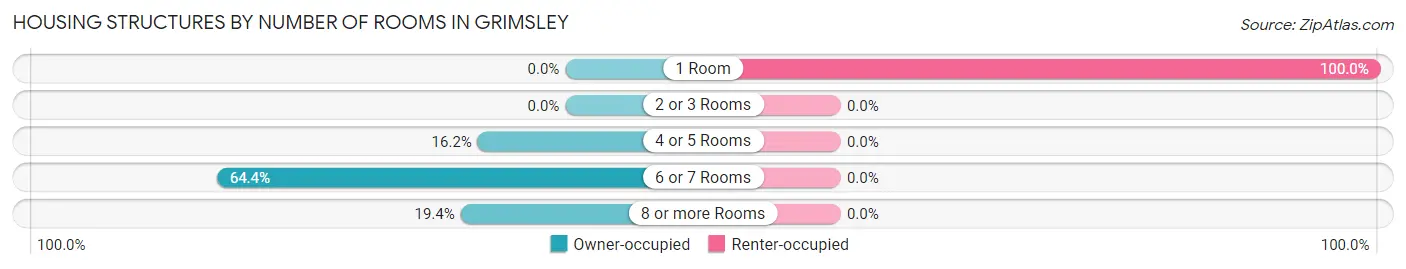
| Number of Rooms | Owner-occupied | Renter-occupied |
| 1 Room | 0 (0.0%) | 21 (100.0%) |
| 2 or 3 Rooms | 0 (0.0%) | 0 (0.0%) |
| 4 or 5 Rooms | 46 (16.2%) | 0 (0.0%) |
| 6 or 7 Rooms | 183 (64.4%) | 0 (0.0%) |
| 8 or more Rooms | 55 (19.4%) | 0 (0.0%) |
| Total | 284 (100.0%) | 21 (100.0%) |
Housing Structure by Heating Type in Grimsley
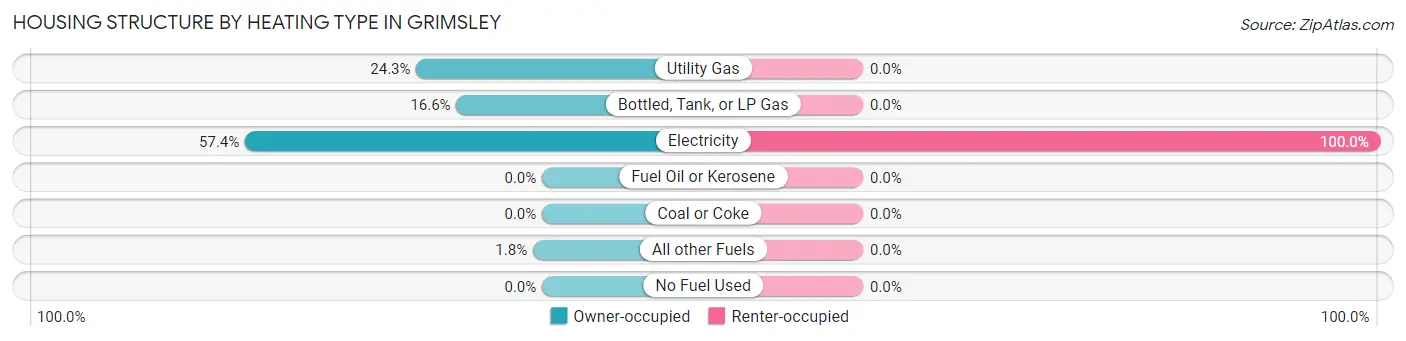
| Heating Type | Owner-occupied | Renter-occupied |
| Utility Gas | 69 (24.3%) | 0 (0.0%) |
| Bottled, Tank, or LP Gas | 47 (16.6%) | 0 (0.0%) |
| Electricity | 163 (57.4%) | 21 (100.0%) |
| Fuel Oil or Kerosene | 0 (0.0%) | 0 (0.0%) |
| Coal or Coke | 0 (0.0%) | 0 (0.0%) |
| All other Fuels | 5 (1.8%) | 0 (0.0%) |
| No Fuel Used | 0 (0.0%) | 0 (0.0%) |
| Total | 284 (100.0%) | 21 (100.0%) |
Household Vehicle Usage in Grimsley
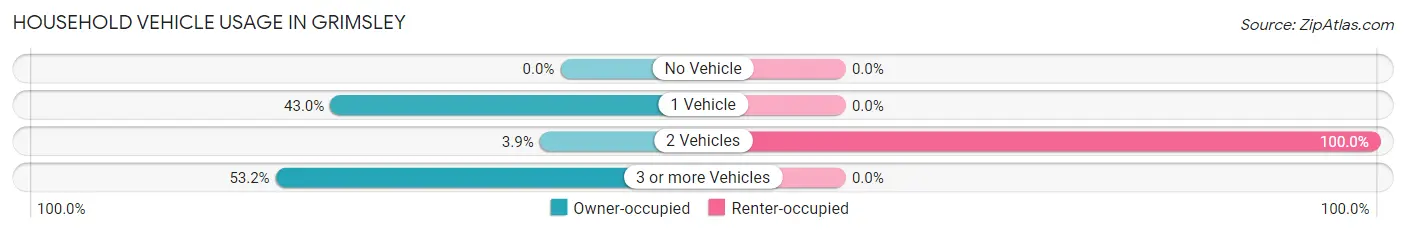
| Vehicles per Household | Owner-occupied | Renter-occupied |
| No Vehicle | 0 (0.0%) | 0 (0.0%) |
| 1 Vehicle | 122 (43.0%) | 0 (0.0%) |
| 2 Vehicles | 11 (3.9%) | 21 (100.0%) |
| 3 or more Vehicles | 151 (53.2%) | 0 (0.0%) |
| Total | 284 (100.0%) | 21 (100.0%) |
Real Estate & Mortgages in Grimsley
Real Estate and Mortgage Overview in Grimsley
| Characteristic | Without Mortgage | With Mortgage |
| Housing Units | 98 | 186 |
| Median Property Value | - | - |
| Median Household Income | - | - |
| Monthly Housing Costs | $334 | $0 |
| Real Estate Taxes | $474 | $0 |
Property Value by Mortgage Status in Grimsley
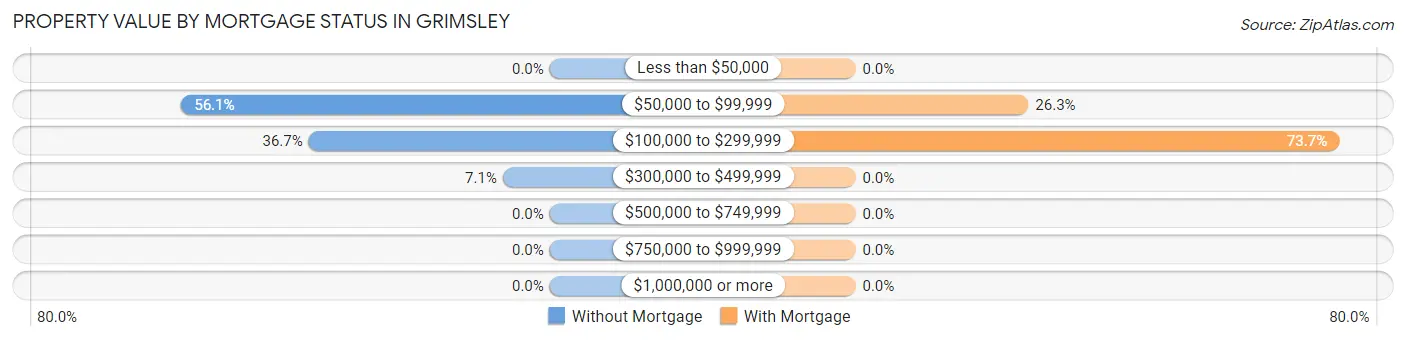
| Property Value | Without Mortgage | With Mortgage |
| Less than $50,000 | 0 (0.0%) | 0 (0.0%) |
| $50,000 to $99,999 | 55 (56.1%) | 49 (26.3%) |
| $100,000 to $299,999 | 36 (36.7%) | 137 (73.7%) |
| $300,000 to $499,999 | 7 (7.1%) | 0 (0.0%) |
| $500,000 to $749,999 | 0 (0.0%) | 0 (0.0%) |
| $750,000 to $999,999 | 0 (0.0%) | 0 (0.0%) |
| $1,000,000 or more | 0 (0.0%) | 0 (0.0%) |
| Total | 98 (100.0%) | 186 (100.0%) |
Household Income by Mortgage Status in Grimsley
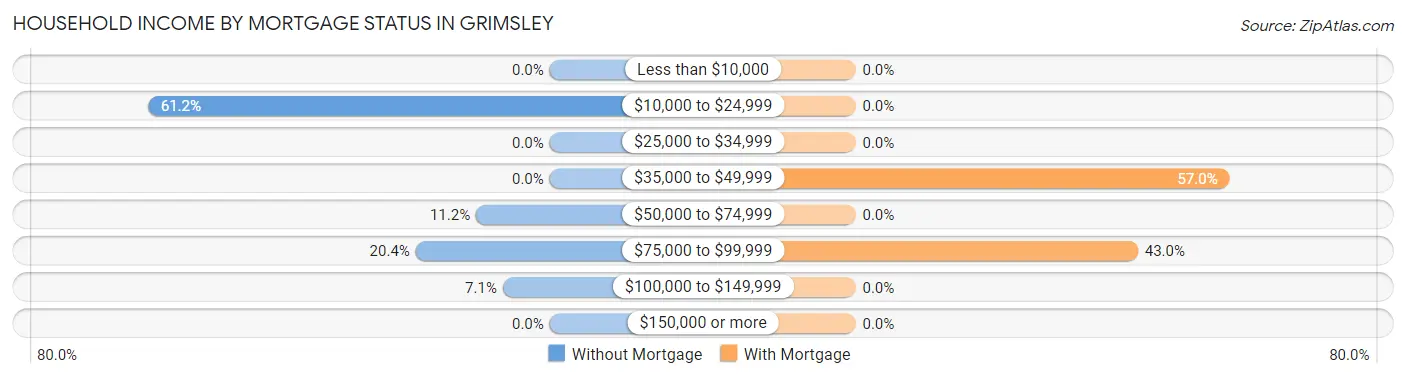
| Household Income | Without Mortgage | With Mortgage |
| Less than $10,000 | 0 (0.0%) | 0 (0.0%) |
| $10,000 to $24,999 | 60 (61.2%) | 0 (0.0%) |
| $25,000 to $34,999 | 0 (0.0%) | 0 (0.0%) |
| $35,000 to $49,999 | 0 (0.0%) | 106 (57.0%) |
| $50,000 to $74,999 | 11 (11.2%) | 0 (0.0%) |
| $75,000 to $99,999 | 20 (20.4%) | 80 (43.0%) |
| $100,000 to $149,999 | 7 (7.1%) | 0 (0.0%) |
| $150,000 or more | 0 (0.0%) | 0 (0.0%) |
| Total | 98 (100.0%) | 186 (100.0%) |
Property Value to Household Income Ratio in Grimsley
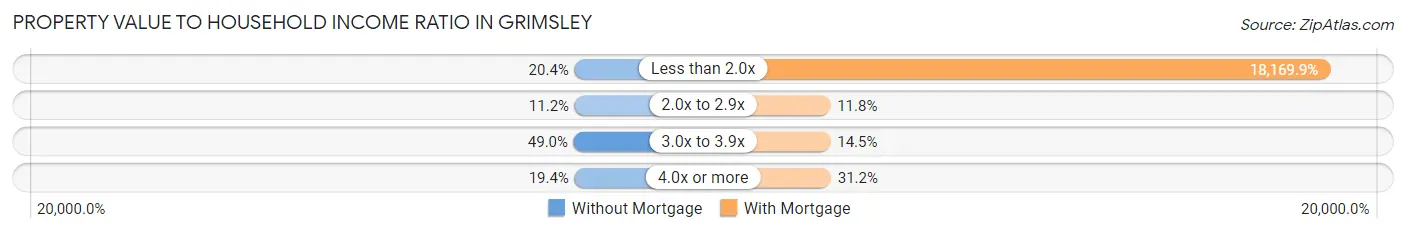
| Value-to-Income Ratio | Without Mortgage | With Mortgage |
| Less than 2.0x | 20 (20.4%) | 33,796 (18,169.9%) |
| 2.0x to 2.9x | 11 (11.2%) | 22 (11.8%) |
| 3.0x to 3.9x | 48 (49.0%) | 27 (14.5%) |
| 4.0x or more | 19 (19.4%) | 58 (31.2%) |
| Total | 98 (100.0%) | 186 (100.0%) |
Real Estate Taxes by Mortgage Status in Grimsley
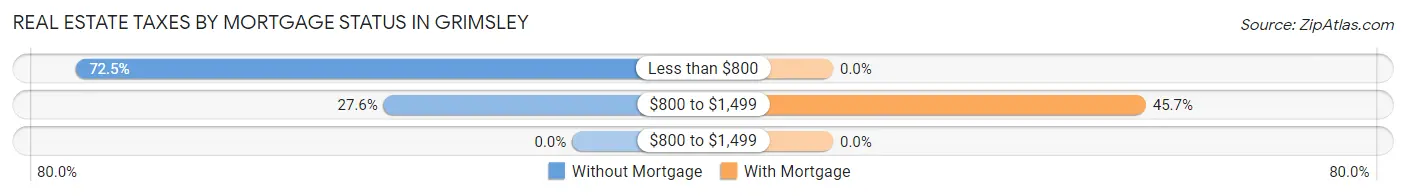
| Property Taxes | Without Mortgage | With Mortgage |
| Less than $800 | 71 (72.5%) | 0 (0.0%) |
| $800 to $1,499 | 27 (27.6%) | 85 (45.7%) |
| $800 to $1,499 | 0 (0.0%) | 0 (0.0%) |
| Total | 98 (100.0%) | 186 (100.0%) |
Health & Disability in Grimsley
Health Insurance Coverage by Age in Grimsley
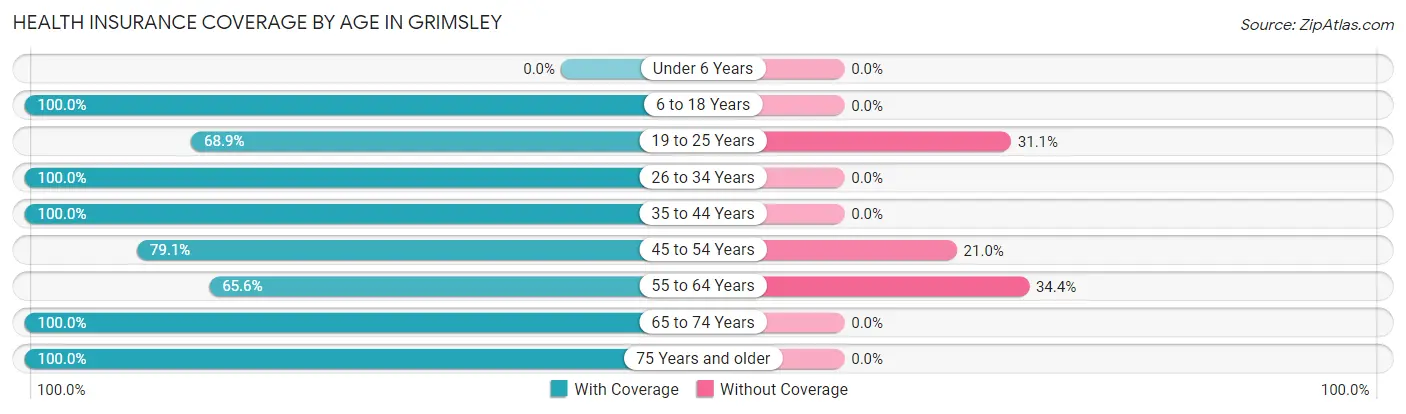
| Age Bracket | With Coverage | Without Coverage |
| Under 6 Years | 0 (0.0%) | 0 (0.0%) |
| 6 to 18 Years | 147 (100.0%) | 0 (0.0%) |
| 19 to 25 Years | 111 (68.9%) | 50 (31.1%) |
| 26 to 34 Years | 33 (100.0%) | 0 (0.0%) |
| 35 to 44 Years | 55 (100.0%) | 0 (0.0%) |
| 45 to 54 Years | 117 (79.0%) | 31 (20.9%) |
| 55 to 64 Years | 59 (65.6%) | 31 (34.4%) |
| 65 to 74 Years | 27 (100.0%) | 0 (0.0%) |
| 75 Years and older | 134 (100.0%) | 0 (0.0%) |
| Total | 683 (85.9%) | 112 (14.1%) |
Health Insurance Coverage by Citizenship Status in Grimsley
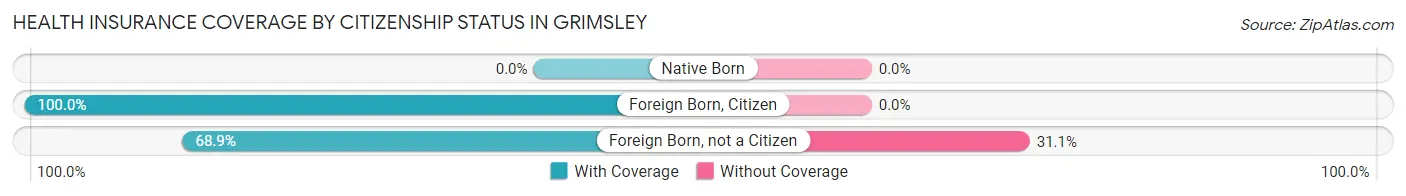
| Citizenship Status | With Coverage | Without Coverage |
| Native Born | 0 (0.0%) | 0 (0.0%) |
| Foreign Born, Citizen | 147 (100.0%) | 0 (0.0%) |
| Foreign Born, not a Citizen | 111 (68.9%) | 50 (31.1%) |
Health Insurance Coverage by Household Income in Grimsley
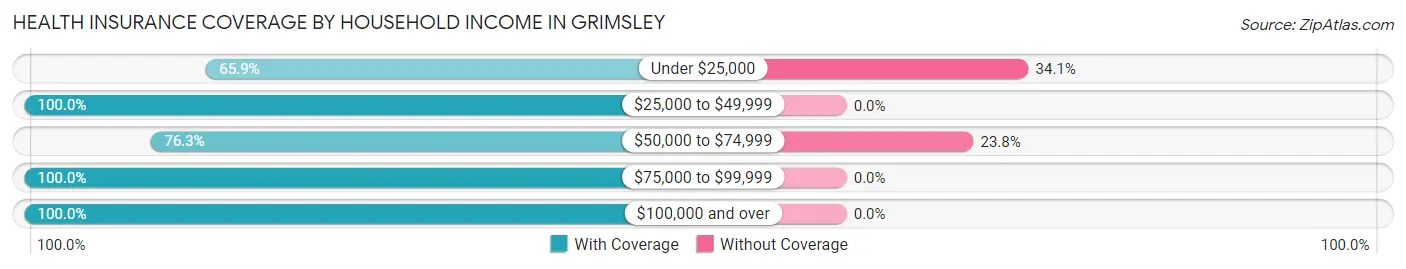
| Household Income | With Coverage | Without Coverage |
| Under $25,000 | 60 (65.9%) | 31 (34.1%) |
| $25,000 to $49,999 | 171 (100.0%) | 0 (0.0%) |
| $50,000 to $74,999 | 260 (76.2%) | 81 (23.7%) |
| $75,000 to $99,999 | 157 (100.0%) | 0 (0.0%) |
| $100,000 and over | 35 (100.0%) | 0 (0.0%) |
Public vs Private Health Insurance Coverage by Age in Grimsley
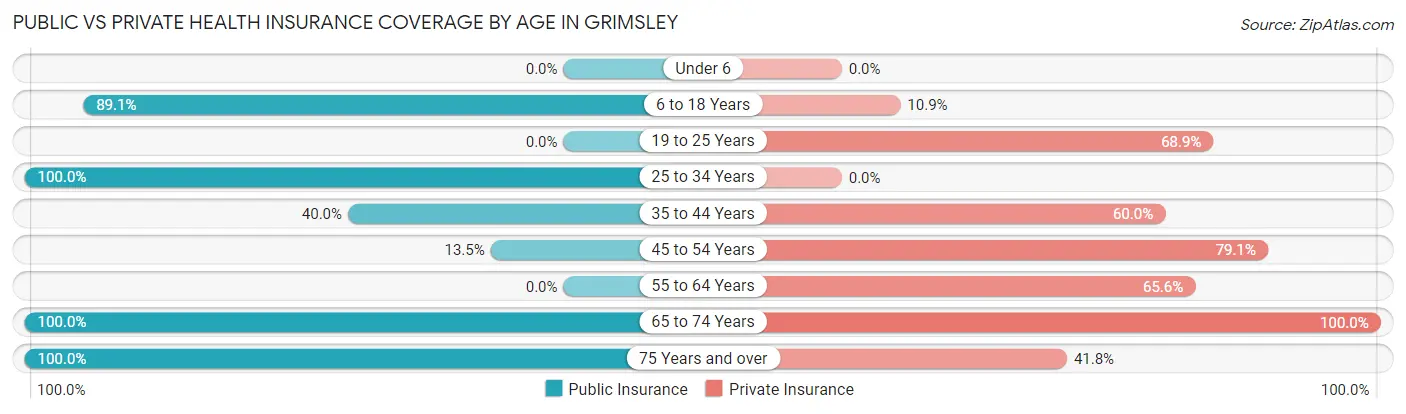
| Age Bracket | Public Insurance | Private Insurance |
| Under 6 | 0 (0.0%) | 0 (0.0%) |
| 6 to 18 Years | 131 (89.1%) | 16 (10.9%) |
| 19 to 25 Years | 0 (0.0%) | 111 (68.9%) |
| 25 to 34 Years | 33 (100.0%) | 0 (0.0%) |
| 35 to 44 Years | 22 (40.0%) | 33 (60.0%) |
| 45 to 54 Years | 20 (13.5%) | 117 (79.0%) |
| 55 to 64 Years | 0 (0.0%) | 59 (65.6%) |
| 65 to 74 Years | 27 (100.0%) | 27 (100.0%) |
| 75 Years and over | 134 (100.0%) | 56 (41.8%) |
| Total | 367 (46.2%) | 419 (52.7%) |
Disability Status by Sex by Age in Grimsley
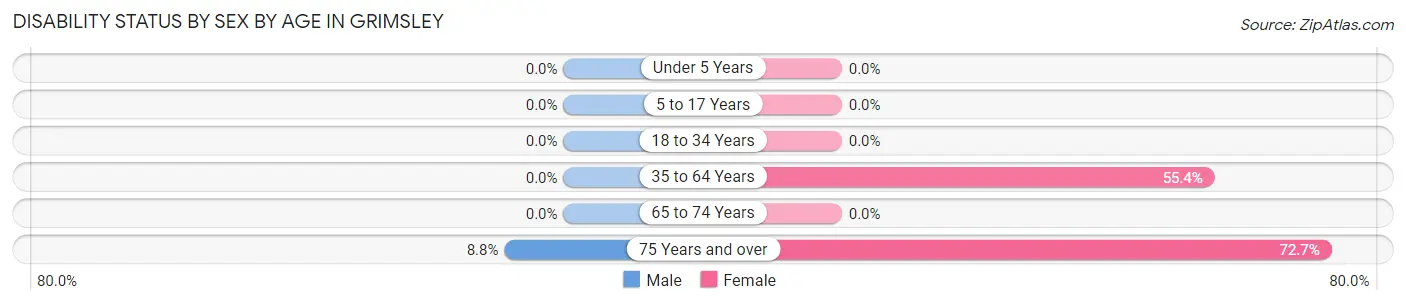
| Age Bracket | Male | Female |
| Under 5 Years | 0 (0.0%) | 0 (0.0%) |
| 5 to 17 Years | 0 (0.0%) | 0 (0.0%) |
| 18 to 34 Years | 0 (0.0%) | 0 (0.0%) |
| 35 to 64 Years | 0 (0.0%) | 67 (55.4%) |
| 65 to 74 Years | 0 (0.0%) | 0 (0.0%) |
| 75 Years and over | 5 (8.8%) | 56 (72.7%) |
Disability Class by Sex by Age in Grimsley
Disability Class: Hearing Difficulty
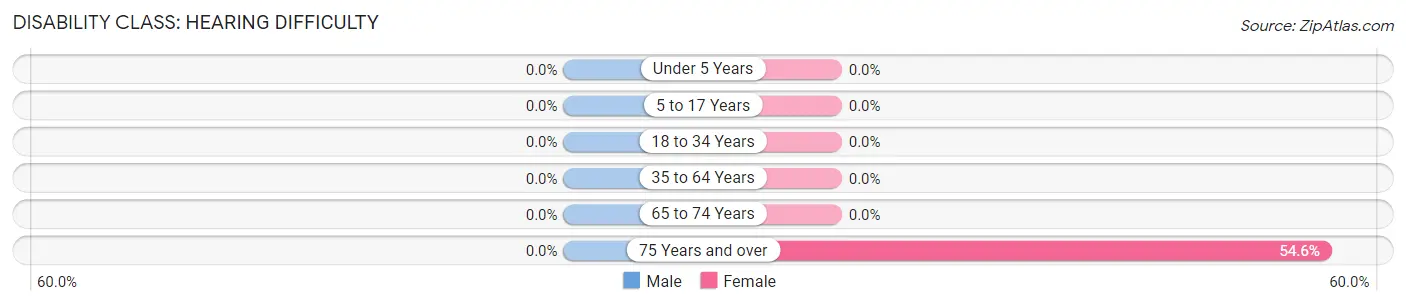
| Age Bracket | Male | Female |
| Under 5 Years | 0 (0.0%) | 0 (0.0%) |
| 5 to 17 Years | 0 (0.0%) | 0 (0.0%) |
| 18 to 34 Years | 0 (0.0%) | 0 (0.0%) |
| 35 to 64 Years | 0 (0.0%) | 0 (0.0%) |
| 65 to 74 Years | 0 (0.0%) | 0 (0.0%) |
| 75 Years and over | 0 (0.0%) | 42 (54.5%) |
Disability Class: Vision Difficulty
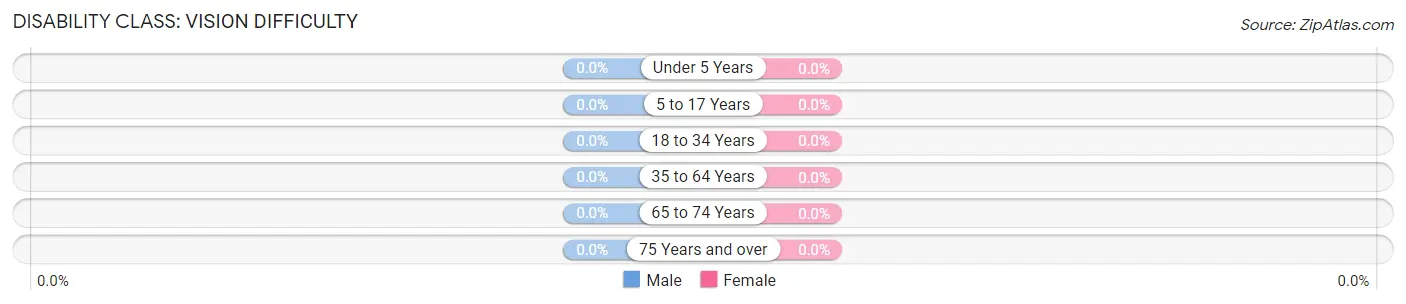
| Age Bracket | Male | Female |
| Under 5 Years | 0 (0.0%) | 0 (0.0%) |
| 5 to 17 Years | 0 (0.0%) | 0 (0.0%) |
| 18 to 34 Years | 0 (0.0%) | 0 (0.0%) |
| 35 to 64 Years | 0 (0.0%) | 0 (0.0%) |
| 65 to 74 Years | 0 (0.0%) | 0 (0.0%) |
| 75 Years and over | 0 (0.0%) | 0 (0.0%) |
Disability Class: Cognitive Difficulty
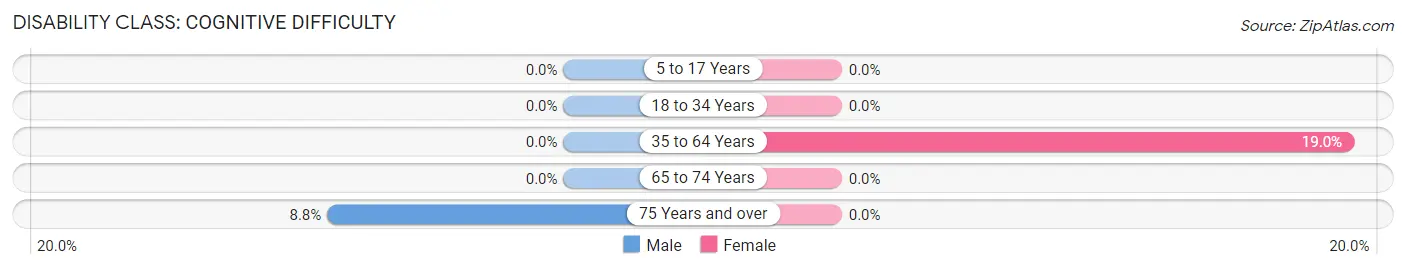
| Age Bracket | Male | Female |
| 5 to 17 Years | 0 (0.0%) | 0 (0.0%) |
| 18 to 34 Years | 0 (0.0%) | 0 (0.0%) |
| 35 to 64 Years | 0 (0.0%) | 23 (19.0%) |
| 65 to 74 Years | 0 (0.0%) | 0 (0.0%) |
| 75 Years and over | 5 (8.8%) | 0 (0.0%) |
Disability Class: Ambulatory Difficulty
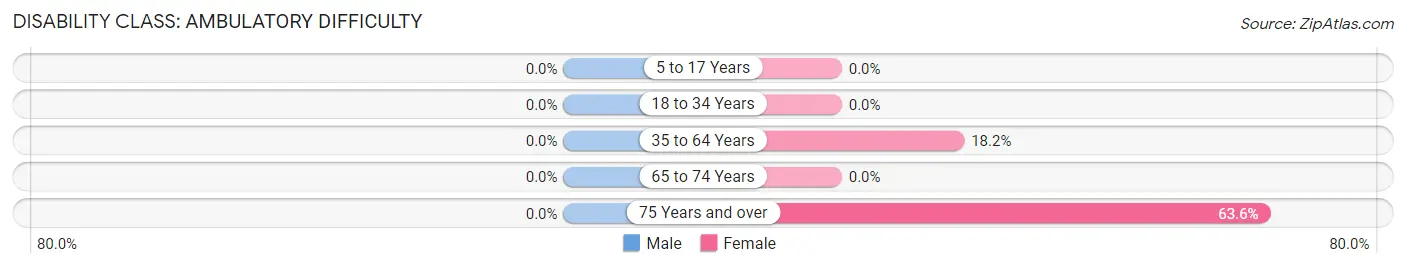
| Age Bracket | Male | Female |
| 5 to 17 Years | 0 (0.0%) | 0 (0.0%) |
| 18 to 34 Years | 0 (0.0%) | 0 (0.0%) |
| 35 to 64 Years | 0 (0.0%) | 22 (18.2%) |
| 65 to 74 Years | 0 (0.0%) | 0 (0.0%) |
| 75 Years and over | 0 (0.0%) | 49 (63.6%) |
Disability Class: Self-Care Difficulty
| Age Bracket | Male | Female |
| 5 to 17 Years | 0 (0.0%) | 0 (0.0%) |
| 18 to 34 Years | 0 (0.0%) | 0 (0.0%) |
| 35 to 64 Years | 0 (0.0%) | 0 (0.0%) |
| 65 to 74 Years | 0 (0.0%) | 0 (0.0%) |
| 75 Years and over | 0 (0.0%) | 0 (0.0%) |
Technology Access in Grimsley
Computing Device Access in Grimsley
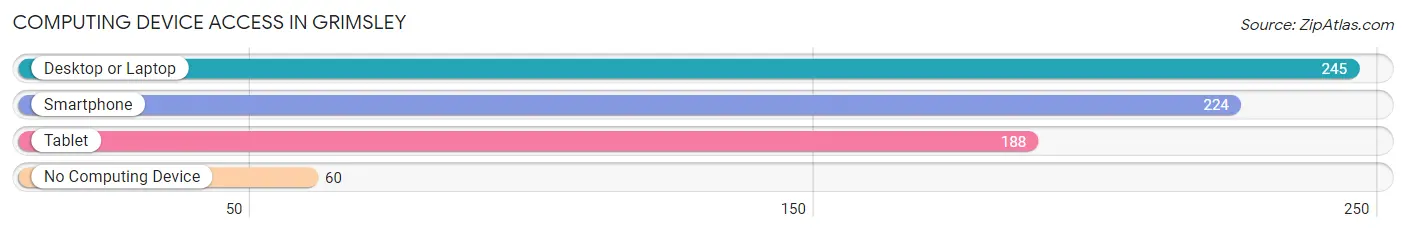
| Device Type | # Households | % Households |
| Desktop or Laptop | 245 | 80.3% |
| Smartphone | 224 | 73.4% |
| Tablet | 188 | 61.6% |
| No Computing Device | 60 | 19.7% |
| Total | 305 | 100.0% |
Internet Access in Grimsley
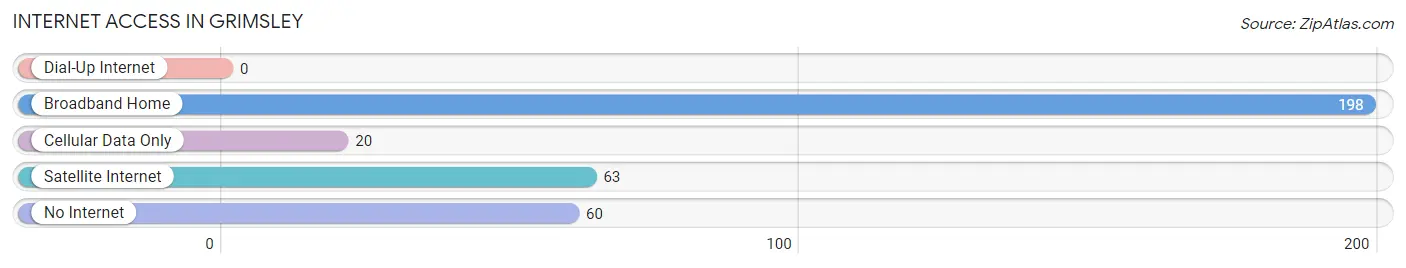
| Internet Type | # Households | % Households |
| Dial-Up Internet | 0 | 0.0% |
| Broadband Home | 198 | 64.9% |
| Cellular Data Only | 20 | 6.6% |
| Satellite Internet | 63 | 20.7% |
| No Internet | 60 | 19.7% |
| Total | 305 | 100.0% |
Grimsley Summary
Grimsley, Tennessee is a small town located in the northwest corner of the state, in the foothills of the Appalachian Mountains. It is situated in the Cumberland Plateau region, and is part of the Cumberland Gap National Historical Park. The town has a population of just over 1,000 people, and is the county seat of Fentress County.
History
Grimsley was founded in 1820 by a group of settlers from North Carolina. The town was named after the Grimsley family, who were among the first settlers. The town was originally known as Grimsleyville, but the name was changed to Grimsley in 1845.
The town was an important stop on the stagecoach route between Knoxville and Nashville, and was also a stop on the railroad line that ran through the area. The railroad line was eventually abandoned, but the town remained an important stop on the stagecoach route until the early 1900s.
The town was also an important stop on the Underground Railroad, and was a safe haven for escaped slaves. The town was also home to a number of prominent abolitionists, including the Reverend John Rankin, who was a leader in the Underground Railroad movement.
Geography
Grimsley is located in the northwest corner of Tennessee, in the foothills of the Appalachian Mountains. The town is situated in the Cumberland Plateau region, and is part of the Cumberland Gap National Historical Park. The town is located at the intersection of US Highway 127 and State Route 154.
The town is surrounded by rolling hills and forests, and is located near the Big South Fork National River and Recreation Area. The town is also located near the Big South Fork of the Cumberland River, which is a popular destination for fishing, canoeing, and kayaking.
Economy
Grimsley’s economy is largely based on agriculture and tourism. The town is home to a number of small farms, and the surrounding area is known for its production of tobacco, corn, and hay. The town is also home to a number of small businesses, including restaurants, shops, and a few small manufacturing plants.
The town is also a popular tourist destination, and is home to a number of attractions, including the Cumberland Gap National Historical Park, the Big South Fork National River and Recreation Area, and the Grimsley Historic District. The town is also home to a number of festivals and events throughout the year, including the Grimsley County Fair and the Grimsley Music Festival.
Demographics
As of the 2010 census, Grimsley had a population of 1,072 people. The racial makeup of the town was 95.3% White, 0.9% African American, 0.3% Native American, 0.2% Asian, 0.1% Pacific Islander, and 2.2% from other races. The median household income was $30,938, and the median family income was $37,500. The per capita income was $17,845.
Grimsley is a small, rural town with a rich history and a strong sense of community. The town is home to a number of small businesses, farms, and attractions, and is a popular destination for tourists and outdoor enthusiasts. The town is also home to a number of festivals and events throughout the year, making it a great place to visit and explore.
Common Questions
What is Per Capita Income in Grimsley?
Per Capita income in Grimsley is $20,154.
What is the Median Family Income in Grimsley?
Median Family Income in Grimsley is $54,271.
What is the Median Household income in Grimsley?
Median Household Income in Grimsley is $33,750.
What is Income or Wage Gap in Grimsley?
Income or Wage Gap in Grimsley is 10.7%.
Women in Grimsley earn 89.3 cents for every dollar earned by a man.
What is Inequality or Gini Index in Grimsley?
Inequality or Gini Index in Grimsley is 0.30.
What is the Total Population of Grimsley?
Total Population of Grimsley is 795.
What is the Total Male Population of Grimsley?
Total Male Population of Grimsley is 347.
What is the Total Female Population of Grimsley?
Total Female Population of Grimsley is 448.
What is the Ratio of Males per 100 Females in Grimsley?
There are 77.46 Males per 100 Females in Grimsley.
What is the Ratio of Females per 100 Males in Grimsley?
There are 129.11 Females per 100 Males in Grimsley.
What is the Median Population Age in Grimsley?
Median Population Age in Grimsley is 47.0 Years.
What is the Average Family Size in Grimsley
Average Family Size in Grimsley is 3.5 People.
What is the Average Household Size in Grimsley
Average Household Size in Grimsley is 2.6 People.
How Large is the Labor Force in Grimsley?
There are 480 People in the Labor Forcein in Grimsley.
What is the Percentage of People in the Labor Force in Grimsley?
66.3% of People are in the Labor Force in Grimsley.
What is the Unemployment Rate in Grimsley?
Unemployment Rate in Grimsley is 20.6%.