Livingston, TN Map & Demographics
Livingston Map
Livingston Overview
$30,298
PER CAPITA INCOME
$56,696
AVG FAMILY INCOME
$37,346
AVG HOUSEHOLD INCOME
31.5%
WAGE / INCOME GAP [ % ]
68.5¢/ $1
WAGE / INCOME GAP [ $ ]
$6,815
FAMILY INCOME DEFICIT
0.58
INEQUALITY / GINI INDEX
3,921
TOTAL POPULATION
1,992
MALE POPULATION
1,929
FEMALE POPULATION
103.27
MALES / 100 FEMALES
96.84
FEMALES / 100 MALES
40.6
MEDIAN AGE
3.2
AVG FAMILY SIZE
2.4
AVG HOUSEHOLD SIZE
1,853
LABOR FORCE [ PEOPLE ]
57.2%
PERCENT IN LABOR FORCE
1.8%
UNEMPLOYMENT RATE
Livingston Zip Codes
Livingston Area Codes
Income in Livingston
Income Overview in Livingston
Per Capita Income in Livingston is $30,298, while median incomes of families and households are $56,696 and $37,346 respectively.
| Characteristic | Number | Measure |
| Per Capita Income | 3,921 | $30,298 |
| Median Family Income | 879 | $56,696 |
| Mean Family Income | 879 | $88,887 |
| Median Household Income | 1,534 | $37,346 |
| Mean Household Income | 1,534 | $71,411 |
| Income Deficit | 879 | $6,815 |
| Wage / Income Gap (%) | 3,921 | 31.50% |
| Wage / Income Gap ($) | 3,921 | 68.50¢ per $1 |
| Gini / Inequality Index | 3,921 | 0.58 |
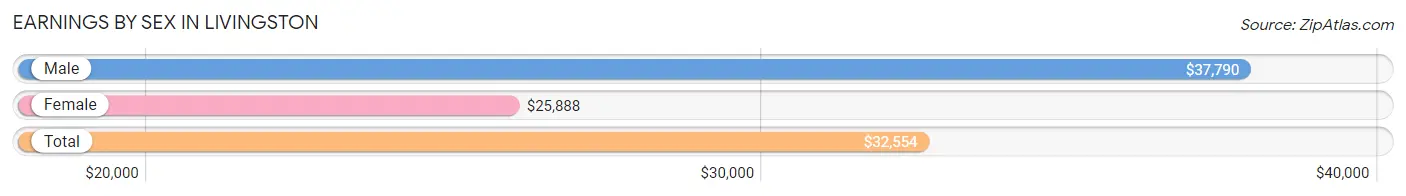
Earnings by Sex in Livingston
Average Earnings in Livingston are $32,554, $37,790 for men and $25,888 for women, a difference of 31.5%.
| Sex | Number | Average Earnings |
| Male | 1,036 (51.4%) | $37,790 |
| Female | 978 (48.6%) | $25,888 |
| Total | 2,014 (100.0%) | $32,554 |
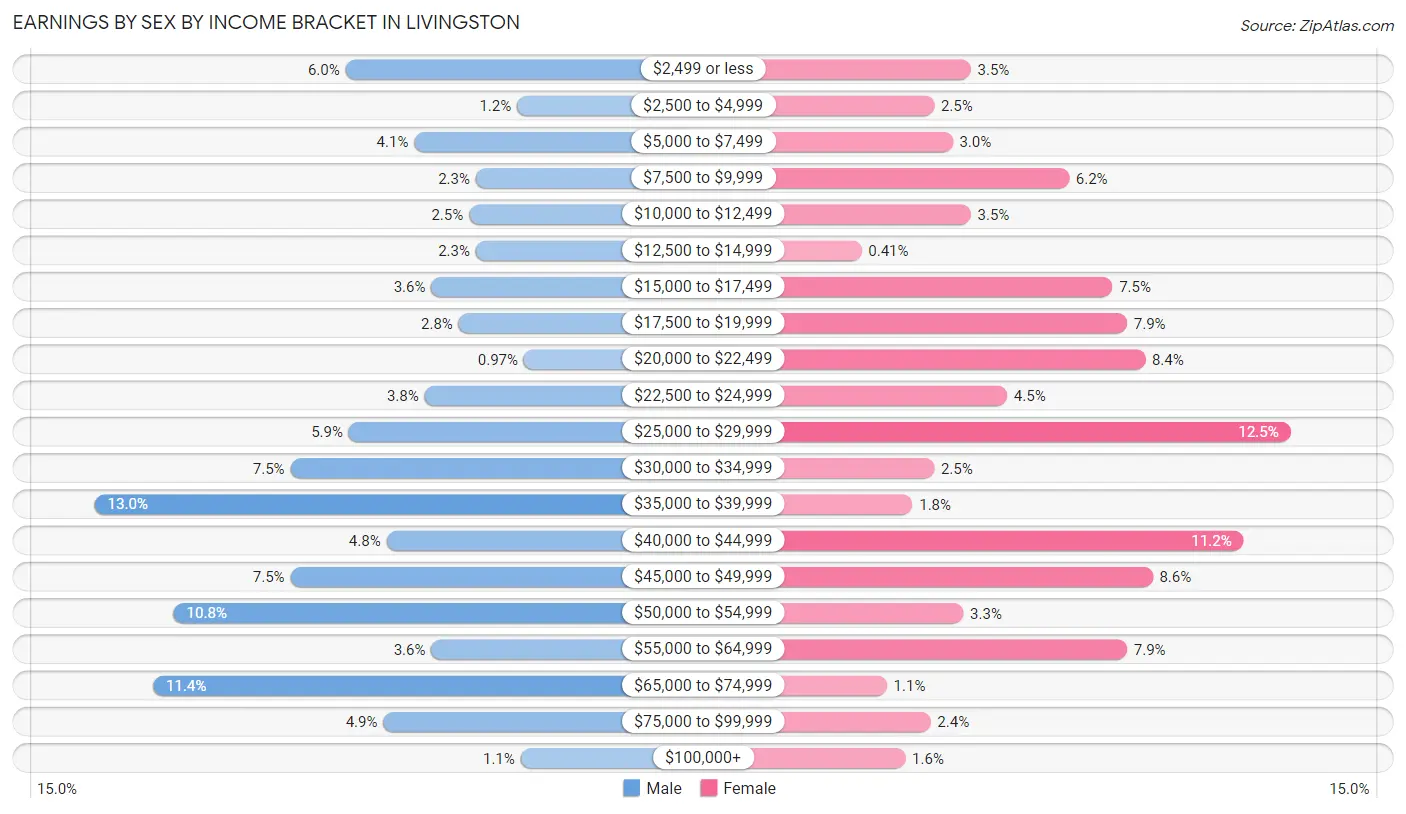
Earnings by Sex by Income Bracket in Livingston
The most common earnings brackets in Livingston are $35,000 to $39,999 for men (135 | 13.0%) and $25,000 to $29,999 for women (122 | 12.5%).
| Income | Male | Female |
| $2,499 or less | 62 (6.0%) | 34 (3.5%) |
| $2,500 to $4,999 | 12 (1.2%) | 24 (2.5%) |
| $5,000 to $7,499 | 42 (4.1%) | 29 (3.0%) |
| $7,500 to $9,999 | 24 (2.3%) | 61 (6.2%) |
| $10,000 to $12,499 | 26 (2.5%) | 34 (3.5%) |
| $12,500 to $14,999 | 24 (2.3%) | 4 (0.4%) |
| $15,000 to $17,499 | 37 (3.6%) | 73 (7.5%) |
| $17,500 to $19,999 | 29 (2.8%) | 77 (7.9%) |
| $20,000 to $22,499 | 10 (1.0%) | 82 (8.4%) |
| $22,500 to $24,999 | 39 (3.8%) | 44 (4.5%) |
| $25,000 to $29,999 | 61 (5.9%) | 122 (12.5%) |
| $30,000 to $34,999 | 78 (7.5%) | 24 (2.5%) |
| $35,000 to $39,999 | 135 (13.0%) | 18 (1.8%) |
| $40,000 to $44,999 | 50 (4.8%) | 109 (11.2%) |
| $45,000 to $49,999 | 78 (7.5%) | 84 (8.6%) |
| $50,000 to $54,999 | 112 (10.8%) | 32 (3.3%) |
| $55,000 to $64,999 | 37 (3.6%) | 77 (7.9%) |
| $65,000 to $74,999 | 118 (11.4%) | 11 (1.1%) |
| $75,000 to $99,999 | 51 (4.9%) | 23 (2.4%) |
| $100,000+ | 11 (1.1%) | 16 (1.6%) |
| Total | 1,036 (100.0%) | 978 (100.0%) |
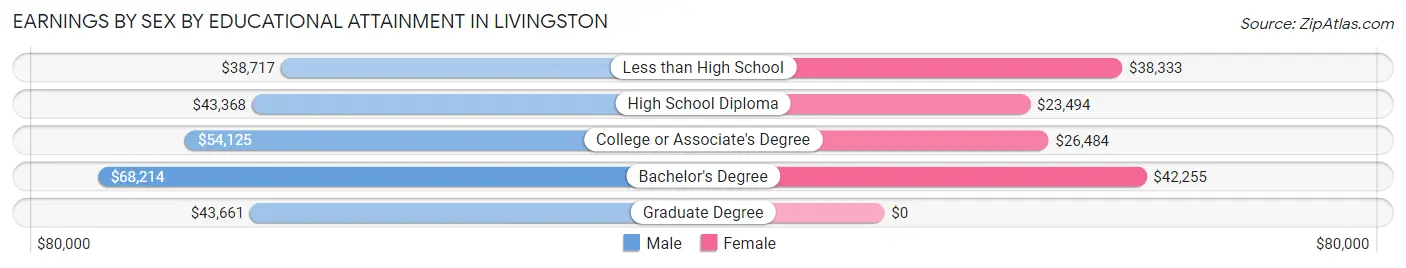
Earnings by Sex by Educational Attainment in Livingston
Average earnings in Livingston are $44,050 for men and $27,479 for women, a difference of 37.6%. Men with an educational attainment of bachelor's degree enjoy the highest average annual earnings of $68,214, while those with less than high school education earn the least with $38,717. Women with an educational attainment of bachelor's degree earn the most with the average annual earnings of $42,255, while those with high school diploma education have the smallest earnings of $23,494.
| Educational Attainment | Male Income | Female Income |
| Less than High School | $38,717 | $38,333 |
| High School Diploma | $43,368 | $23,494 |
| College or Associate's Degree | $54,125 | $26,484 |
| Bachelor's Degree | $68,214 | $42,255 |
| Graduate Degree | $43,661 | $0 |
| Total | $44,050 | $27,479 |
Family Income in Livingston
Family Income Brackets in Livingston
According to the Livingston family income data, there are 167 families falling into the $100,000 to $149,999 income range, which is the most common income bracket and makes up 19.0% of all families. Conversely, the $150,000 to $199,999 income bracket is the least frequent group with only 19 families (2.2%) belonging to this category.
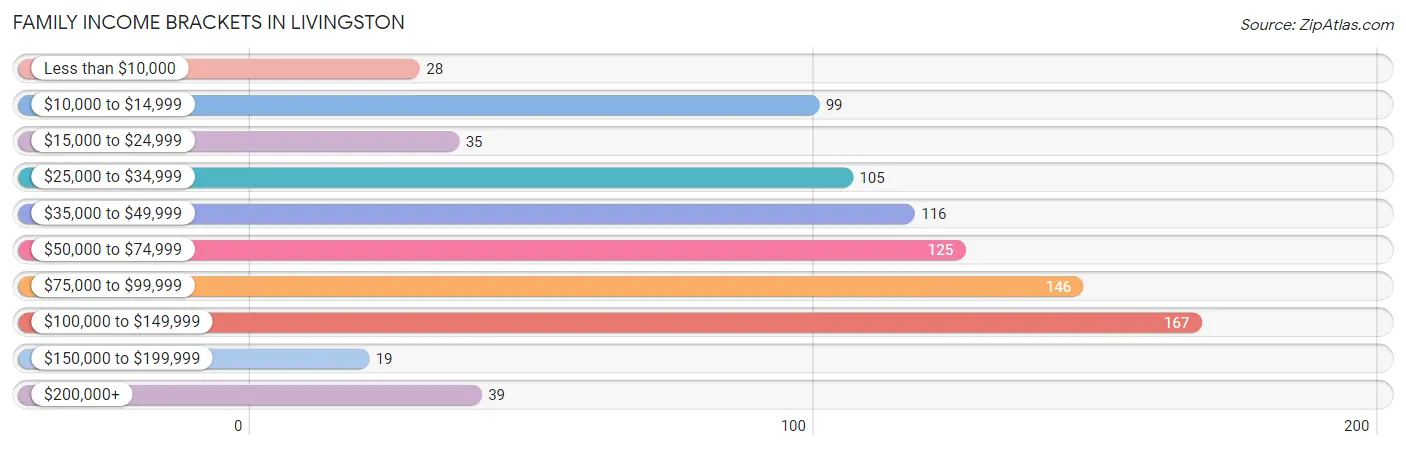
| Income Bracket | # Families | % Families |
| Less than $10,000 | 28 | 3.2% |
| $10,000 to $14,999 | 99 | 11.3% |
| $15,000 to $24,999 | 35 | 4.0% |
| $25,000 to $34,999 | 105 | 11.9% |
| $35,000 to $49,999 | 116 | 13.2% |
| $50,000 to $74,999 | 125 | 14.2% |
| $75,000 to $99,999 | 146 | 16.6% |
| $100,000 to $149,999 | 167 | 19.0% |
| $150,000 to $199,999 | 19 | 2.2% |
| $200,000+ | 39 | 4.4% |
Family Income by Famaliy Size in Livingston
3-person families (230 | 26.2%) account for the highest median family income in Livingston with $77,935 per family, while 3-person families (230 | 26.2%) have the highest median income of $25,978 per family member.
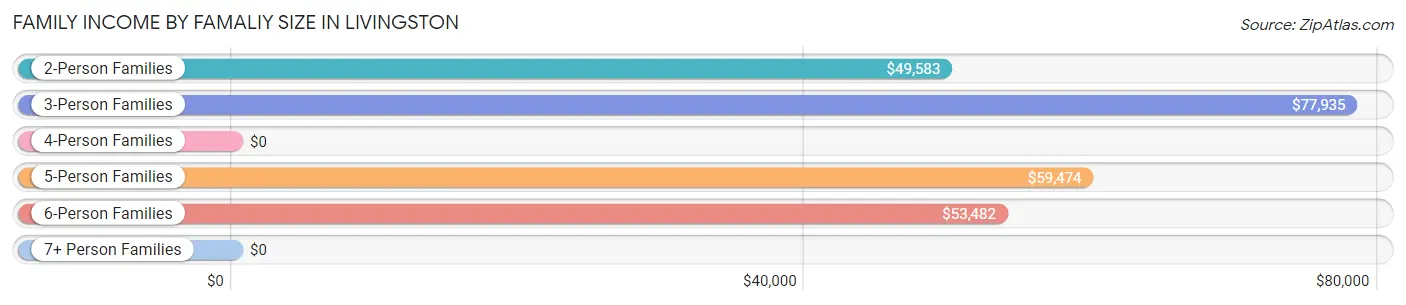
| Income Bracket | # Families | Median Income |
| 2-Person Families | 406 (46.2%) | $49,583 |
| 3-Person Families | 230 (26.2%) | $77,935 |
| 4-Person Families | 138 (15.7%) | $0 |
| 5-Person Families | 82 (9.3%) | $59,474 |
| 6-Person Families | 23 (2.6%) | $53,482 |
| 7+ Person Families | 0 (0.0%) | $0 |
| Total | 879 (100.0%) | $56,696 |
Family Income by Number of Earners in Livingston
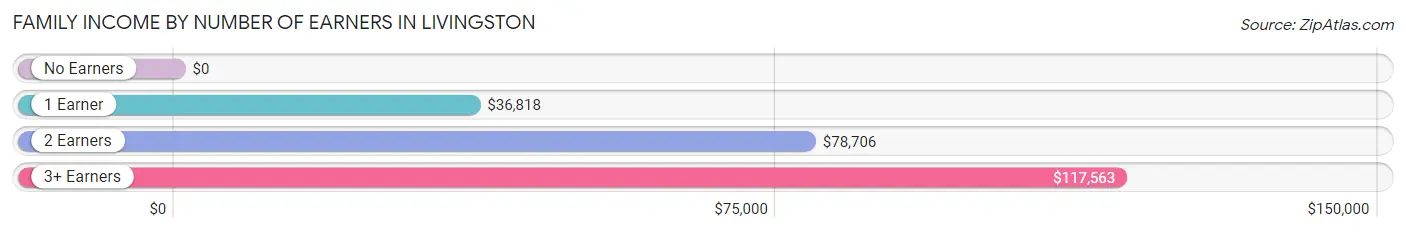
| Number of Earners | # Families | Median Income |
| No Earners | 141 (16.0%) | $0 |
| 1 Earner | 310 (35.3%) | $36,818 |
| 2 Earners | 349 (39.7%) | $78,706 |
| 3+ Earners | 79 (9.0%) | $117,563 |
| Total | 879 (100.0%) | $56,696 |
Household Income in Livingston
Household Income Brackets in Livingston
With 242 households falling in the category, the $35,000 to $49,999 income range is the most frequent in Livingston, accounting for 15.8% of all households. In contrast, only 18 households (1.2%) fall into the $150,000 to $199,999 income bracket, making it the least populous group.
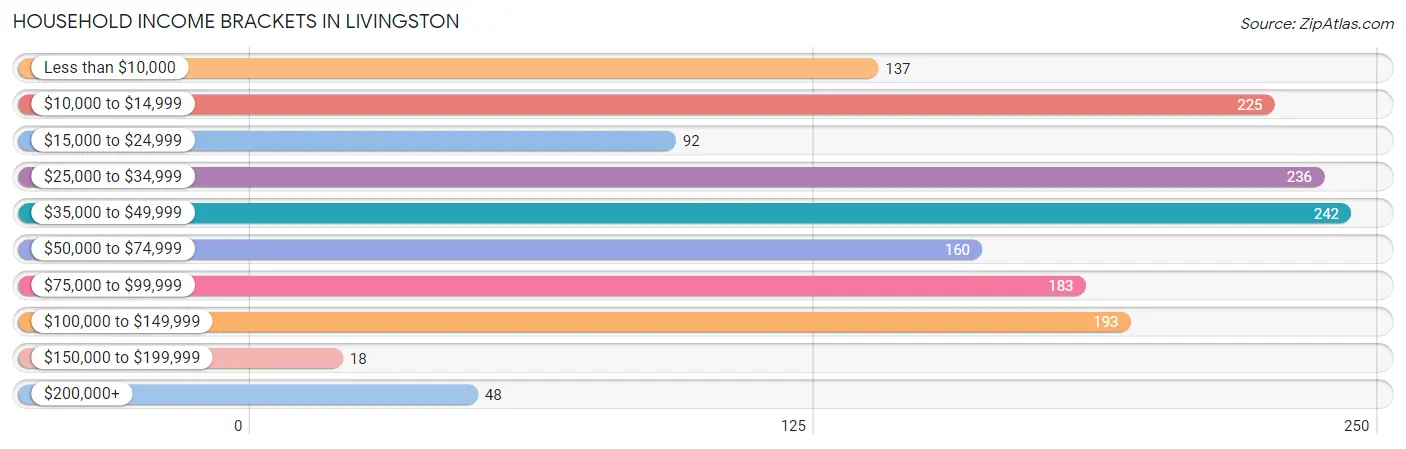
| Income Bracket | # Households | % Households |
| Less than $10,000 | 137 | 8.9% |
| $10,000 to $14,999 | 225 | 14.7% |
| $15,000 to $24,999 | 92 | 6.0% |
| $25,000 to $34,999 | 236 | 15.4% |
| $35,000 to $49,999 | 242 | 15.8% |
| $50,000 to $74,999 | 160 | 10.4% |
| $75,000 to $99,999 | 183 | 11.9% |
| $100,000 to $149,999 | 193 | 12.6% |
| $150,000 to $199,999 | 18 | 1.2% |
| $200,000+ | 48 | 3.1% |
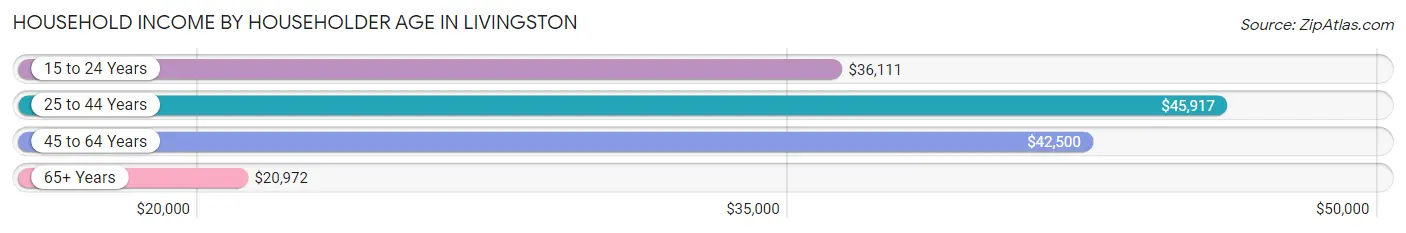
Household Income by Householder Age in Livingston
The median household income in Livingston is $37,346, with the highest median household income of $45,917 found in the 25 to 44 years age bracket for the primary householder. A total of 413 households (26.9%) fall into this category. Meanwhile, the 65+ years age bracket for the primary householder has the lowest median household income of $20,972, with 451 households (29.4%) in this group.
| Income Bracket | # Households | Median Income |
| 15 to 24 Years | 34 (2.2%) | $36,111 |
| 25 to 44 Years | 413 (26.9%) | $45,917 |
| 45 to 64 Years | 636 (41.5%) | $42,500 |
| 65+ Years | 451 (29.4%) | $20,972 |
| Total | 1,534 (100.0%) | $37,346 |
Poverty in Livingston
Income Below Poverty by Sex and Age in Livingston
With 14.9% poverty level for males and 21.6% for females among the residents of Livingston, 75 year old and over males and 65 to 74 year old females are the most vulnerable to poverty, with 35 males (34.6%) and 72 females (39.1%) in their respective age groups living below the poverty level.
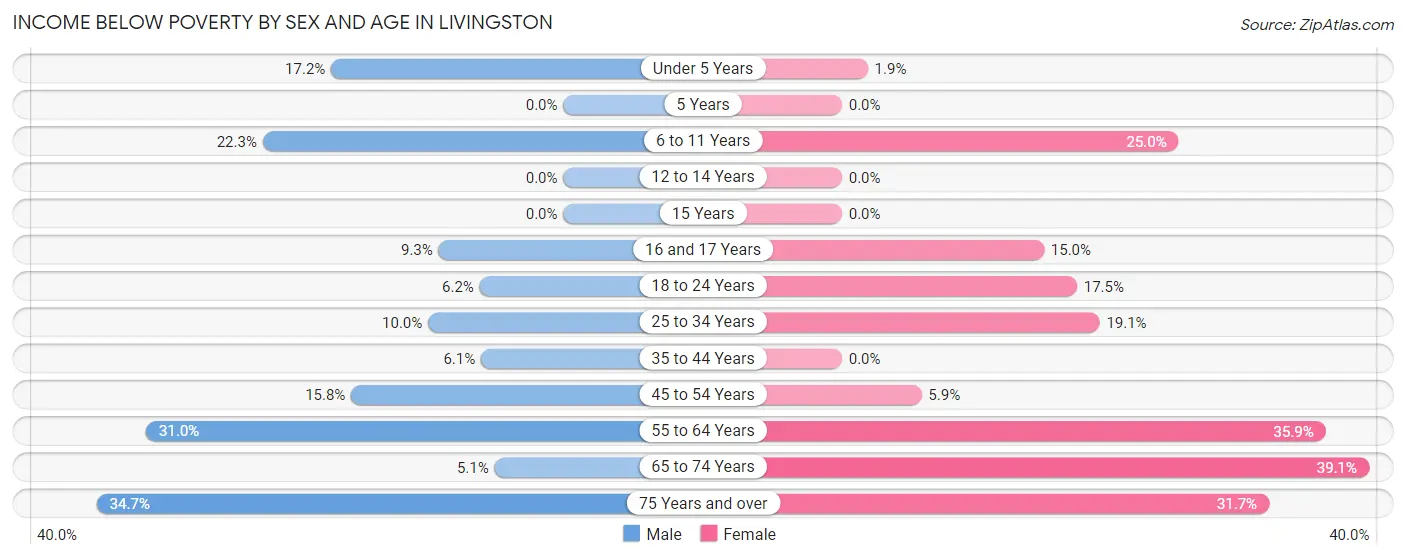
| Age Bracket | Male | Female |
| Under 5 Years | 20 (17.2%) | 1 (1.9%) |
| 5 Years | 0 (0.0%) | 0 (0.0%) |
| 6 to 11 Years | 50 (22.3%) | 35 (25.0%) |
| 12 to 14 Years | 0 (0.0%) | 0 (0.0%) |
| 15 Years | 0 (0.0%) | 0 (0.0%) |
| 16 and 17 Years | 5 (9.3%) | 6 (15.0%) |
| 18 to 24 Years | 10 (6.2%) | 26 (17.4%) |
| 25 to 34 Years | 23 (10.0%) | 66 (19.1%) |
| 35 to 44 Years | 14 (6.1%) | 0 (0.0%) |
| 45 to 54 Years | 43 (15.8%) | 13 (5.9%) |
| 55 to 64 Years | 66 (31.0%) | 139 (35.9%) |
| 65 to 74 Years | 9 (5.1%) | 72 (39.1%) |
| 75 Years and over | 35 (34.6%) | 39 (31.7%) |
| Total | 275 (14.9%) | 397 (21.6%) |
Income Above Poverty by Sex and Age in Livingston
According to the poverty statistics in Livingston, males aged 5 years and females aged 5 years are the age groups that are most secure financially, with 100.0% of males and 100.0% of females in these age groups living above the poverty line.
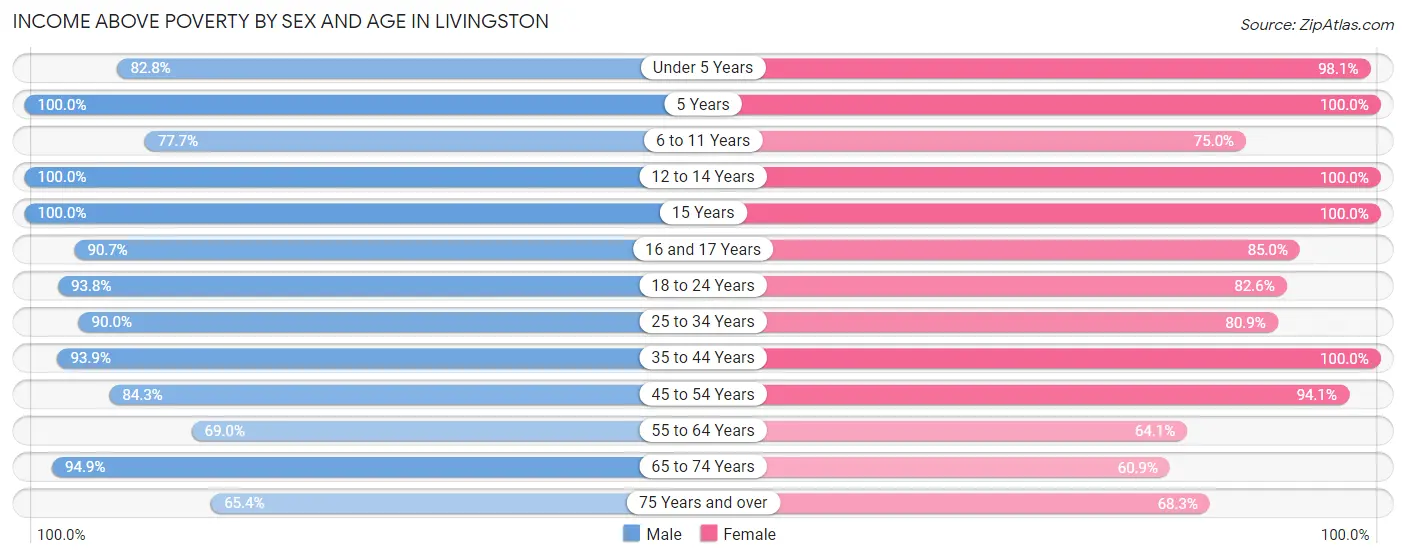
| Age Bracket | Male | Female |
| Under 5 Years | 96 (82.8%) | 51 (98.1%) |
| 5 Years | 4 (100.0%) | 46 (100.0%) |
| 6 to 11 Years | 174 (77.7%) | 105 (75.0%) |
| 12 to 14 Years | 43 (100.0%) | 25 (100.0%) |
| 15 Years | 21 (100.0%) | 10 (100.0%) |
| 16 and 17 Years | 49 (90.7%) | 34 (85.0%) |
| 18 to 24 Years | 151 (93.8%) | 123 (82.6%) |
| 25 to 34 Years | 206 (90.0%) | 279 (80.9%) |
| 35 to 44 Years | 215 (93.9%) | 114 (100.0%) |
| 45 to 54 Years | 230 (84.3%) | 207 (94.1%) |
| 55 to 64 Years | 147 (69.0%) | 248 (64.1%) |
| 65 to 74 Years | 167 (94.9%) | 112 (60.9%) |
| 75 Years and over | 66 (65.3%) | 84 (68.3%) |
| Total | 1,569 (85.1%) | 1,438 (78.4%) |
Income Below Poverty Among Married-Couple Families in Livingston
The poverty statistics for married-couple families in Livingston show that 15.3% or 105 of the total 684 families live below the poverty line. Families with no children have the highest poverty rate of 24.1%, comprising of 99 families. On the other hand, families with 1 or 2 children have the lowest poverty rate of 0.0%, which includes 0 families.
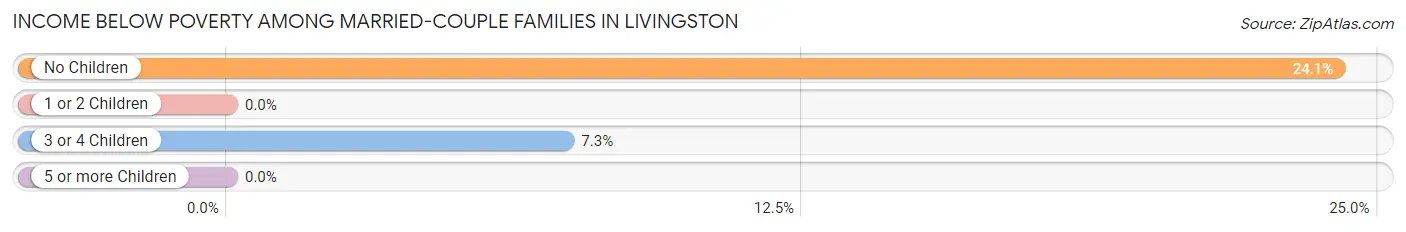
| Children | Above Poverty | Below Poverty |
| No Children | 312 (75.9%) | 99 (24.1%) |
| 1 or 2 Children | 191 (100.0%) | 0 (0.0%) |
| 3 or 4 Children | 76 (92.7%) | 6 (7.3%) |
| 5 or more Children | 0 (0.0%) | 0 (0.0%) |
| Total | 579 (84.7%) | 105 (15.3%) |
Income Below Poverty Among Single-Parent Households in Livingston
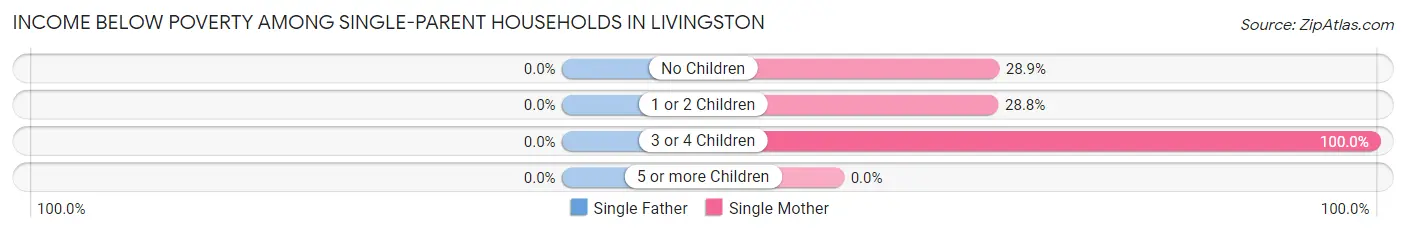
| Children | Single Father | Single Mother |
| No Children | 0 (0.0%) | 13 (28.9%) |
| 1 or 2 Children | 0 (0.0%) | 21 (28.8%) |
| 3 or 4 Children | 0 (0.0%) | 32 (100.0%) |
| 5 or more Children | 0 (0.0%) | 0 (0.0%) |
| Total | 0 (0.0%) | 66 (44.0%) |
Income Below Poverty Among Married-Couple vs Single-Parent Households in Livingston
The poverty data for Livingston shows that 105 of the married-couple family households (15.3%) and 66 of the single-parent households (33.9%) are living below the poverty level. Within the married-couple family households, those with no children have the highest poverty rate, with 99 households (24.1%) falling below the poverty line. Among the single-parent households, those with 3 or 4 children have the highest poverty rate, with 32 household (100.0%) living below poverty.
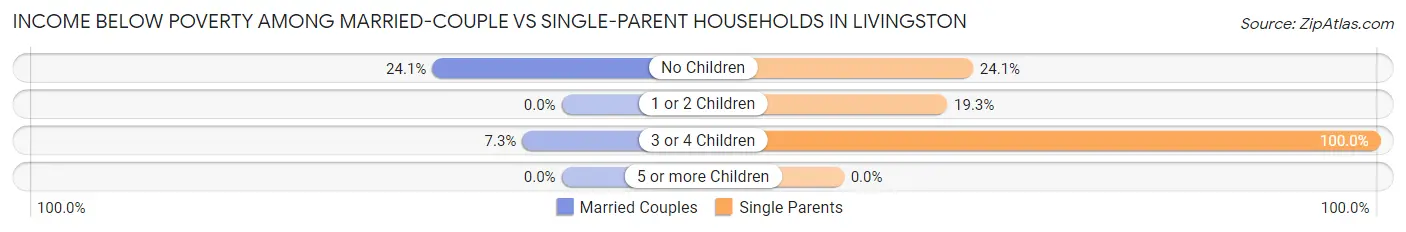
| Children | Married-Couple Families | Single-Parent Households |
| No Children | 99 (24.1%) | 13 (24.1%) |
| 1 or 2 Children | 0 (0.0%) | 21 (19.3%) |
| 3 or 4 Children | 6 (7.3%) | 32 (100.0%) |
| 5 or more Children | 0 (0.0%) | 0 (0.0%) |
| Total | 105 (15.3%) | 66 (33.9%) |
Race in Livingston
The most populous races in Livingston are White / Caucasian (3,498 | 89.2%), Black / African American (242 | 6.2%), and Hispanic or Latino (150 | 3.8%).
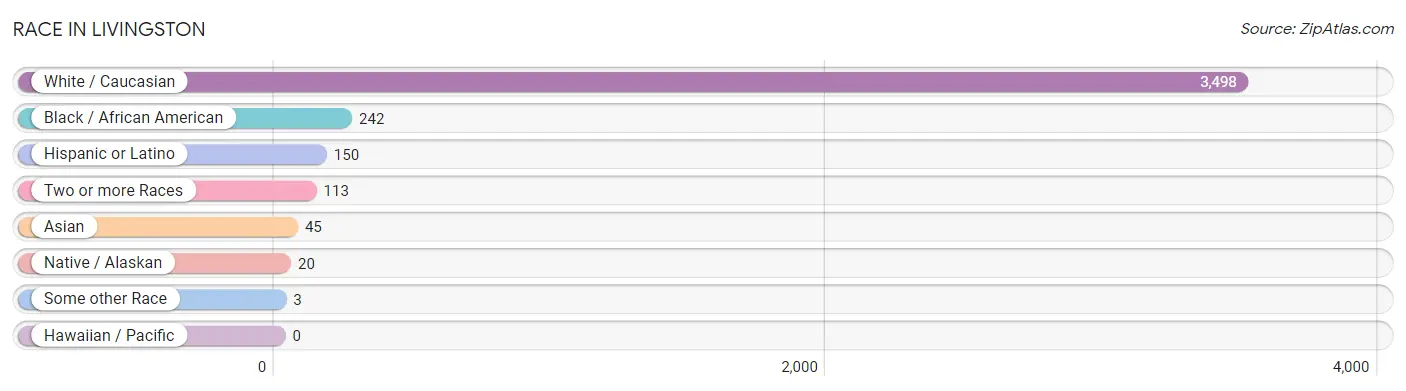
| Race | # Population | % Population |
| Asian | 45 | 1.1% |
| Black / African American | 242 | 6.2% |
| Hawaiian / Pacific | 0 | 0.0% |
| Hispanic or Latino | 150 | 3.8% |
| Native / Alaskan | 20 | 0.5% |
| White / Caucasian | 3,498 | 89.2% |
| Two or more Races | 113 | 2.9% |
| Some other Race | 3 | 0.1% |
| Total | 3,921 | 100.0% |
Ancestry in Livingston
The most populous ancestries reported in Livingston are American (865 | 22.1%), Irish (421 | 10.7%), English (297 | 7.6%), German (295 | 7.5%), and Scotch-Irish (102 | 2.6%), together accounting for 50.5% of all Livingston residents.
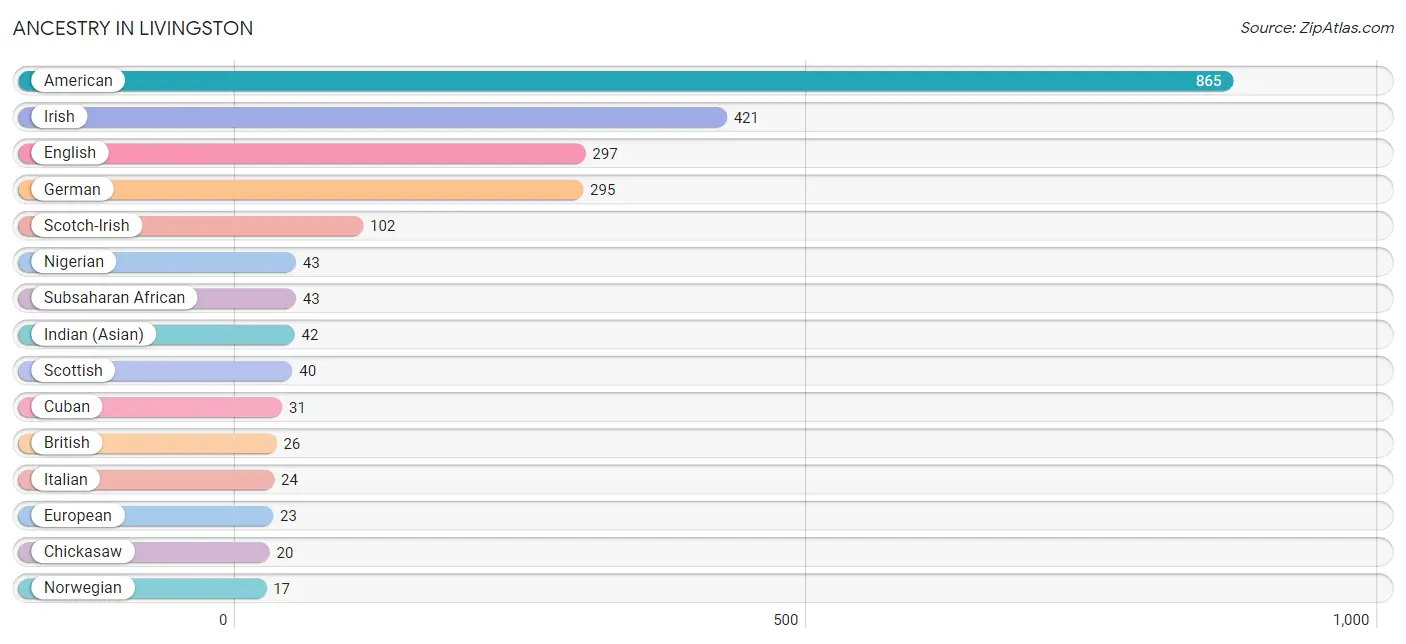
| Ancestry | # Population | % Population |
| American | 865 | 22.1% |
| British | 26 | 0.7% |
| Chickasaw | 20 | 0.5% |
| Cuban | 31 | 0.8% |
| Danish | 10 | 0.3% |
| Dutch | 6 | 0.2% |
| Eastern European | 4 | 0.1% |
| English | 297 | 7.6% |
| European | 23 | 0.6% |
| French | 6 | 0.2% |
| German | 295 | 7.5% |
| Indian (Asian) | 42 | 1.1% |
| Irish | 421 | 10.7% |
| Italian | 24 | 0.6% |
| Lithuanian | 8 | 0.2% |
| Malaysian | 3 | 0.1% |
| Mexican | 7 | 0.2% |
| Nigerian | 43 | 1.1% |
| Norwegian | 17 | 0.4% |
| Puerto Rican | 9 | 0.2% |
| Scandinavian | 10 | 0.3% |
| Scotch-Irish | 102 | 2.6% |
| Scottish | 40 | 1.0% |
| Subsaharan African | 43 | 1.1% |
| Swedish | 8 | 0.2% |
| Welsh | 8 | 0.2% | View All 26 Rows |
Immigrants in Livingston
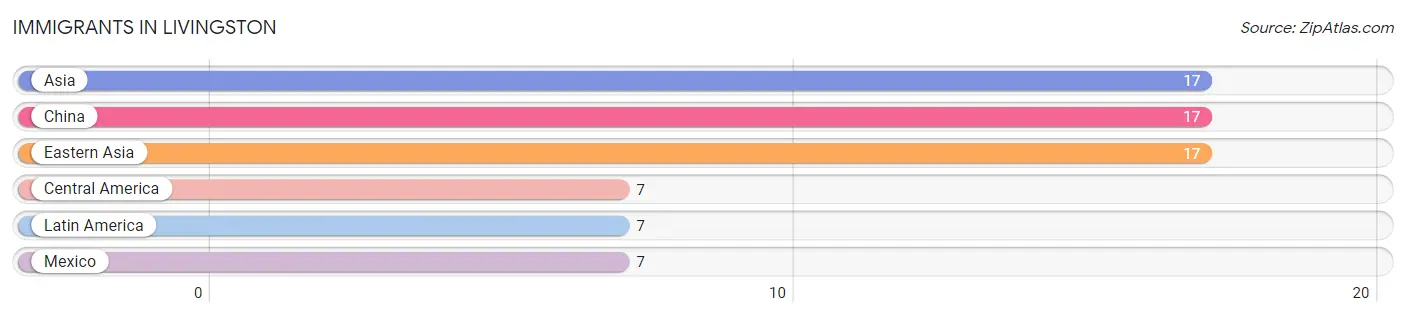
The most numerous immigrant groups reported in Livingston came from Asia (17 | 0.4%), China (17 | 0.4%), Eastern Asia (17 | 0.4%), Central America (7 | 0.2%), and Latin America (7 | 0.2%), together accounting for 1.7% of all Livingston residents.
| Immigration Origin | # Population | % Population |
| Asia | 17 | 0.4% |
| Central America | 7 | 0.2% |
| China | 17 | 0.4% |
| Eastern Asia | 17 | 0.4% |
| Latin America | 7 | 0.2% |
| Mexico | 7 | 0.2% | View All 6 Rows |
Sex and Age in Livingston
Sex and Age in Livingston
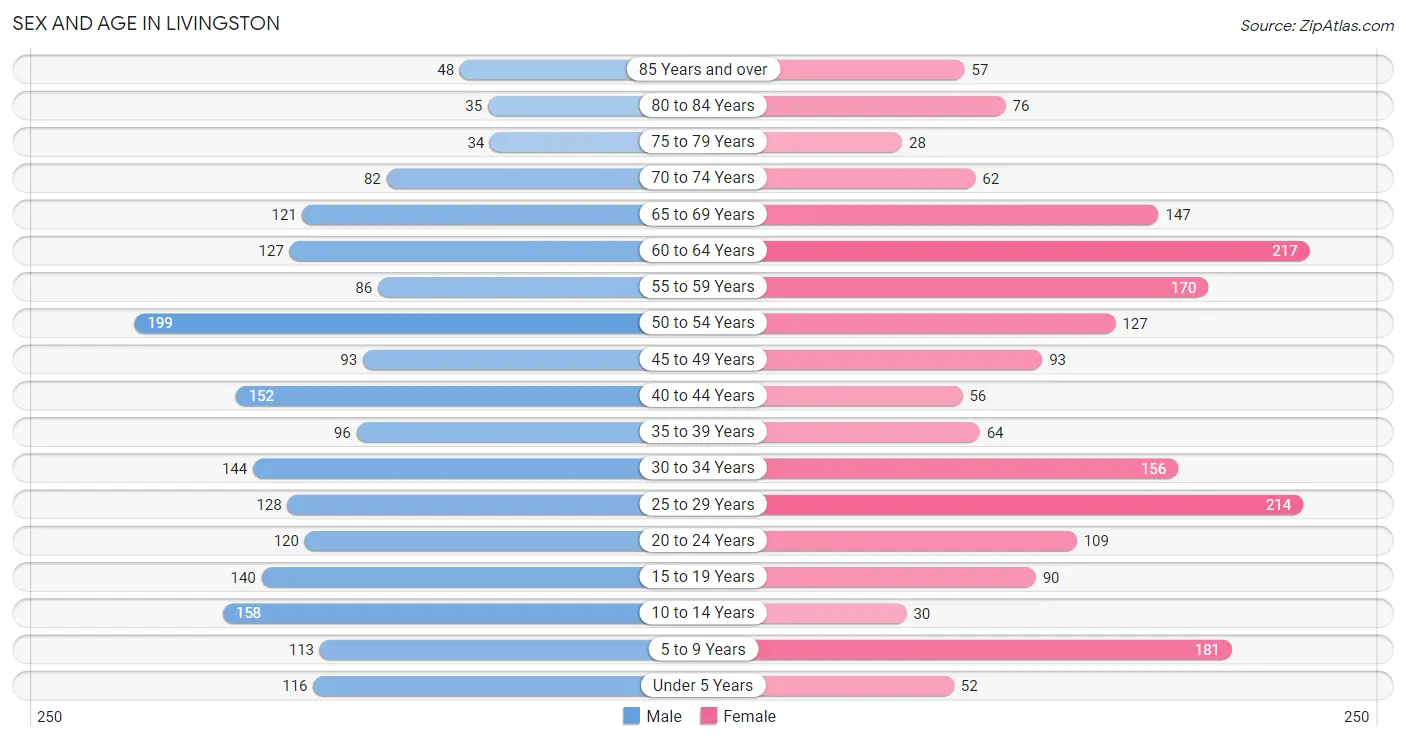
The most populous age groups in Livingston are 50 to 54 Years (199 | 10.0%) for men and 60 to 64 Years (217 | 11.3%) for women.
| Age Bracket | Male | Female |
| Under 5 Years | 116 (5.8%) | 52 (2.7%) |
| 5 to 9 Years | 113 (5.7%) | 181 (9.4%) |
| 10 to 14 Years | 158 (7.9%) | 30 (1.6%) |
| 15 to 19 Years | 140 (7.0%) | 90 (4.7%) |
| 20 to 24 Years | 120 (6.0%) | 109 (5.7%) |
| 25 to 29 Years | 128 (6.4%) | 214 (11.1%) |
| 30 to 34 Years | 144 (7.2%) | 156 (8.1%) |
| 35 to 39 Years | 96 (4.8%) | 64 (3.3%) |
| 40 to 44 Years | 152 (7.6%) | 56 (2.9%) |
| 45 to 49 Years | 93 (4.7%) | 93 (4.8%) |
| 50 to 54 Years | 199 (10.0%) | 127 (6.6%) |
| 55 to 59 Years | 86 (4.3%) | 170 (8.8%) |
| 60 to 64 Years | 127 (6.4%) | 217 (11.3%) |
| 65 to 69 Years | 121 (6.1%) | 147 (7.6%) |
| 70 to 74 Years | 82 (4.1%) | 62 (3.2%) |
| 75 to 79 Years | 34 (1.7%) | 28 (1.5%) |
| 80 to 84 Years | 35 (1.8%) | 76 (3.9%) |
| 85 Years and over | 48 (2.4%) | 57 (2.9%) |
| Total | 1,992 (100.0%) | 1,929 (100.0%) |
Families and Households in Livingston
Median Family Size in Livingston
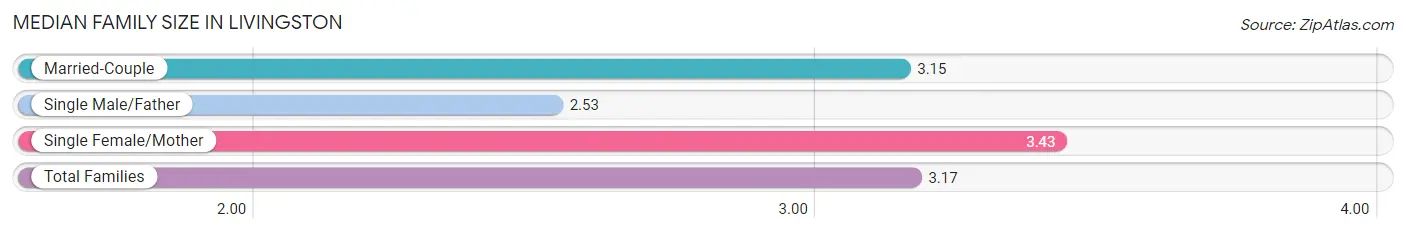
The median family size in Livingston is 3.17 persons per family, with single female/mother families (150 | 17.1%) accounting for the largest median family size of 3.43 persons per family. On the other hand, single male/father families (45 | 5.1%) represent the smallest median family size with 2.53 persons per family.
| Family Type | # Families | Family Size |
| Married-Couple | 684 (77.8%) | 3.15 |
| Single Male/Father | 45 (5.1%) | 2.53 |
| Single Female/Mother | 150 (17.1%) | 3.43 |
| Total Families | 879 (100.0%) | 3.17 |
Median Household Size in Livingston
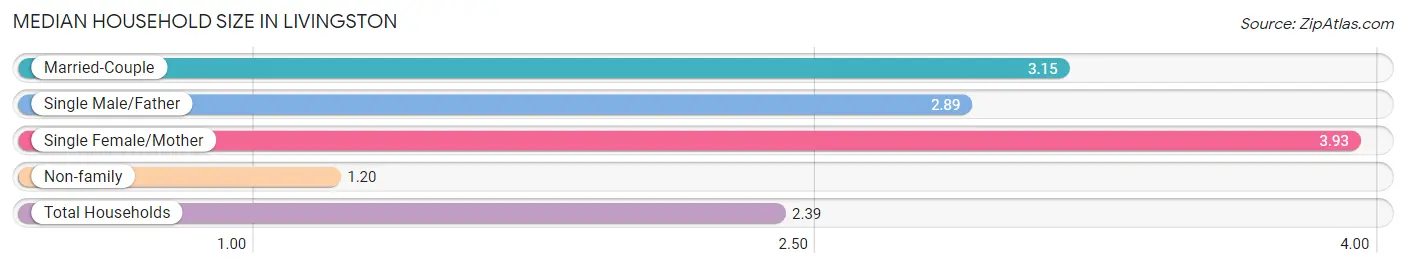
The median household size in Livingston is 2.39 persons per household, with single female/mother households (150 | 9.8%) accounting for the largest median household size of 3.93 persons per household. non-family households (655 | 42.7%) represent the smallest median household size with 1.20 persons per household.
| Household Type | # Households | Household Size |
| Married-Couple | 684 (44.6%) | 3.15 |
| Single Male/Father | 45 (2.9%) | 2.89 |
| Single Female/Mother | 150 (9.8%) | 3.93 |
| Non-family | 655 (42.7%) | 1.20 |
| Total Households | 1,534 (100.0%) | 2.39 |
Household Size by Marriage Status in Livingston
Out of a total of 1,534 households in Livingston, 879 (57.3%) are family households, while 655 (42.7%) are nonfamily households. The most numerous type of family households are 2-person households, comprising 382, and the most common type of nonfamily households are 1-person households, comprising 596.
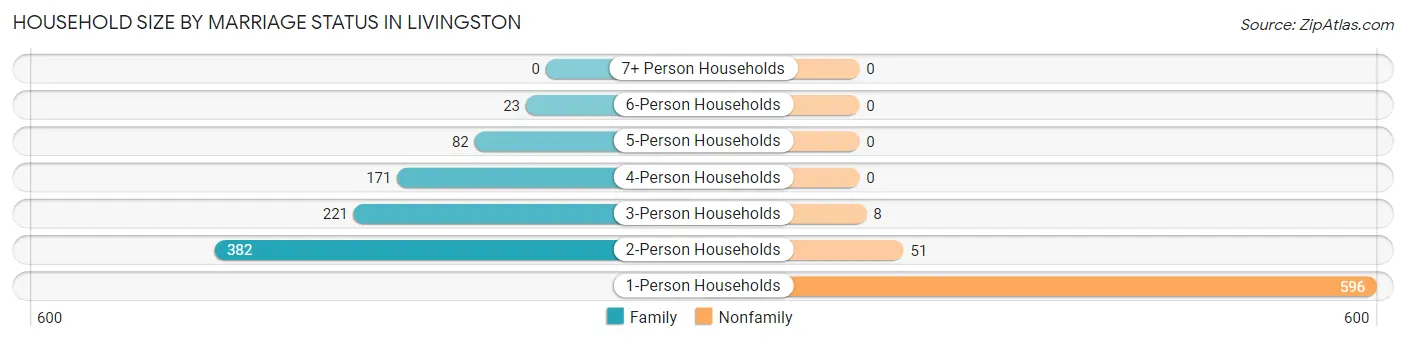
| Household Size | Family Households | Nonfamily Households |
| 1-Person Households | - | 596 (38.9%) |
| 2-Person Households | 382 (24.9%) | 51 (3.3%) |
| 3-Person Households | 221 (14.4%) | 8 (0.5%) |
| 4-Person Households | 171 (11.2%) | 0 (0.0%) |
| 5-Person Households | 82 (5.3%) | 0 (0.0%) |
| 6-Person Households | 23 (1.5%) | 0 (0.0%) |
| 7+ Person Households | 0 (0.0%) | 0 (0.0%) |
| Total | 879 (57.3%) | 655 (42.7%) |
Female Fertility in Livingston
Fertility by Age in Livingston
Average fertility rate in Livingston is 37.0 births per 1,000 women. Women in the age bracket of 35 to 50 years have the highest fertility rate with 63.0 births per 1,000 women. Women in the age bracket of 20 to 34 years acount for 51.7% of all women with births.
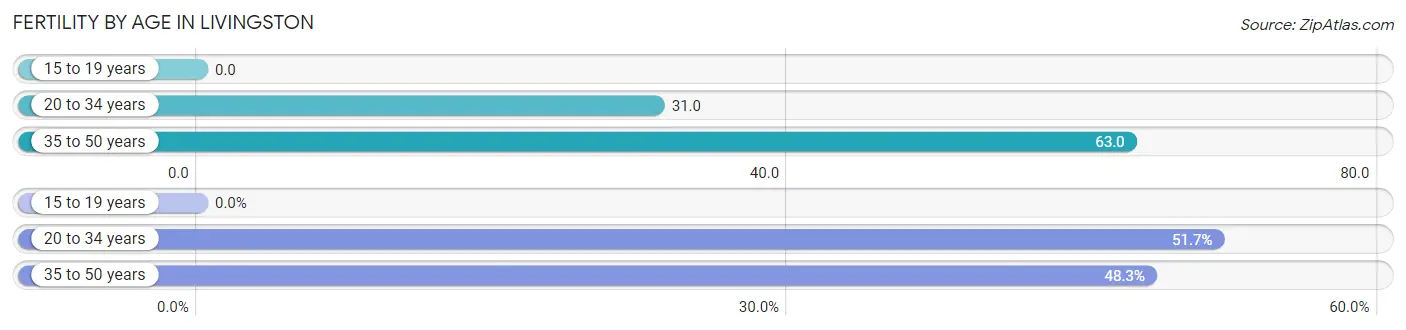
| Age Bracket | Women with Births | Births / 1,000 Women |
| 15 to 19 years | 0 (0.0%) | 0.0 |
| 20 to 34 years | 15 (51.7%) | 31.0 |
| 35 to 50 years | 14 (48.3%) | 63.0 |
| Total | 29 (100.0%) | 37.0 |
Fertility by Age by Marriage Status in Livingston
69.0% of women with births (29) in Livingston are married. The highest percentage of unmarried women with births falls into 20 to 34 years age bracket with 60.0% of them unmarried at the time of birth, while the lowest percentage of unmarried women with births belong to 35 to 50 years age bracket with 0.0% of them unmarried.
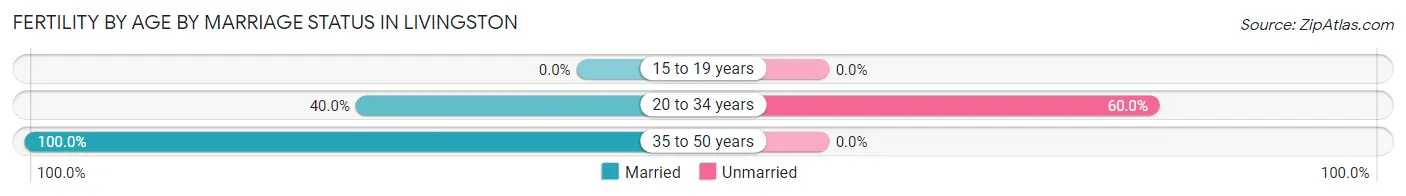
| Age Bracket | Married | Unmarried |
| 15 to 19 years | 0 (0.0%) | 0 (0.0%) |
| 20 to 34 years | 6 (40.0%) | 9 (60.0%) |
| 35 to 50 years | 14 (100.0%) | 0 (0.0%) |
| Total | 20 (69.0%) | 9 (31.0%) |
Fertility by Education in Livingston
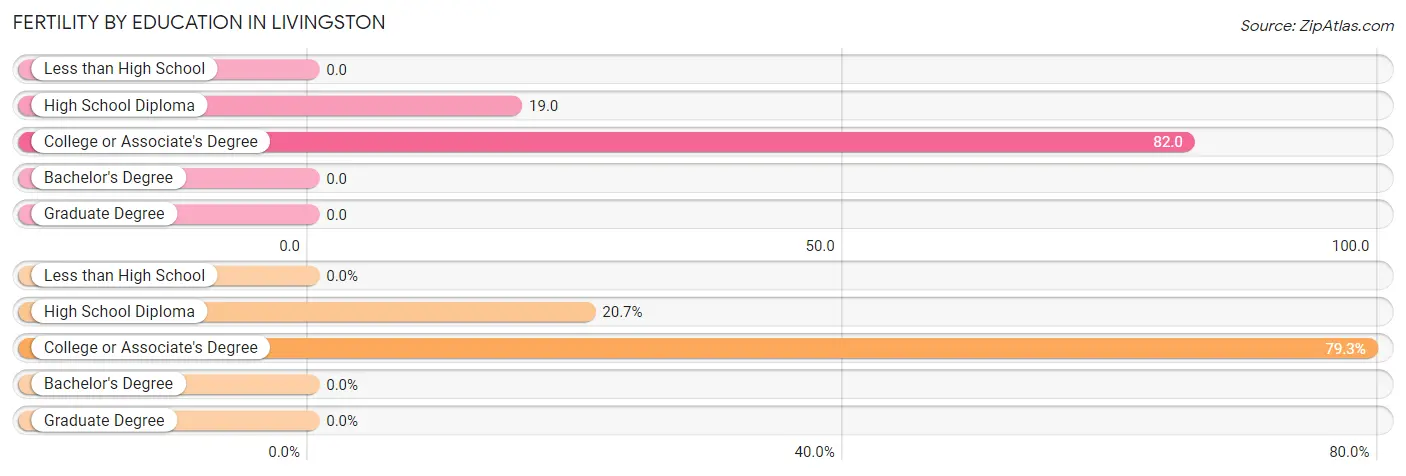
| Educational Attainment | Women with Births | Births / 1,000 Women |
| Less than High School | 0 (0.0%) | 0.0 |
| High School Diploma | 6 (20.7%) | 19.0 |
| College or Associate's Degree | 23 (79.3%) | 82.0 |
| Bachelor's Degree | 0 (0.0%) | 0.0 |
| Graduate Degree | 0 (0.0%) | 0.0 |
| Total | 29 (100.0%) | 37.0 |
Fertility by Education by Marriage Status in Livingston
31.0% of women with births in Livingston are unmarried. Women with the educational attainment of high school diploma are most likely to be married with 100.0% of them married at childbirth, while women with the educational attainment of college or associate's degree are least likely to be married with 39.1% of them unmarried at childbirth.
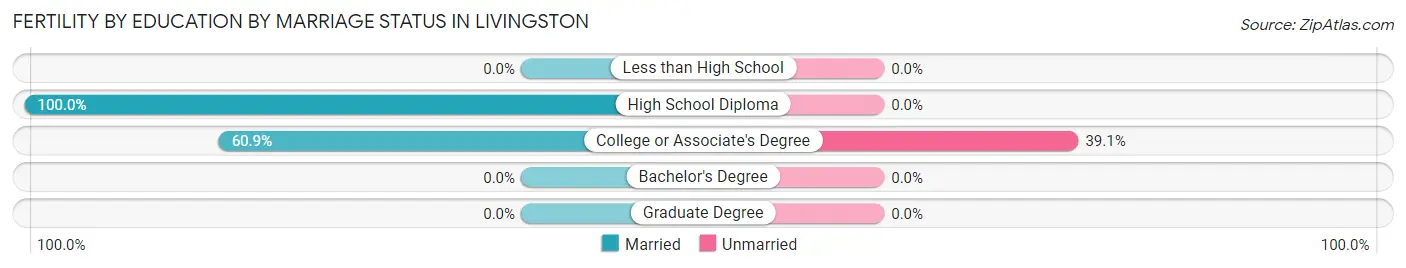
| Educational Attainment | Married | Unmarried |
| Less than High School | 0 (0.0%) | 0 (0.0%) |
| High School Diploma | 6 (100.0%) | 0 (0.0%) |
| College or Associate's Degree | 14 (60.9%) | 9 (39.1%) |
| Bachelor's Degree | 0 (0.0%) | 0 (0.0%) |
| Graduate Degree | 0 (0.0%) | 0 (0.0%) |
| Total | 20 (69.0%) | 9 (31.0%) |
Employment Characteristics in Livingston
Employment by Class of Employer in Livingston
Among the 1,799 employed individuals in Livingston, private company employees (1,217 | 67.6%), self-employed (not incorporated) (172 | 9.6%), and local government employees (140 | 7.8%) make up the most common classes of employment.
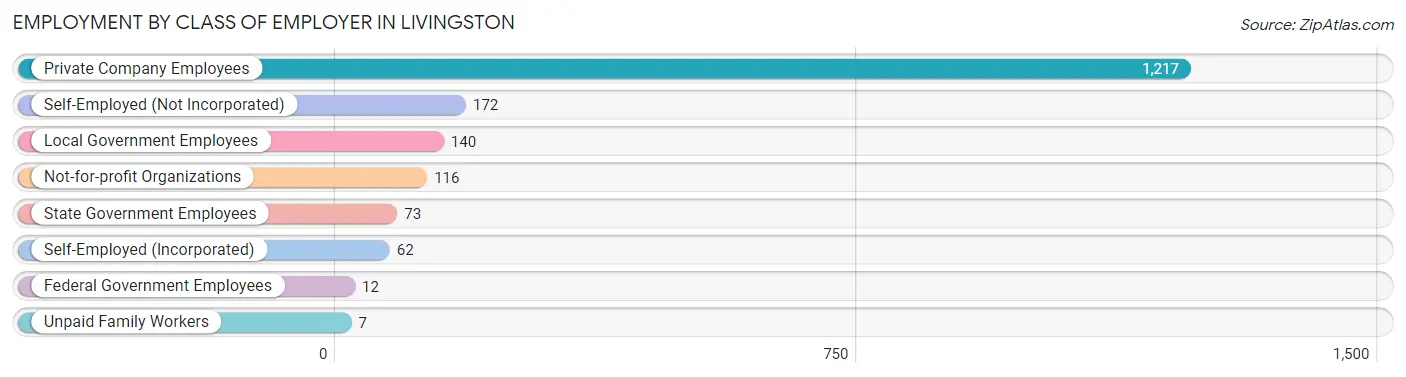
| Employer Class | # Employees | % Employees |
| Private Company Employees | 1,217 | 67.6% |
| Self-Employed (Incorporated) | 62 | 3.5% |
| Self-Employed (Not Incorporated) | 172 | 9.6% |
| Not-for-profit Organizations | 116 | 6.5% |
| Local Government Employees | 140 | 7.8% |
| State Government Employees | 73 | 4.1% |
| Federal Government Employees | 12 | 0.7% |
| Unpaid Family Workers | 7 | 0.4% |
| Total | 1,799 | 100.0% |
Employment Status by Age in Livingston
According to the labor force statistics for Livingston, out of the total population over 16 years of age (3,240), 57.2% or 1,853 individuals are in the labor force, with 1.8% or 33 of them unemployed. The age group with the highest labor force participation rate is 55 to 59 years, with 88.7% or 227 individuals in the labor force. Within the labor force, the 35 to 44 years age range has the highest percentage of unemployed individuals, with 5.8% or 15 of them being unemployed.
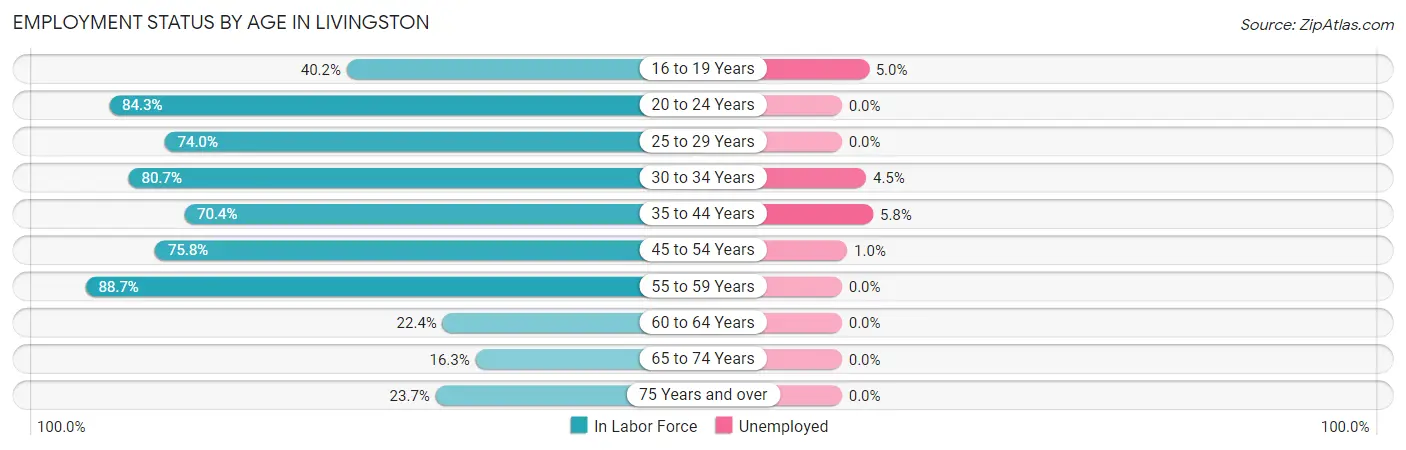
| Age Bracket | In Labor Force | Unemployed |
| 16 to 19 Years | 80 (40.2%) | 4 (5.0%) |
| 20 to 24 Years | 193 (84.3%) | 0 (0.0%) |
| 25 to 29 Years | 253 (74.0%) | 0 (0.0%) |
| 30 to 34 Years | 242 (80.7%) | 11 (4.5%) |
| 35 to 44 Years | 259 (70.4%) | 15 (5.8%) |
| 45 to 54 Years | 388 (75.8%) | 4 (1.0%) |
| 55 to 59 Years | 227 (88.7%) | 0 (0.0%) |
| 60 to 64 Years | 77 (22.4%) | 0 (0.0%) |
| 65 to 74 Years | 67 (16.3%) | 0 (0.0%) |
| 75 Years and over | 66 (23.7%) | 0 (0.0%) |
| Total | 1,853 (57.2%) | 33 (1.8%) |
Employment Status by Educational Attainment in Livingston
According to labor force statistics for Livingston, 68.1% of individuals (1,445) out of the total population between 25 and 64 years of age (2,122) are in the labor force, with 2.1% or 30 of them being unemployed. The group with the highest labor force participation rate are those with the educational attainment of bachelor's degree or higher, with 100.0% or 185 individuals in the labor force. Within the labor force, individuals with high school diploma education have the highest percentage of unemployment, with 4.1% or 30 of them being unemployed.
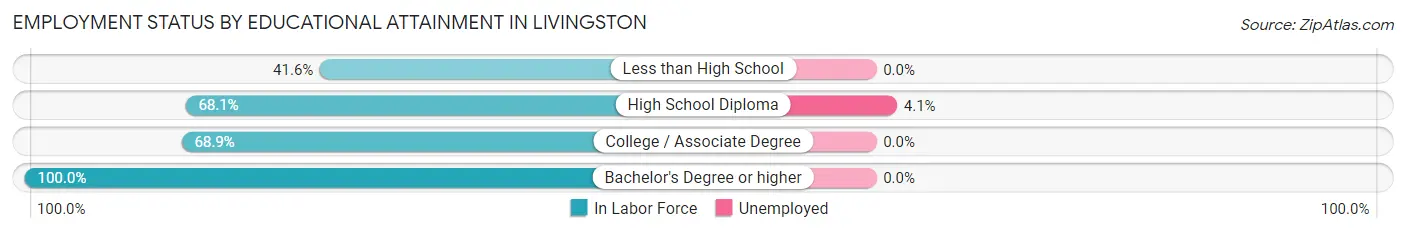
| Educational Attainment | In Labor Force | Unemployed |
| Less than High School | 99 (41.6%) | 0 (0.0%) |
| High School Diploma | 733 (68.1%) | 44 (4.1%) |
| College / Associate Degree | 429 (68.9%) | 0 (0.0%) |
| Bachelor's Degree or higher | 185 (100.0%) | 0 (0.0%) |
| Total | 1,445 (68.1%) | 45 (2.1%) |
Employment Occupations by Sex in Livingston
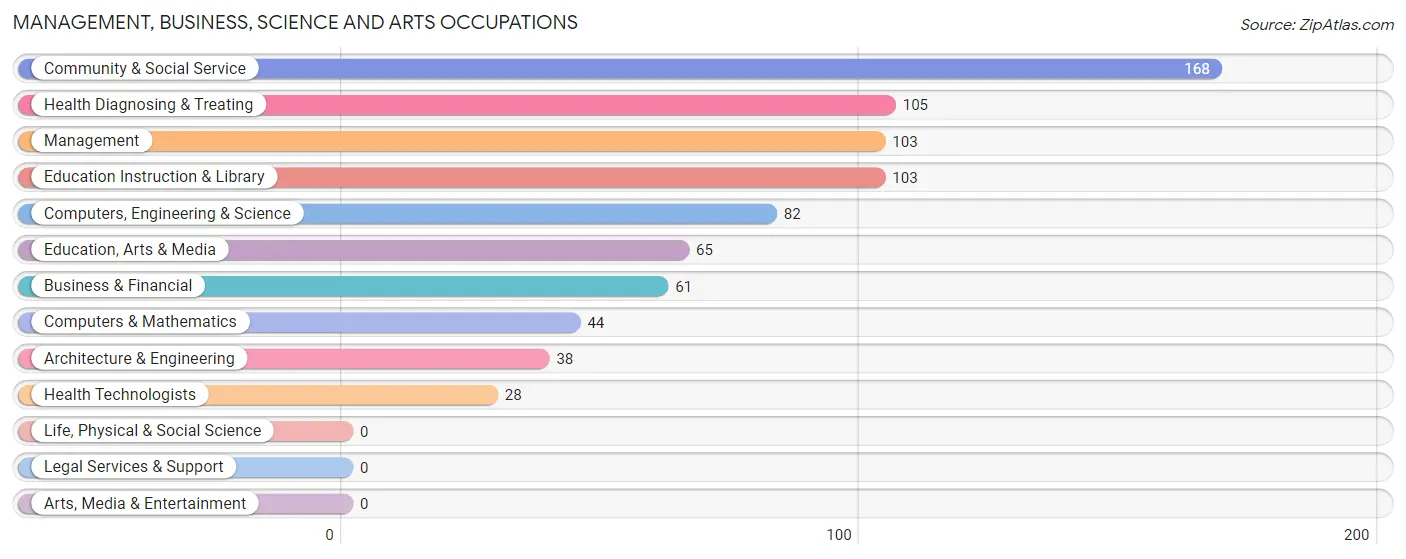
Management, Business, Science and Arts Occupations
The most common Management, Business, Science and Arts occupations in Livingston are Community & Social Service (168 | 9.2%), Health Diagnosing & Treating (105 | 5.8%), Management (103 | 5.7%), Education Instruction & Library (103 | 5.7%), and Computers, Engineering & Science (82 | 4.5%).
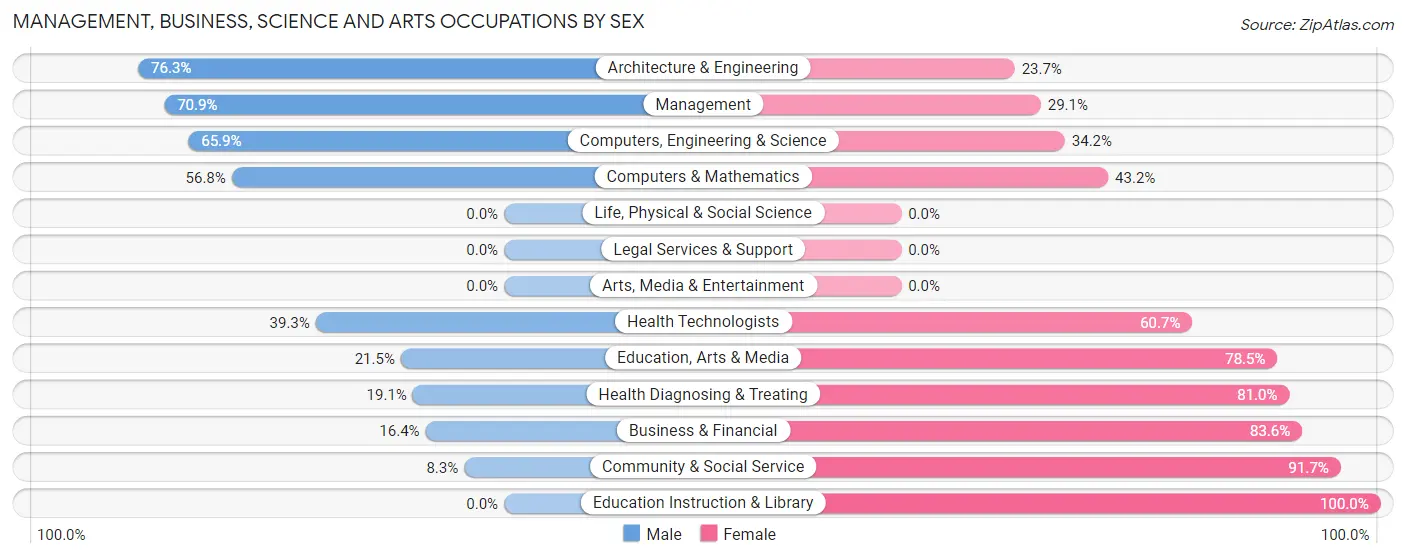
Management, Business, Science and Arts Occupations by Sex
Within the Management, Business, Science and Arts occupations in Livingston, the most male-oriented occupations are Architecture & Engineering (76.3%), Management (70.9%), and Computers, Engineering & Science (65.8%), while the most female-oriented occupations are Education Instruction & Library (100.0%), Community & Social Service (91.7%), and Business & Financial (83.6%).
| Occupation | Male | Female |
| Management | 73 (70.9%) | 30 (29.1%) |
| Business & Financial | 10 (16.4%) | 51 (83.6%) |
| Computers, Engineering & Science | 54 (65.8%) | 28 (34.2%) |
| Computers & Mathematics | 25 (56.8%) | 19 (43.2%) |
| Architecture & Engineering | 29 (76.3%) | 9 (23.7%) |
| Life, Physical & Social Science | 0 (0.0%) | 0 (0.0%) |
| Community & Social Service | 14 (8.3%) | 154 (91.7%) |
| Education, Arts & Media | 14 (21.5%) | 51 (78.5%) |
| Legal Services & Support | 0 (0.0%) | 0 (0.0%) |
| Education Instruction & Library | 0 (0.0%) | 103 (100.0%) |
| Arts, Media & Entertainment | 0 (0.0%) | 0 (0.0%) |
| Health Diagnosing & Treating | 20 (19.1%) | 85 (80.9%) |
| Health Technologists | 11 (39.3%) | 17 (60.7%) |
| Total (Category) | 171 (33.0%) | 348 (67.0%) |
| Total (Overall) | 926 (50.9%) | 892 (49.1%) |
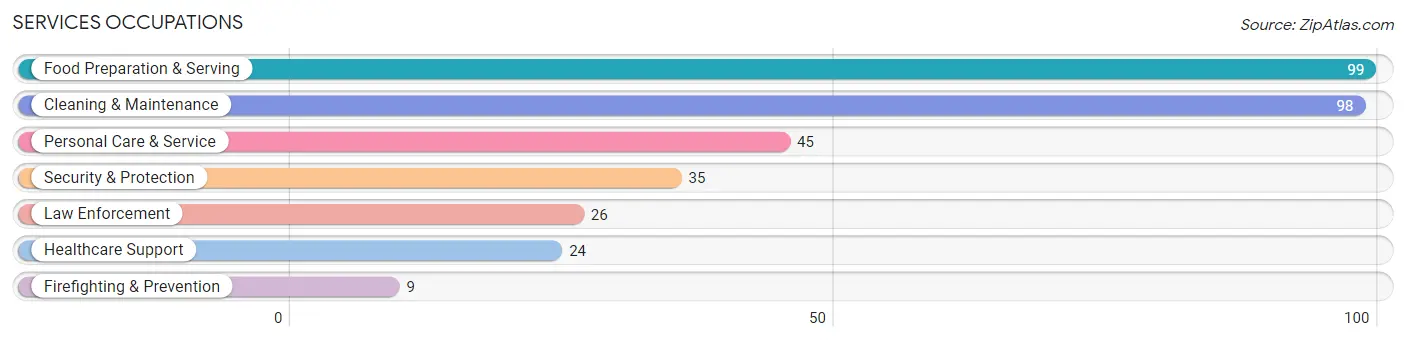
Services Occupations
The most common Services occupations in Livingston are Food Preparation & Serving (99 | 5.4%), Cleaning & Maintenance (98 | 5.4%), Personal Care & Service (45 | 2.5%), Security & Protection (35 | 1.9%), and Law Enforcement (26 | 1.4%).
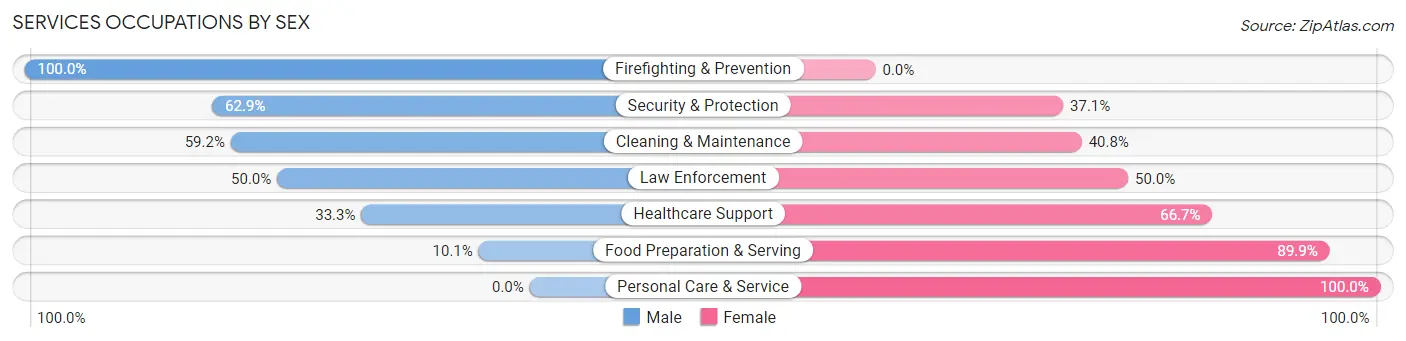
Services Occupations by Sex
Within the Services occupations in Livingston, the most male-oriented occupations are Firefighting & Prevention (100.0%), Security & Protection (62.9%), and Cleaning & Maintenance (59.2%), while the most female-oriented occupations are Personal Care & Service (100.0%), Food Preparation & Serving (89.9%), and Healthcare Support (66.7%).
| Occupation | Male | Female |
| Healthcare Support | 8 (33.3%) | 16 (66.7%) |
| Security & Protection | 22 (62.9%) | 13 (37.1%) |
| Firefighting & Prevention | 9 (100.0%) | 0 (0.0%) |
| Law Enforcement | 13 (50.0%) | 13 (50.0%) |
| Food Preparation & Serving | 10 (10.1%) | 89 (89.9%) |
| Cleaning & Maintenance | 58 (59.2%) | 40 (40.8%) |
| Personal Care & Service | 0 (0.0%) | 45 (100.0%) |
| Total (Category) | 98 (32.6%) | 203 (67.4%) |
| Total (Overall) | 926 (50.9%) | 892 (49.1%) |
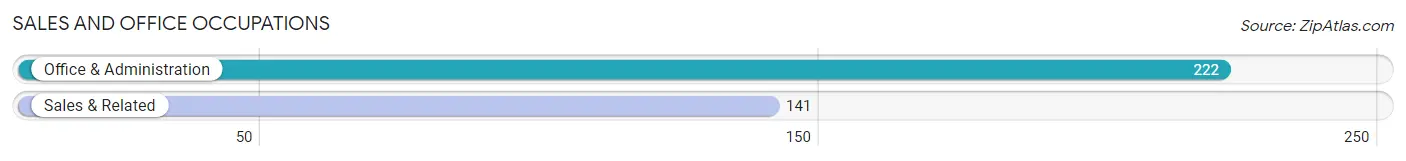
Sales and Office Occupations
The most common Sales and Office occupations in Livingston are Office & Administration (222 | 12.2%), and Sales & Related (141 | 7.8%).
Sales and Office Occupations by Sex
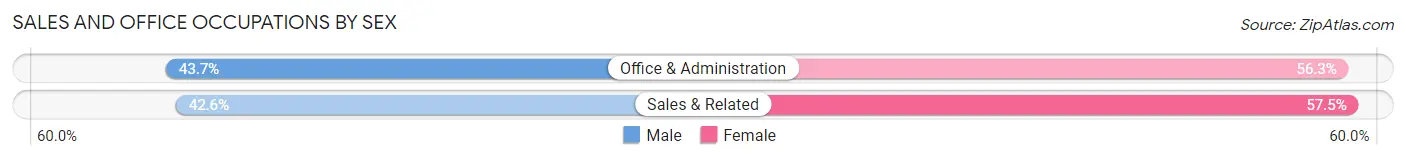
| Occupation | Male | Female |
| Sales & Related | 60 (42.5%) | 81 (57.5%) |
| Office & Administration | 97 (43.7%) | 125 (56.3%) |
| Total (Category) | 157 (43.2%) | 206 (56.8%) |
| Total (Overall) | 926 (50.9%) | 892 (49.1%) |
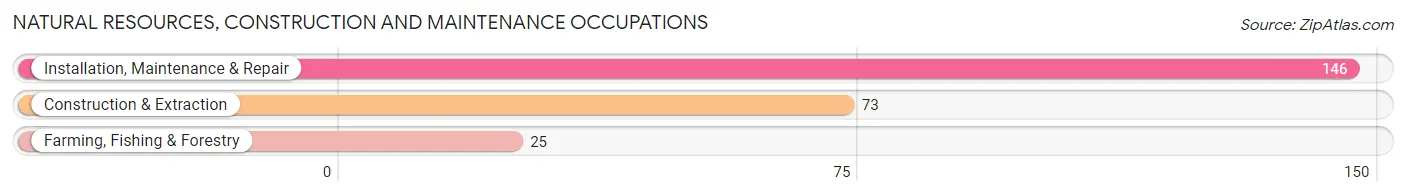
Natural Resources, Construction and Maintenance Occupations
The most common Natural Resources, Construction and Maintenance occupations in Livingston are Installation, Maintenance & Repair (146 | 8.0%), Construction & Extraction (73 | 4.0%), and Farming, Fishing & Forestry (25 | 1.4%).
Natural Resources, Construction and Maintenance Occupations by Sex
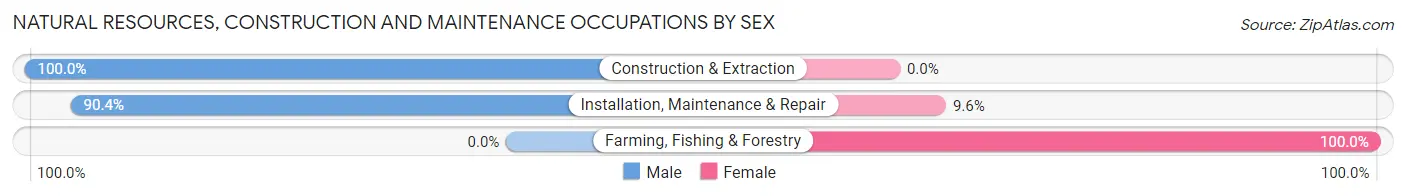
| Occupation | Male | Female |
| Farming, Fishing & Forestry | 0 (0.0%) | 25 (100.0%) |
| Construction & Extraction | 73 (100.0%) | 0 (0.0%) |
| Installation, Maintenance & Repair | 132 (90.4%) | 14 (9.6%) |
| Total (Category) | 205 (84.0%) | 39 (16.0%) |
| Total (Overall) | 926 (50.9%) | 892 (49.1%) |
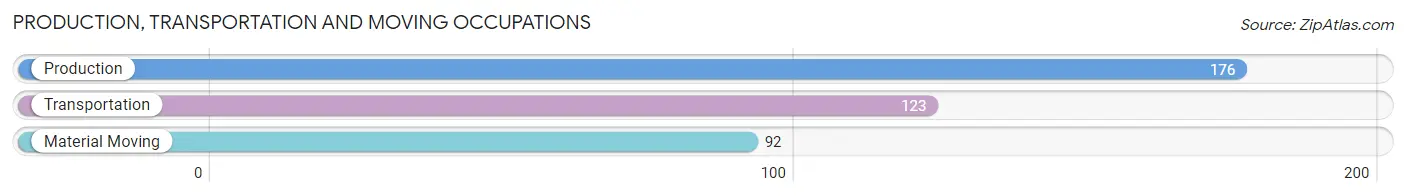
Production, Transportation and Moving Occupations
The most common Production, Transportation and Moving occupations in Livingston are Production (176 | 9.7%), Transportation (123 | 6.8%), and Material Moving (92 | 5.1%).
Production, Transportation and Moving Occupations by Sex
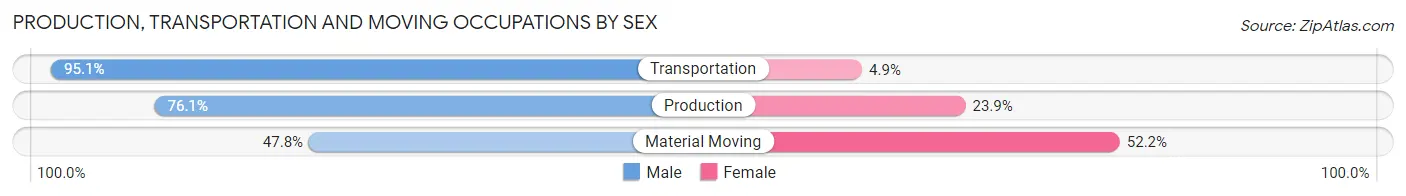
| Occupation | Male | Female |
| Production | 134 (76.1%) | 42 (23.9%) |
| Transportation | 117 (95.1%) | 6 (4.9%) |
| Material Moving | 44 (47.8%) | 48 (52.2%) |
| Total (Category) | 295 (75.4%) | 96 (24.5%) |
| Total (Overall) | 926 (50.9%) | 892 (49.1%) |
Employment Industries by Sex in Livingston
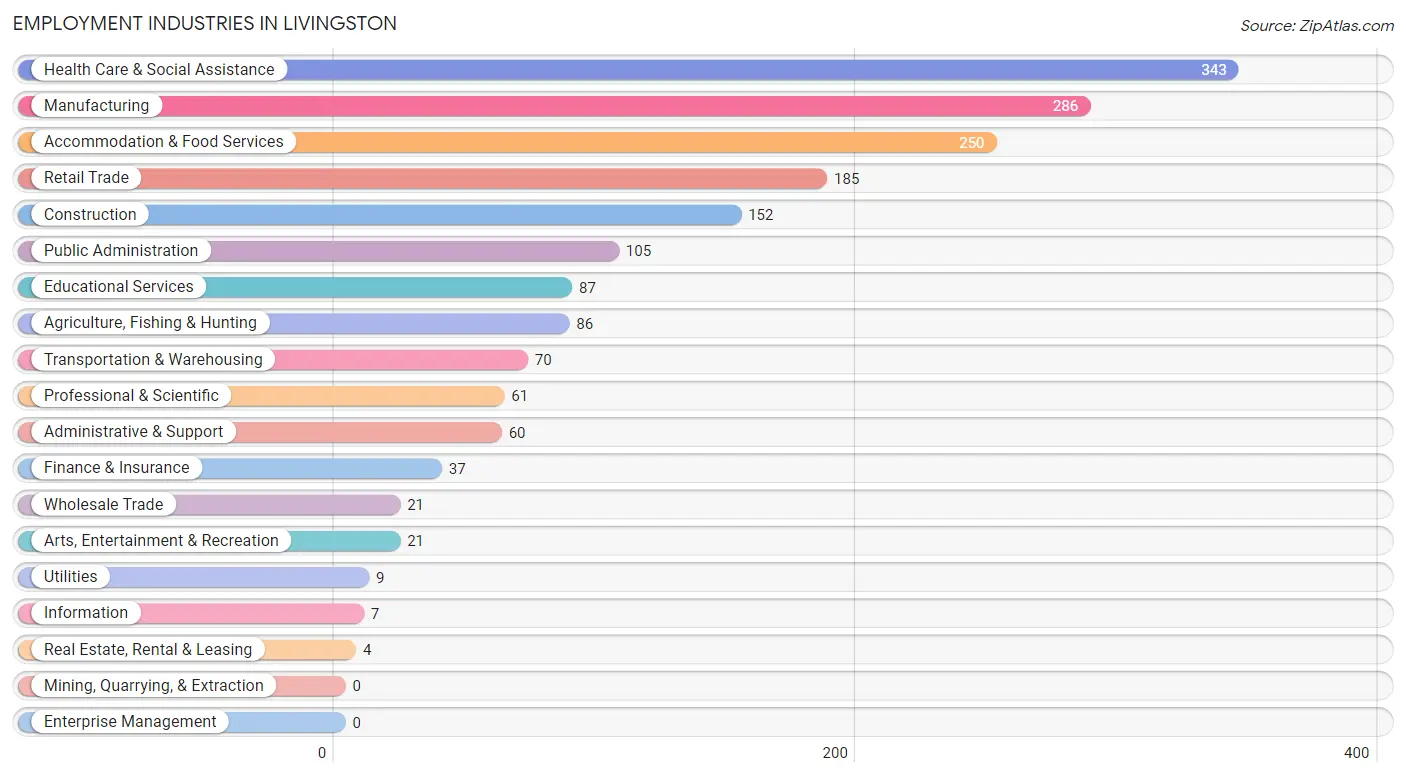
Employment Industries in Livingston
The major employment industries in Livingston include Health Care & Social Assistance (343 | 18.9%), Manufacturing (286 | 15.7%), Accommodation & Food Services (250 | 13.8%), Retail Trade (185 | 10.2%), and Construction (152 | 8.4%).
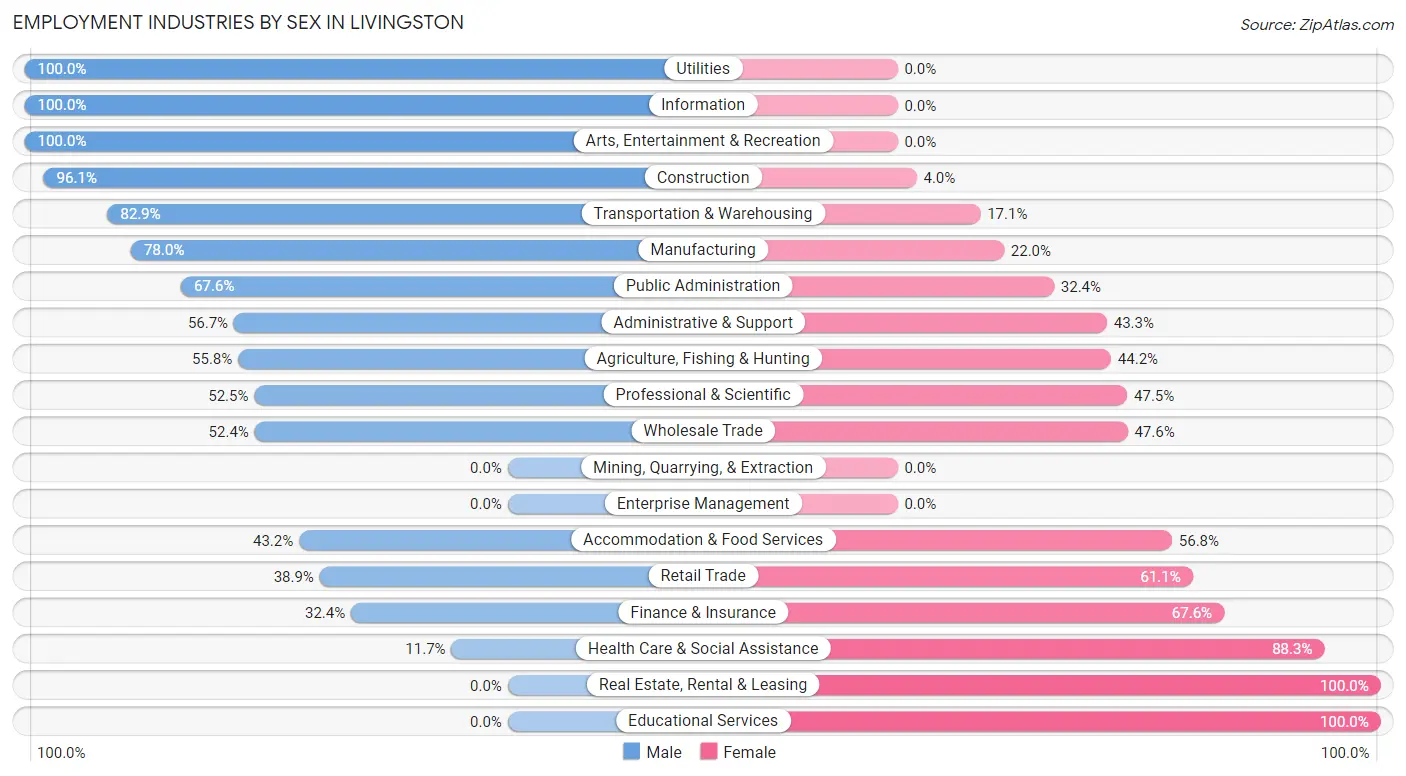
Employment Industries by Sex in Livingston
The Livingston industries that see more men than women are Utilities (100.0%), Information (100.0%), and Arts, Entertainment & Recreation (100.0%), whereas the industries that tend to have a higher number of women are Real Estate, Rental & Leasing (100.0%), Educational Services (100.0%), and Health Care & Social Assistance (88.3%).
| Industry | Male | Female |
| Agriculture, Fishing & Hunting | 48 (55.8%) | 38 (44.2%) |
| Mining, Quarrying, & Extraction | 0 (0.0%) | 0 (0.0%) |
| Construction | 146 (96.1%) | 6 (4.0%) |
| Manufacturing | 223 (78.0%) | 63 (22.0%) |
| Wholesale Trade | 11 (52.4%) | 10 (47.6%) |
| Retail Trade | 72 (38.9%) | 113 (61.1%) |
| Transportation & Warehousing | 58 (82.9%) | 12 (17.1%) |
| Utilities | 9 (100.0%) | 0 (0.0%) |
| Information | 7 (100.0%) | 0 (0.0%) |
| Finance & Insurance | 12 (32.4%) | 25 (67.6%) |
| Real Estate, Rental & Leasing | 0 (0.0%) | 4 (100.0%) |
| Professional & Scientific | 32 (52.5%) | 29 (47.5%) |
| Enterprise Management | 0 (0.0%) | 0 (0.0%) |
| Administrative & Support | 34 (56.7%) | 26 (43.3%) |
| Educational Services | 0 (0.0%) | 87 (100.0%) |
| Health Care & Social Assistance | 40 (11.7%) | 303 (88.3%) |
| Arts, Entertainment & Recreation | 21 (100.0%) | 0 (0.0%) |
| Accommodation & Food Services | 108 (43.2%) | 142 (56.8%) |
| Public Administration | 71 (67.6%) | 34 (32.4%) |
| Total | 926 (50.9%) | 892 (49.1%) |
Education in Livingston
School Enrollment in Livingston
The most common levels of schooling among the 707 students in Livingston are elementary school (193 | 27.3%), middle school (137 | 19.4%), and high school (132 | 18.7%).
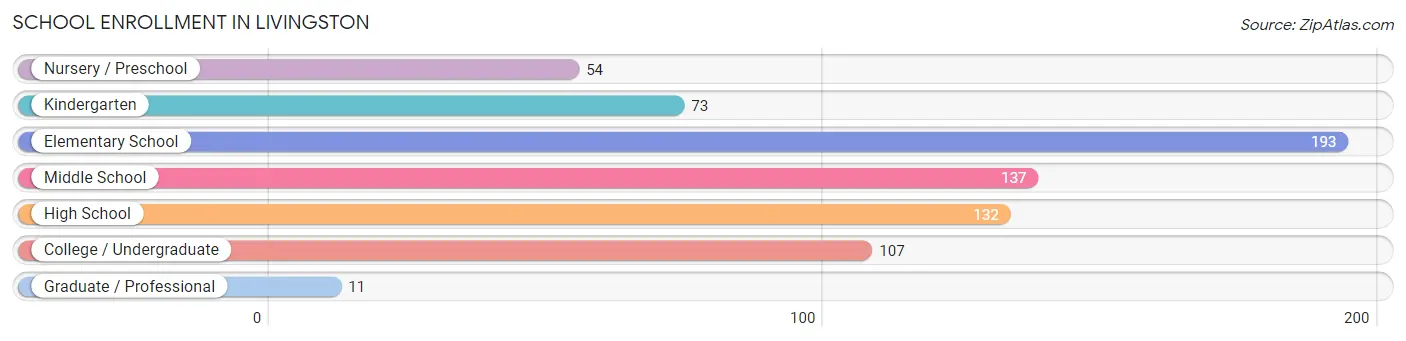
| School Level | # Students | % Students |
| Nursery / Preschool | 54 | 7.6% |
| Kindergarten | 73 | 10.3% |
| Elementary School | 193 | 27.3% |
| Middle School | 137 | 19.4% |
| High School | 132 | 18.7% |
| College / Undergraduate | 107 | 15.1% |
| Graduate / Professional | 11 | 1.6% |
| Total | 707 | 100.0% |
School Enrollment by Age by Funding Source in Livingston
Out of a total of 707 students who are enrolled in schools in Livingston, 12 (1.7%) attend a private institution, while the remaining 695 (98.3%) are enrolled in public schools. The age group of 25 to 34 year olds has the highest likelihood of being enrolled in private schools, with 6 (46.2% in the age bracket) enrolled. Conversely, the age group of 3 to 4 year olds has the lowest likelihood of being enrolled in a private school, with 36 (100.0% in the age bracket) attending a public institution.
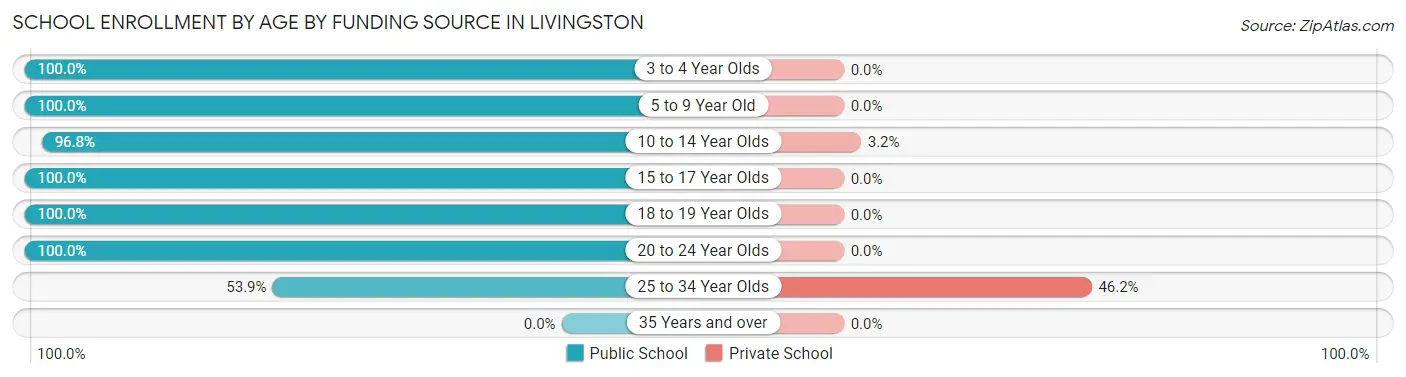
| Age Bracket | Public School | Private School |
| 3 to 4 Year Olds | 36 (100.0%) | 0 (0.0%) |
| 5 to 9 Year Old | 247 (100.0%) | 0 (0.0%) |
| 10 to 14 Year Olds | 182 (96.8%) | 6 (3.2%) |
| 15 to 17 Year Olds | 95 (100.0%) | 0 (0.0%) |
| 18 to 19 Year Olds | 30 (100.0%) | 0 (0.0%) |
| 20 to 24 Year Olds | 98 (100.0%) | 0 (0.0%) |
| 25 to 34 Year Olds | 7 (53.8%) | 6 (46.2%) |
| 35 Years and over | 0 (0.0%) | 0 (0.0%) |
| Total | 695 (98.3%) | 12 (1.7%) |
Educational Attainment by Field of Study in Livingston
Education (63 | 22.7%), psychology (53 | 19.1%), liberal arts & history (33 | 11.9%), multidisciplinary studies (20 | 7.2%), and physical & health sciences (19 | 6.9%) are the most common fields of study among 277 individuals in Livingston who have obtained a bachelor's degree or higher.
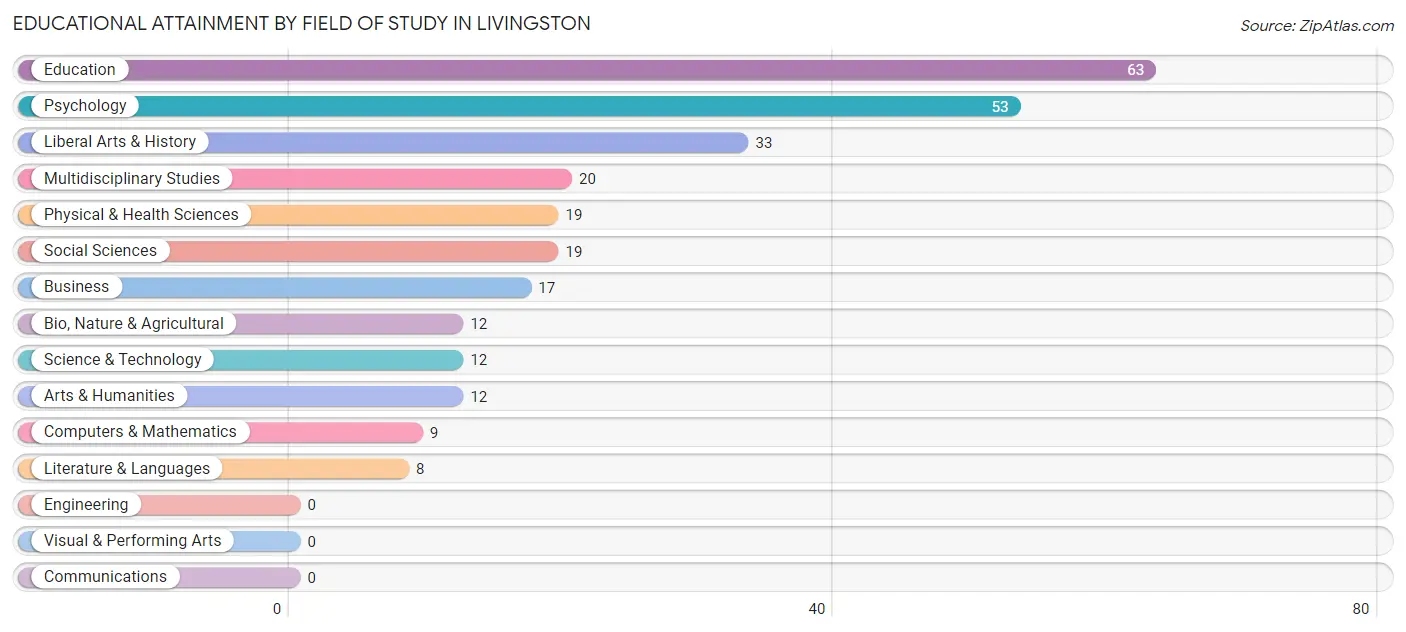
| Field of Study | # Graduates | % Graduates |
| Computers & Mathematics | 9 | 3.3% |
| Bio, Nature & Agricultural | 12 | 4.3% |
| Physical & Health Sciences | 19 | 6.9% |
| Psychology | 53 | 19.1% |
| Social Sciences | 19 | 6.9% |
| Engineering | 0 | 0.0% |
| Multidisciplinary Studies | 20 | 7.2% |
| Science & Technology | 12 | 4.3% |
| Business | 17 | 6.1% |
| Education | 63 | 22.7% |
| Literature & Languages | 8 | 2.9% |
| Liberal Arts & History | 33 | 11.9% |
| Visual & Performing Arts | 0 | 0.0% |
| Communications | 0 | 0.0% |
| Arts & Humanities | 12 | 4.3% |
| Total | 277 | 100.0% |
Transportation & Commute in Livingston
Vehicle Availability by Sex in Livingston
The most prevalent vehicle ownership categories in Livingston are males with 3 vehicles (272, accounting for 29.6%) and females with 3 vehicles (241, making up 30.9%).
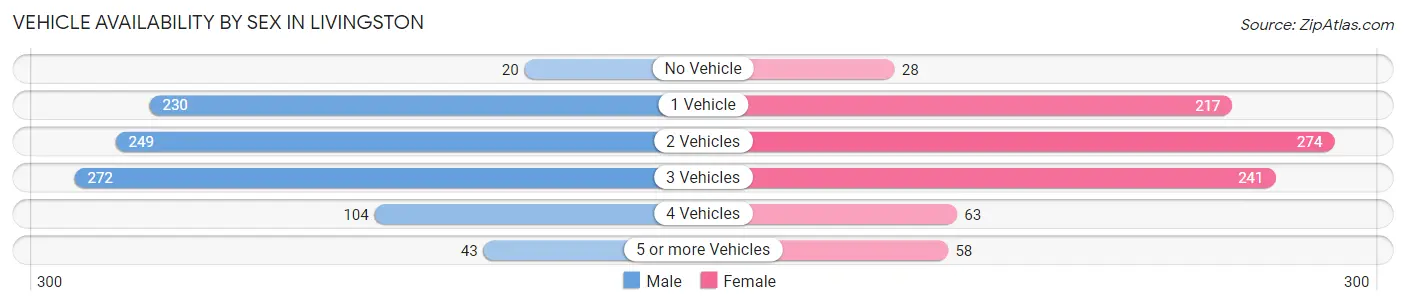
| Vehicles Available | Male | Female |
| No Vehicle | 20 (2.2%) | 28 (3.2%) |
| 1 Vehicle | 230 (25.1%) | 217 (24.6%) |
| 2 Vehicles | 249 (27.1%) | 274 (31.1%) |
| 3 Vehicles | 272 (29.6%) | 241 (27.4%) |
| 4 Vehicles | 104 (11.3%) | 63 (7.1%) |
| 5 or more Vehicles | 43 (4.7%) | 58 (6.6%) |
| Total | 918 (100.0%) | 881 (100.0%) |
Commute Time in Livingston
The most frequently occuring commute durations in Livingston are 5 to 9 minutes (429 commuters, 24.8%), 20 to 24 minutes (229 commuters, 13.2%), and 30 to 34 minutes (219 commuters, 12.7%).
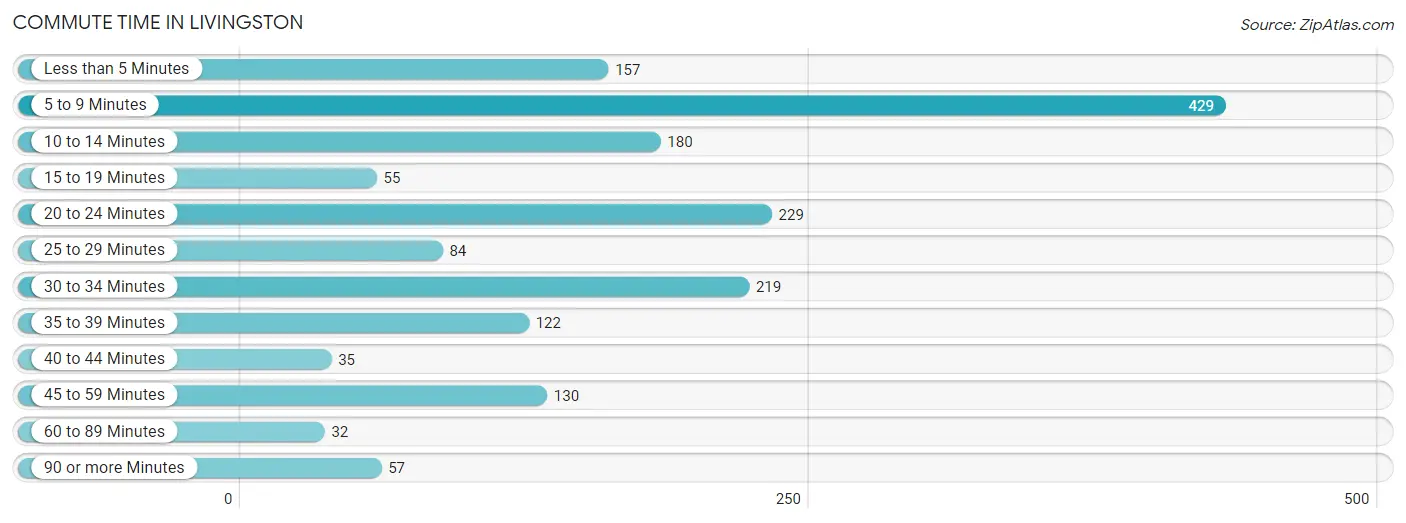
| Commute Time | # Commuters | % Commuters |
| Less than 5 Minutes | 157 | 9.1% |
| 5 to 9 Minutes | 429 | 24.8% |
| 10 to 14 Minutes | 180 | 10.4% |
| 15 to 19 Minutes | 55 | 3.2% |
| 20 to 24 Minutes | 229 | 13.2% |
| 25 to 29 Minutes | 84 | 4.9% |
| 30 to 34 Minutes | 219 | 12.7% |
| 35 to 39 Minutes | 122 | 7.1% |
| 40 to 44 Minutes | 35 | 2.0% |
| 45 to 59 Minutes | 130 | 7.5% |
| 60 to 89 Minutes | 32 | 1.8% |
| 90 or more Minutes | 57 | 3.3% |
Commute Time by Sex in Livingston
The most common commute times in Livingston are 5 to 9 minutes (242 commuters, 27.3%) for males and 5 to 9 minutes (187 commuters, 22.2%) for females.
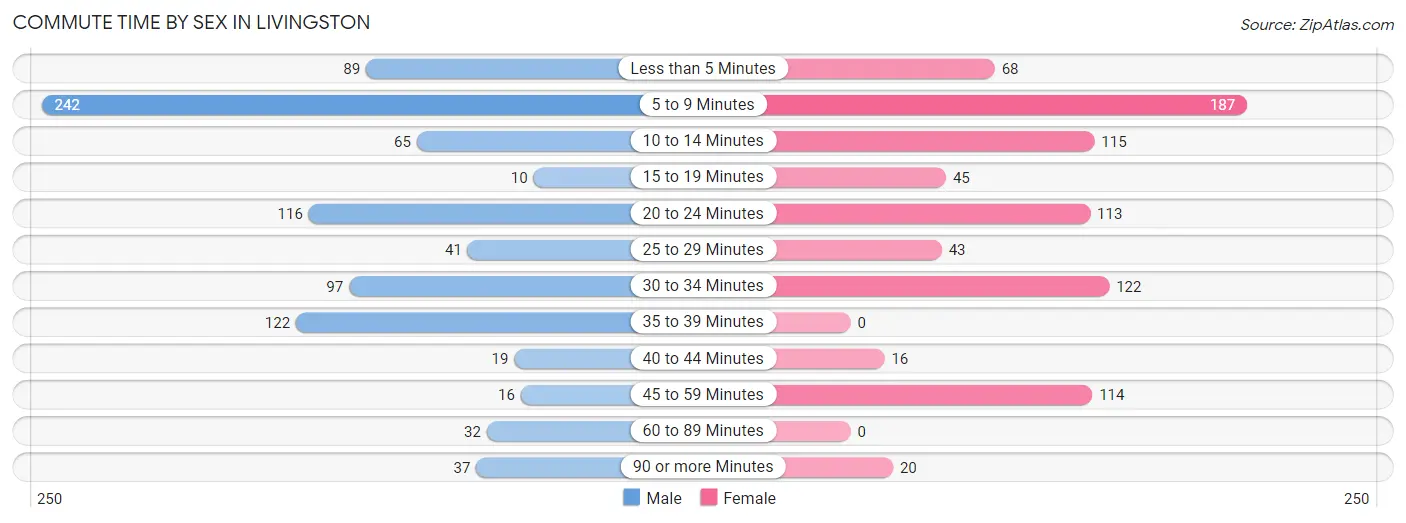
| Commute Time | Male | Female |
| Less than 5 Minutes | 89 (10.1%) | 68 (8.1%) |
| 5 to 9 Minutes | 242 (27.3%) | 187 (22.2%) |
| 10 to 14 Minutes | 65 (7.3%) | 115 (13.6%) |
| 15 to 19 Minutes | 10 (1.1%) | 45 (5.3%) |
| 20 to 24 Minutes | 116 (13.1%) | 113 (13.4%) |
| 25 to 29 Minutes | 41 (4.6%) | 43 (5.1%) |
| 30 to 34 Minutes | 97 (11.0%) | 122 (14.5%) |
| 35 to 39 Minutes | 122 (13.8%) | 0 (0.0%) |
| 40 to 44 Minutes | 19 (2.1%) | 16 (1.9%) |
| 45 to 59 Minutes | 16 (1.8%) | 114 (13.5%) |
| 60 to 89 Minutes | 32 (3.6%) | 0 (0.0%) |
| 90 or more Minutes | 37 (4.2%) | 20 (2.4%) |
Time of Departure to Work by Sex in Livingston
The most frequent times of departure to work in Livingston are 6:30 AM to 6:59 AM (172, 19.4%) for males and 7:00 AM to 7:29 AM (267, 31.7%) for females.
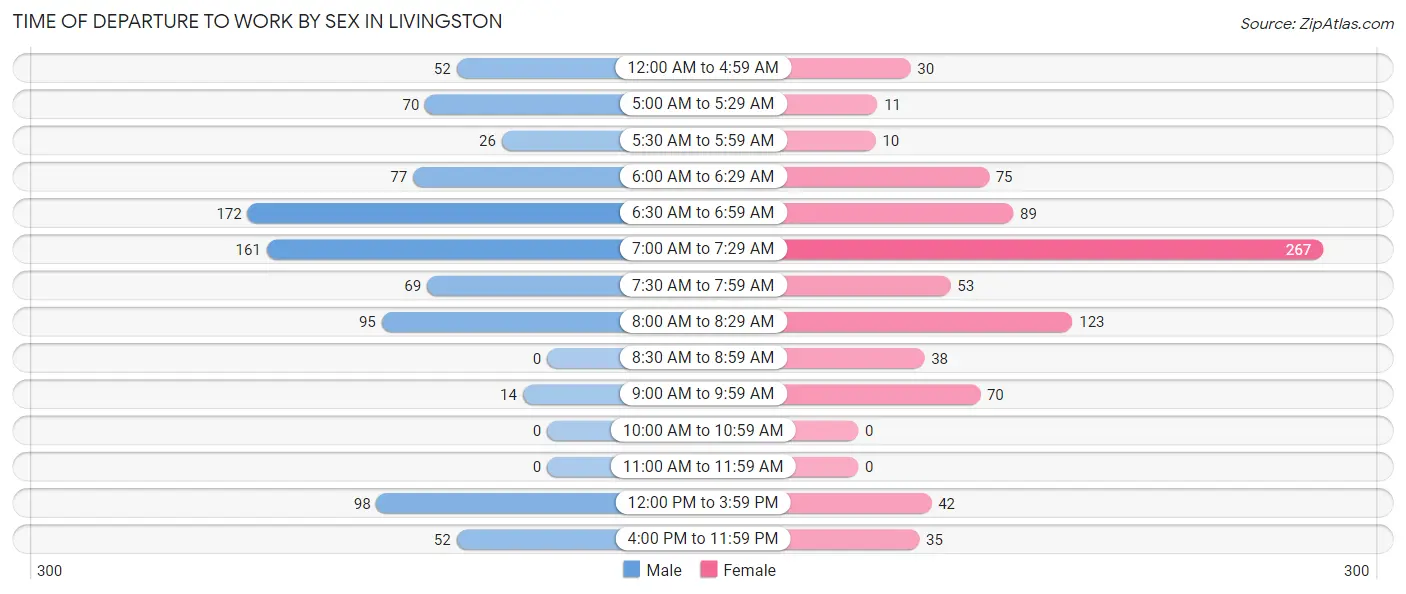
| Time of Departure | Male | Female |
| 12:00 AM to 4:59 AM | 52 (5.9%) | 30 (3.6%) |
| 5:00 AM to 5:29 AM | 70 (7.9%) | 11 (1.3%) |
| 5:30 AM to 5:59 AM | 26 (2.9%) | 10 (1.2%) |
| 6:00 AM to 6:29 AM | 77 (8.7%) | 75 (8.9%) |
| 6:30 AM to 6:59 AM | 172 (19.4%) | 89 (10.6%) |
| 7:00 AM to 7:29 AM | 161 (18.2%) | 267 (31.7%) |
| 7:30 AM to 7:59 AM | 69 (7.8%) | 53 (6.3%) |
| 8:00 AM to 8:29 AM | 95 (10.7%) | 123 (14.6%) |
| 8:30 AM to 8:59 AM | 0 (0.0%) | 38 (4.5%) |
| 9:00 AM to 9:59 AM | 14 (1.6%) | 70 (8.3%) |
| 10:00 AM to 10:59 AM | 0 (0.0%) | 0 (0.0%) |
| 11:00 AM to 11:59 AM | 0 (0.0%) | 0 (0.0%) |
| 12:00 PM to 3:59 PM | 98 (11.1%) | 42 (5.0%) |
| 4:00 PM to 11:59 PM | 52 (5.9%) | 35 (4.2%) |
| Total | 886 (100.0%) | 843 (100.0%) |
Housing Occupancy in Livingston
Occupancy by Ownership in Livingston
Of the total 1,534 dwellings in Livingston, owner-occupied units account for 915 (59.7%), while renter-occupied units make up 619 (40.4%).
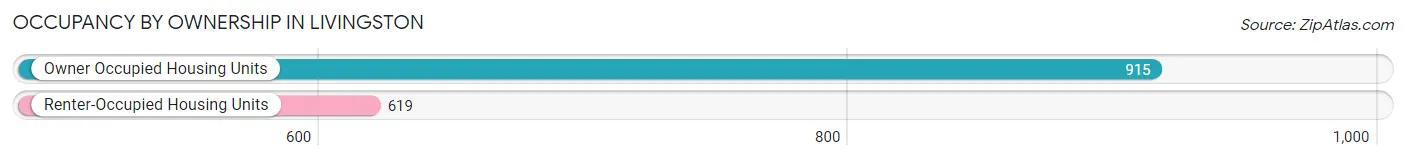
| Occupancy | # Housing Units | % Housing Units |
| Owner Occupied Housing Units | 915 | 59.7% |
| Renter-Occupied Housing Units | 619 | 40.4% |
| Total Occupied Housing Units | 1,534 | 100.0% |
Occupancy by Household Size in Livingston
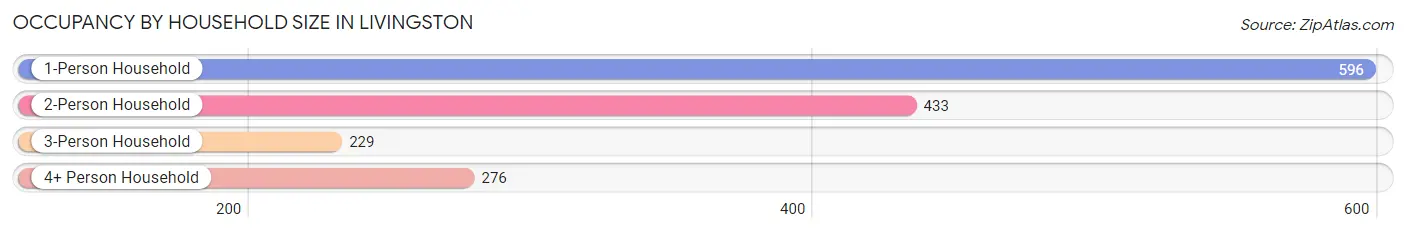
| Household Size | # Housing Units | % Housing Units |
| 1-Person Household | 596 | 38.9% |
| 2-Person Household | 433 | 28.2% |
| 3-Person Household | 229 | 14.9% |
| 4+ Person Household | 276 | 18.0% |
| Total Housing Units | 1,534 | 100.0% |
Occupancy by Ownership by Household Size in Livingston

| Household Size | Owner-occupied | Renter-occupied |
| 1-Person Household | 376 (63.1%) | 220 (36.9%) |
| 2-Person Household | 293 (67.7%) | 140 (32.3%) |
| 3-Person Household | 106 (46.3%) | 123 (53.7%) |
| 4+ Person Household | 140 (50.7%) | 136 (49.3%) |
| Total Housing Units | 915 (59.7%) | 619 (40.4%) |
Occupancy by Educational Attainment in Livingston
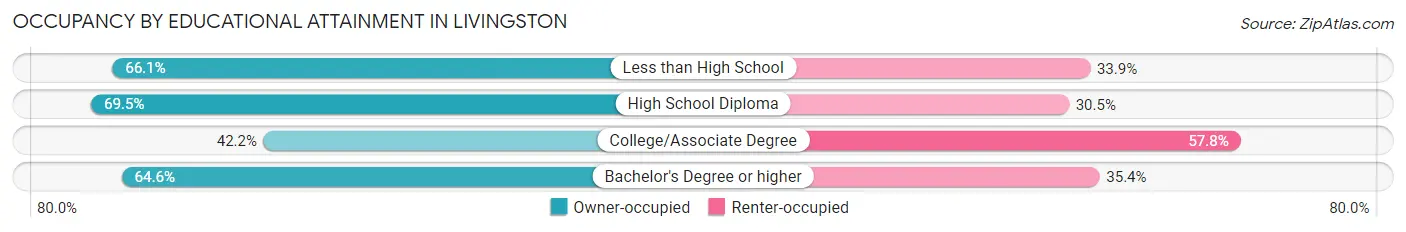
| Household Size | Owner-occupied | Renter-occupied |
| Less than High School | 154 (66.1%) | 79 (33.9%) |
| High School Diploma | 448 (69.5%) | 197 (30.5%) |
| College/Associate Degree | 209 (42.2%) | 286 (57.8%) |
| Bachelor's Degree or higher | 104 (64.6%) | 57 (35.4%) |
Occupancy by Age of Householder in Livingston
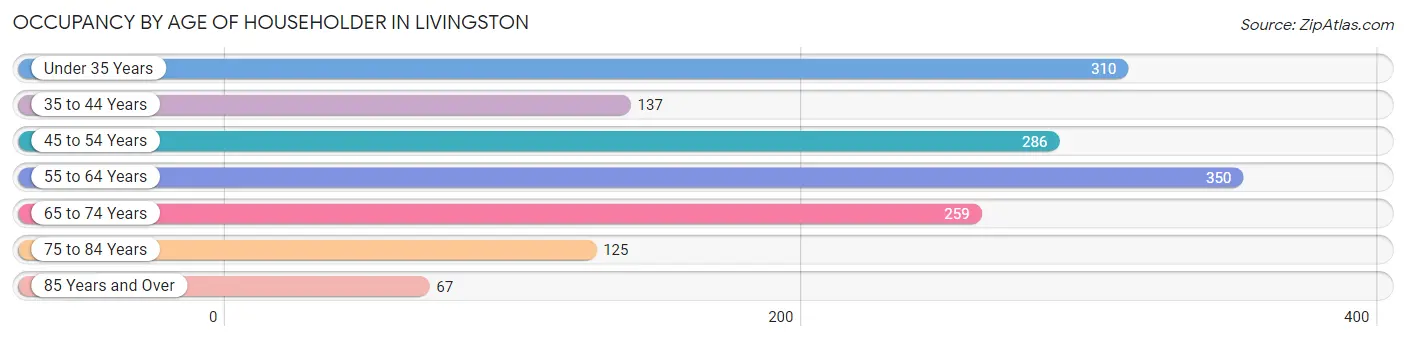
| Age Bracket | # Households | % Households |
| Under 35 Years | 310 | 20.2% |
| 35 to 44 Years | 137 | 8.9% |
| 45 to 54 Years | 286 | 18.6% |
| 55 to 64 Years | 350 | 22.8% |
| 65 to 74 Years | 259 | 16.9% |
| 75 to 84 Years | 125 | 8.2% |
| 85 Years and Over | 67 | 4.4% |
| Total | 1,534 | 100.0% |
Housing Finances in Livingston
Median Income by Occupancy in Livingston
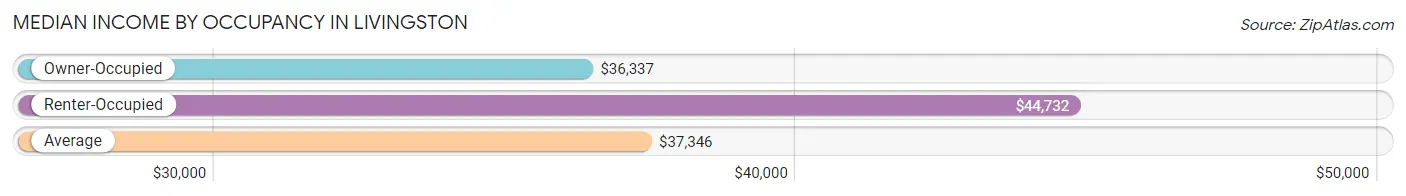
| Occupancy Type | # Households | Median Income |
| Owner-Occupied | 915 (59.7%) | $36,337 |
| Renter-Occupied | 619 (40.4%) | $44,732 |
| Average | 1,534 (100.0%) | $37,346 |
Occupancy by Householder Income Bracket in Livingston
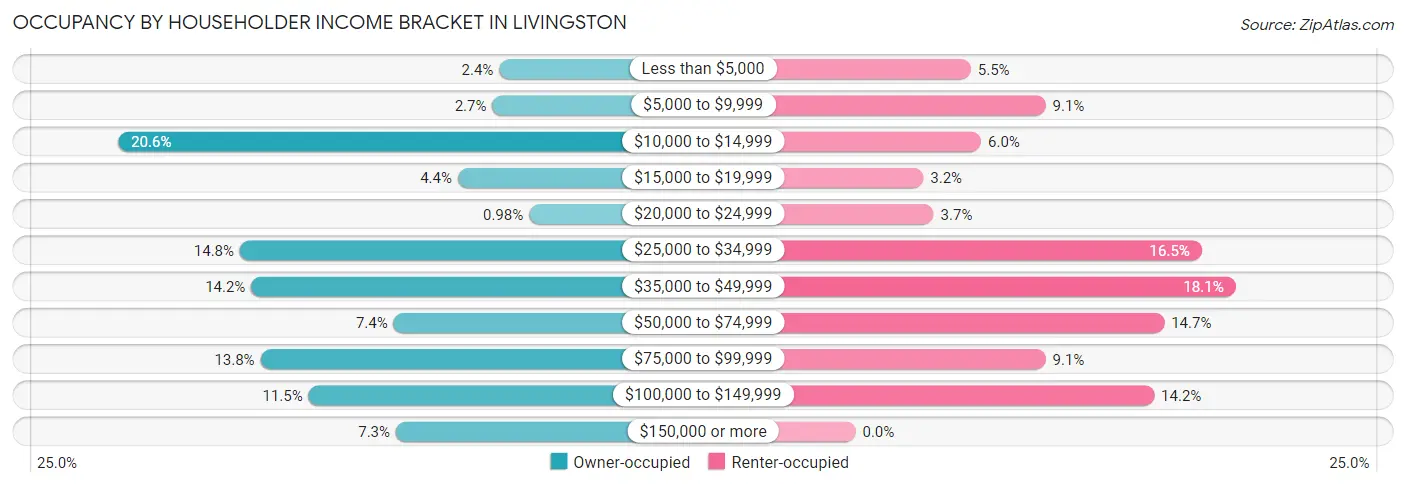
| Income Bracket | Owner-occupied | Renter-occupied |
| Less than $5,000 | 22 (2.4%) | 34 (5.5%) |
| $5,000 to $9,999 | 25 (2.7%) | 56 (9.0%) |
| $10,000 to $14,999 | 188 (20.5%) | 37 (6.0%) |
| $15,000 to $19,999 | 40 (4.4%) | 20 (3.2%) |
| $20,000 to $24,999 | 9 (1.0%) | 23 (3.7%) |
| $25,000 to $34,999 | 135 (14.7%) | 102 (16.5%) |
| $35,000 to $49,999 | 130 (14.2%) | 112 (18.1%) |
| $50,000 to $74,999 | 68 (7.4%) | 91 (14.7%) |
| $75,000 to $99,999 | 126 (13.8%) | 56 (9.0%) |
| $100,000 to $149,999 | 105 (11.5%) | 88 (14.2%) |
| $150,000 or more | 67 (7.3%) | 0 (0.0%) |
| Total | 915 (100.0%) | 619 (100.0%) |
Monthly Housing Cost Tiers in Livingston
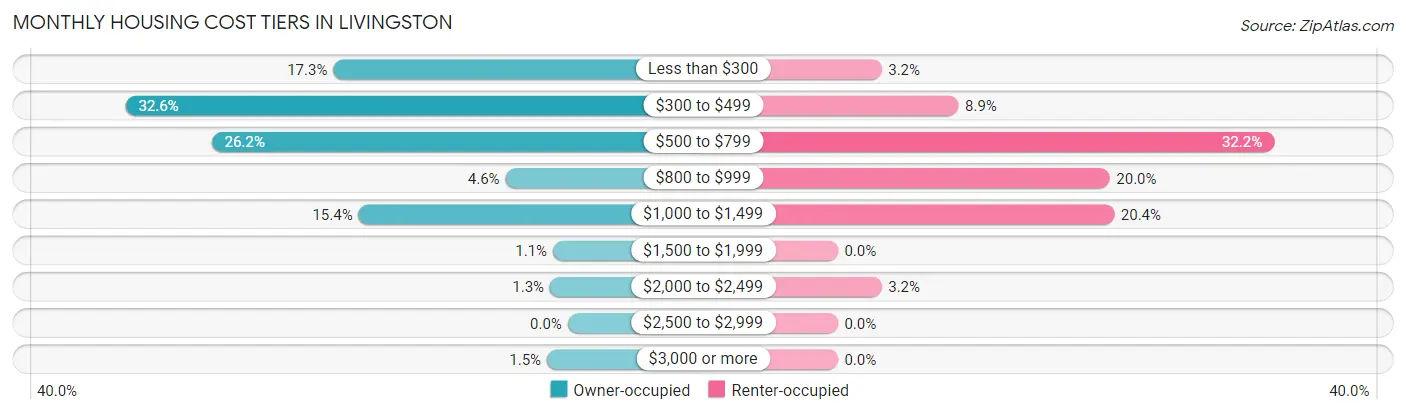
| Monthly Cost | Owner-occupied | Renter-occupied |
| Less than $300 | 158 (17.3%) | 20 (3.2%) |
| $300 to $499 | 298 (32.6%) | 55 (8.9%) |
| $500 to $799 | 240 (26.2%) | 199 (32.2%) |
| $800 to $999 | 42 (4.6%) | 124 (20.0%) |
| $1,000 to $1,499 | 141 (15.4%) | 126 (20.4%) |
| $1,500 to $1,999 | 10 (1.1%) | 0 (0.0%) |
| $2,000 to $2,499 | 12 (1.3%) | 20 (3.2%) |
| $2,500 to $2,999 | 0 (0.0%) | 0 (0.0%) |
| $3,000 or more | 14 (1.5%) | 0 (0.0%) |
| Total | 915 (100.0%) | 619 (100.0%) |
Physical Housing Characteristics in Livingston
Housing Structures in Livingston
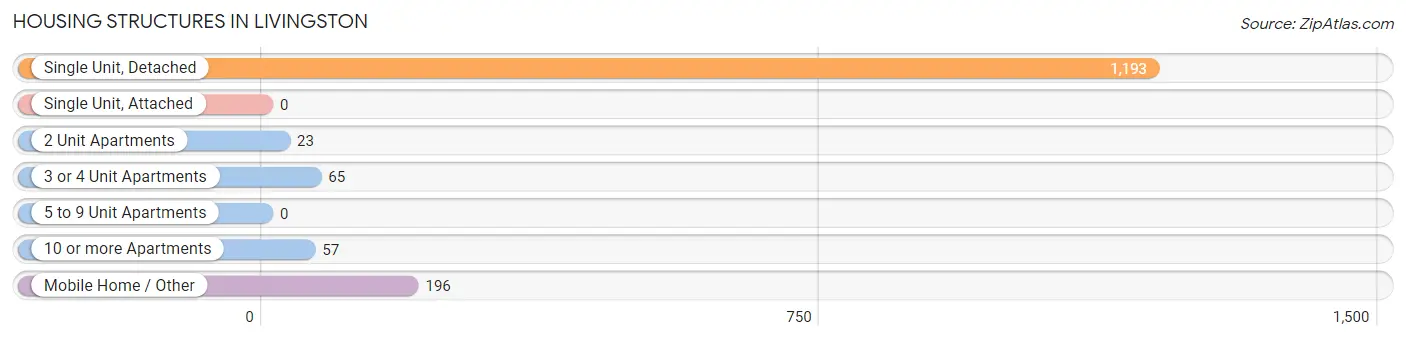
| Structure Type | # Housing Units | % Housing Units |
| Single Unit, Detached | 1,193 | 77.8% |
| Single Unit, Attached | 0 | 0.0% |
| 2 Unit Apartments | 23 | 1.5% |
| 3 or 4 Unit Apartments | 65 | 4.2% |
| 5 to 9 Unit Apartments | 0 | 0.0% |
| 10 or more Apartments | 57 | 3.7% |
| Mobile Home / Other | 196 | 12.8% |
| Total | 1,534 | 100.0% |
Housing Structures by Occupancy in Livingston
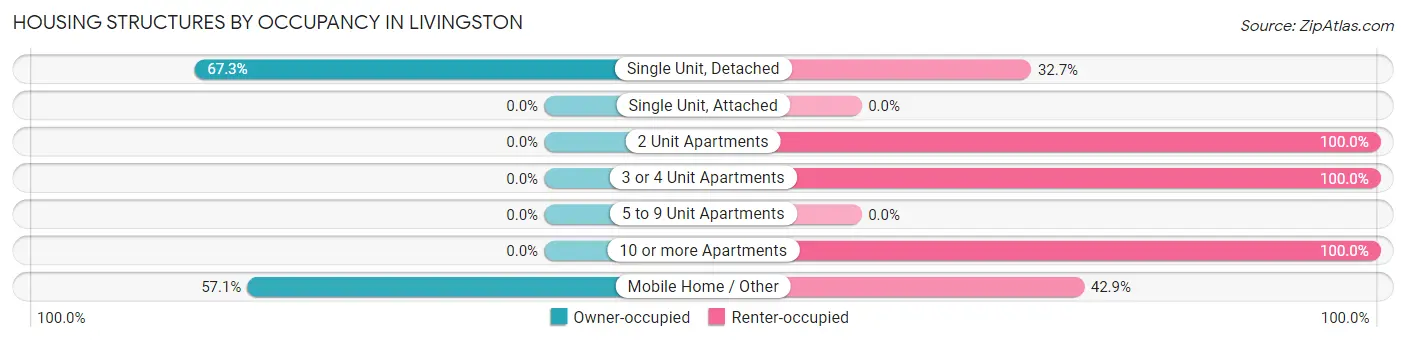
| Structure Type | Owner-occupied | Renter-occupied |
| Single Unit, Detached | 803 (67.3%) | 390 (32.7%) |
| Single Unit, Attached | 0 (0.0%) | 0 (0.0%) |
| 2 Unit Apartments | 0 (0.0%) | 23 (100.0%) |
| 3 or 4 Unit Apartments | 0 (0.0%) | 65 (100.0%) |
| 5 to 9 Unit Apartments | 0 (0.0%) | 0 (0.0%) |
| 10 or more Apartments | 0 (0.0%) | 57 (100.0%) |
| Mobile Home / Other | 112 (57.1%) | 84 (42.9%) |
| Total | 915 (59.7%) | 619 (40.4%) |
Housing Structures by Number of Rooms in Livingston
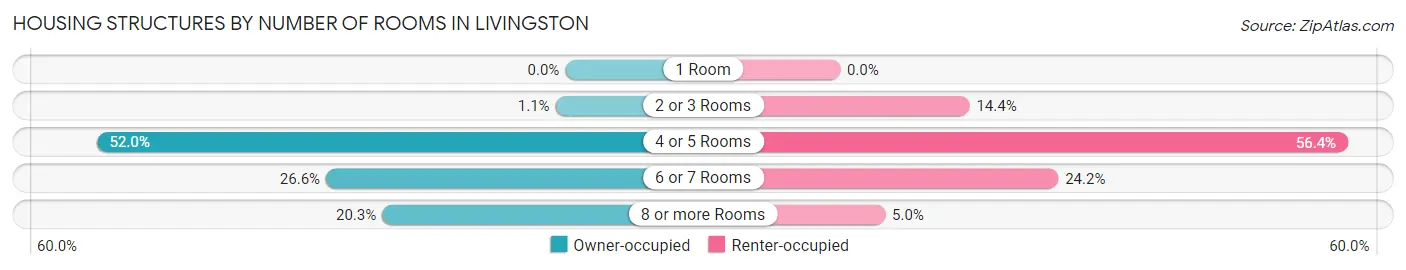
| Number of Rooms | Owner-occupied | Renter-occupied |
| 1 Room | 0 (0.0%) | 0 (0.0%) |
| 2 or 3 Rooms | 10 (1.1%) | 89 (14.4%) |
| 4 or 5 Rooms | 476 (52.0%) | 349 (56.4%) |
| 6 or 7 Rooms | 243 (26.6%) | 150 (24.2%) |
| 8 or more Rooms | 186 (20.3%) | 31 (5.0%) |
| Total | 915 (100.0%) | 619 (100.0%) |
Housing Structure by Heating Type in Livingston
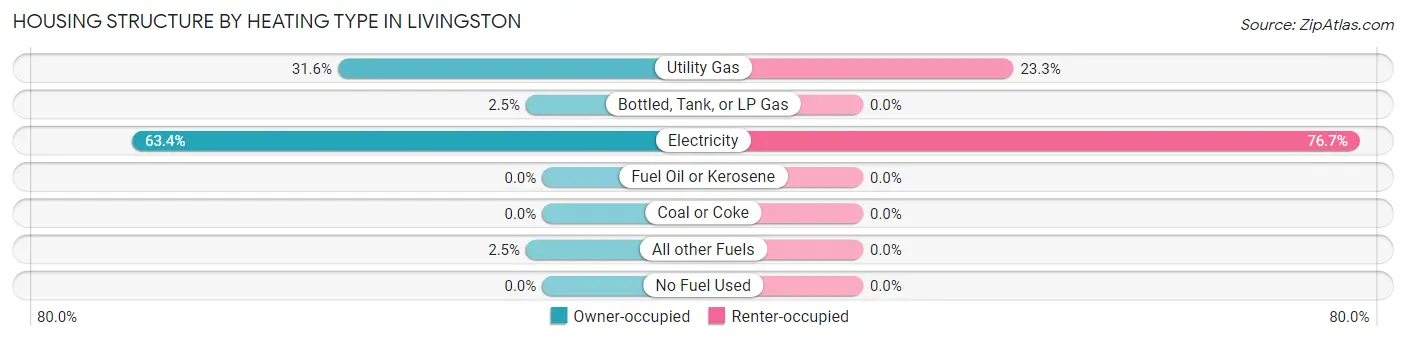
| Heating Type | Owner-occupied | Renter-occupied |
| Utility Gas | 289 (31.6%) | 144 (23.3%) |
| Bottled, Tank, or LP Gas | 23 (2.5%) | 0 (0.0%) |
| Electricity | 580 (63.4%) | 475 (76.7%) |
| Fuel Oil or Kerosene | 0 (0.0%) | 0 (0.0%) |
| Coal or Coke | 0 (0.0%) | 0 (0.0%) |
| All other Fuels | 23 (2.5%) | 0 (0.0%) |
| No Fuel Used | 0 (0.0%) | 0 (0.0%) |
| Total | 915 (100.0%) | 619 (100.0%) |
Household Vehicle Usage in Livingston
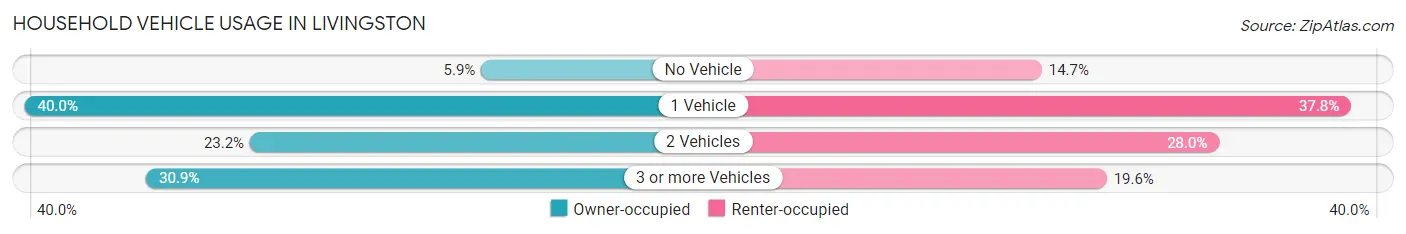
| Vehicles per Household | Owner-occupied | Renter-occupied |
| No Vehicle | 54 (5.9%) | 91 (14.7%) |
| 1 Vehicle | 366 (40.0%) | 234 (37.8%) |
| 2 Vehicles | 212 (23.2%) | 173 (28.0%) |
| 3 or more Vehicles | 283 (30.9%) | 121 (19.6%) |
| Total | 915 (100.0%) | 619 (100.0%) |
Real Estate & Mortgages in Livingston
Real Estate and Mortgage Overview in Livingston
| Characteristic | Without Mortgage | With Mortgage |
| Housing Units | 544 | 371 |
| Median Property Value | $122,600 | $110,500 |
| Median Household Income | $37,895 | $0 |
| Monthly Housing Costs | $351 | $14 |
| Real Estate Taxes | $970 | $77 |
Property Value by Mortgage Status in Livingston
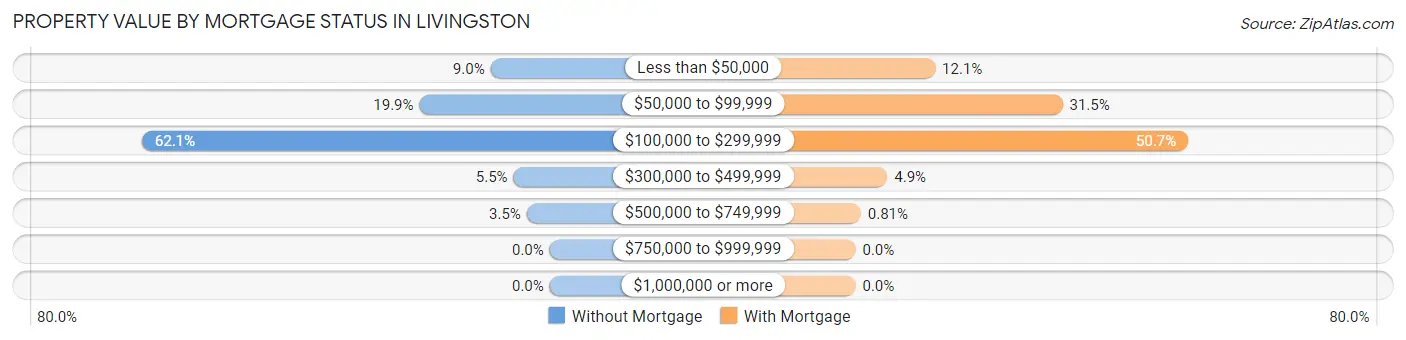
| Property Value | Without Mortgage | With Mortgage |
| Less than $50,000 | 49 (9.0%) | 45 (12.1%) |
| $50,000 to $99,999 | 108 (19.9%) | 117 (31.5%) |
| $100,000 to $299,999 | 338 (62.1%) | 188 (50.7%) |
| $300,000 to $499,999 | 30 (5.5%) | 18 (4.9%) |
| $500,000 to $749,999 | 19 (3.5%) | 3 (0.8%) |
| $750,000 to $999,999 | 0 (0.0%) | 0 (0.0%) |
| $1,000,000 or more | 0 (0.0%) | 0 (0.0%) |
| Total | 544 (100.0%) | 371 (100.0%) |
Household Income by Mortgage Status in Livingston
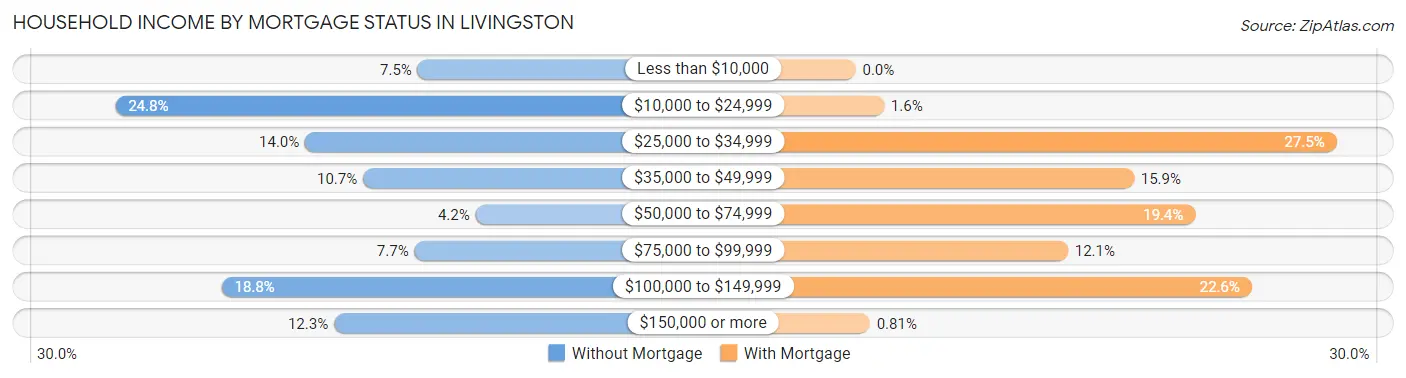
| Household Income | Without Mortgage | With Mortgage |
| Less than $10,000 | 41 (7.5%) | 0 (0.0%) |
| $10,000 to $24,999 | 135 (24.8%) | 6 (1.6%) |
| $25,000 to $34,999 | 76 (14.0%) | 102 (27.5%) |
| $35,000 to $49,999 | 58 (10.7%) | 59 (15.9%) |
| $50,000 to $74,999 | 23 (4.2%) | 72 (19.4%) |
| $75,000 to $99,999 | 42 (7.7%) | 45 (12.1%) |
| $100,000 to $149,999 | 102 (18.8%) | 84 (22.6%) |
| $150,000 or more | 67 (12.3%) | 3 (0.8%) |
| Total | 544 (100.0%) | 371 (100.0%) |
Property Value to Household Income Ratio in Livingston
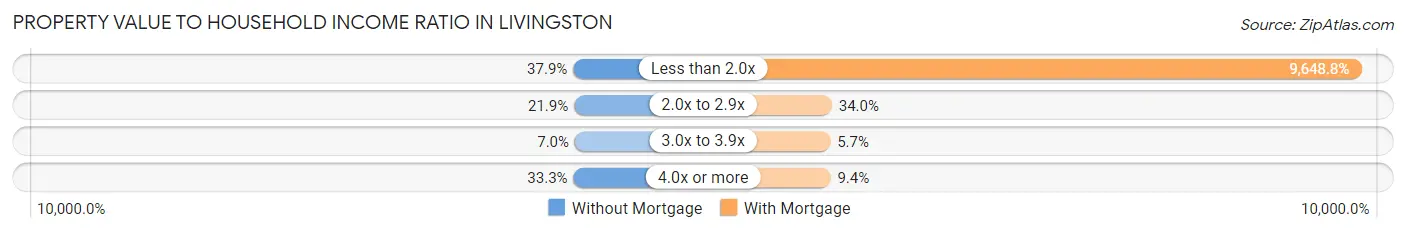
| Value-to-Income Ratio | Without Mortgage | With Mortgage |
| Less than 2.0x | 206 (37.9%) | 35,797 (9,648.8%) |
| 2.0x to 2.9x | 119 (21.9%) | 126 (34.0%) |
| 3.0x to 3.9x | 38 (7.0%) | 21 (5.7%) |
| 4.0x or more | 181 (33.3%) | 35 (9.4%) |
| Total | 544 (100.0%) | 371 (100.0%) |
Real Estate Taxes by Mortgage Status in Livingston
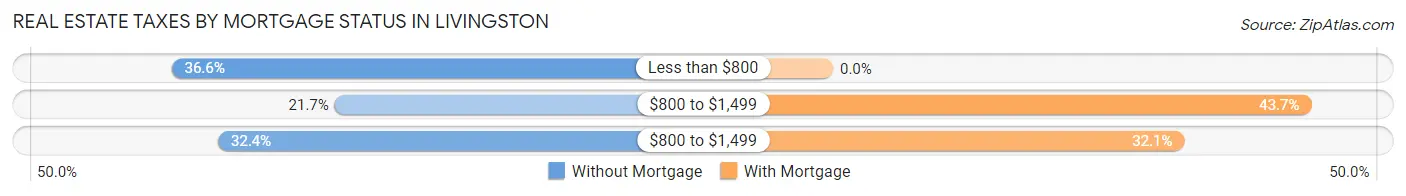
| Property Taxes | Without Mortgage | With Mortgage |
| Less than $800 | 199 (36.6%) | 0 (0.0%) |
| $800 to $1,499 | 118 (21.7%) | 162 (43.7%) |
| $800 to $1,499 | 176 (32.4%) | 119 (32.1%) |
| Total | 544 (100.0%) | 371 (100.0%) |
Health & Disability in Livingston
Health Insurance Coverage by Age in Livingston
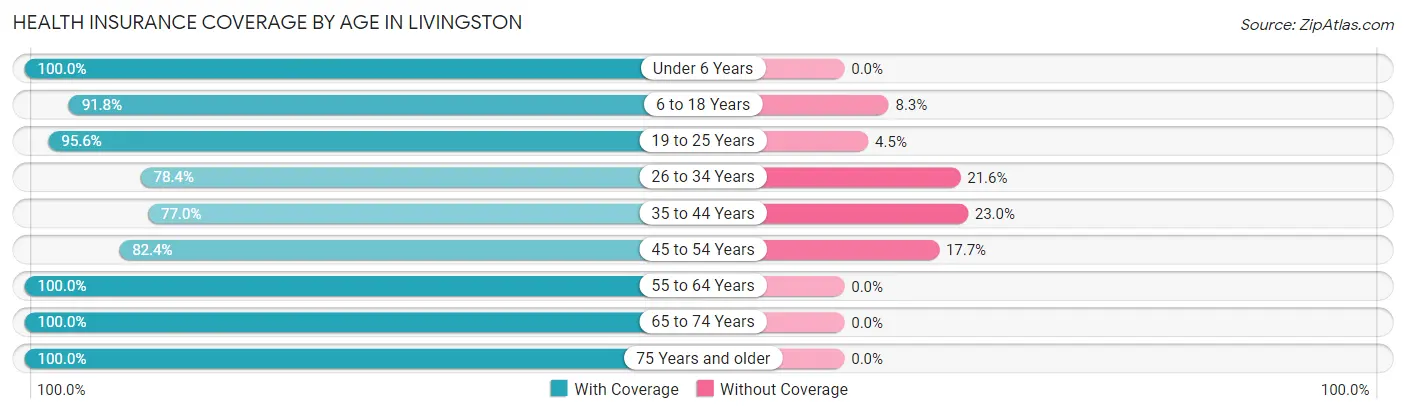
| Age Bracket | With Coverage | Without Coverage |
| Under 6 Years | 218 (100.0%) | 0 (0.0%) |
| 6 to 18 Years | 578 (91.7%) | 52 (8.3%) |
| 19 to 25 Years | 236 (95.6%) | 11 (4.4%) |
| 26 to 34 Years | 442 (78.4%) | 122 (21.6%) |
| 35 to 44 Years | 264 (77.0%) | 79 (23.0%) |
| 45 to 54 Years | 406 (82.4%) | 87 (17.6%) |
| 55 to 64 Years | 600 (100.0%) | 0 (0.0%) |
| 65 to 74 Years | 360 (100.0%) | 0 (0.0%) |
| 75 Years and older | 224 (100.0%) | 0 (0.0%) |
| Total | 3,328 (90.5%) | 351 (9.5%) |
Health Insurance Coverage by Citizenship Status in Livingston
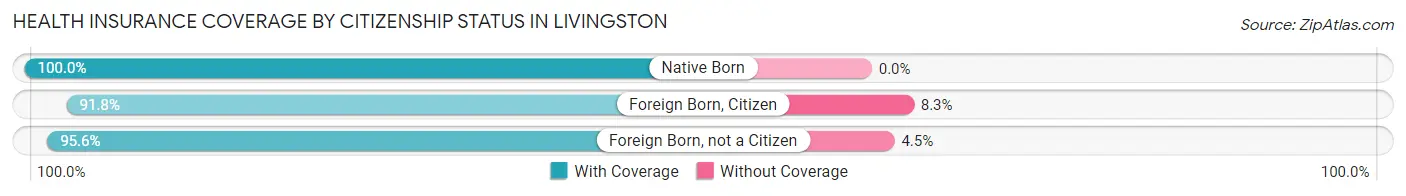
| Citizenship Status | With Coverage | Without Coverage |
| Native Born | 218 (100.0%) | 0 (0.0%) |
| Foreign Born, Citizen | 578 (91.7%) | 52 (8.3%) |
| Foreign Born, not a Citizen | 236 (95.6%) | 11 (4.4%) |
Health Insurance Coverage by Household Income in Livingston
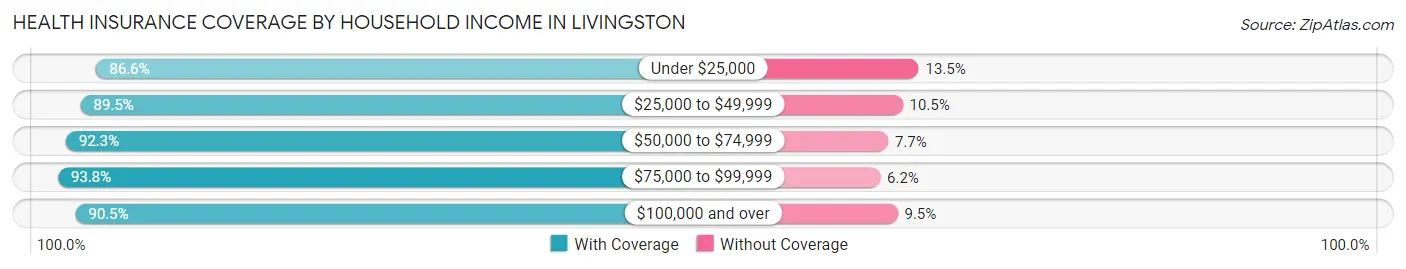
| Household Income | With Coverage | Without Coverage |
| Under $25,000 | 534 (86.6%) | 83 (13.5%) |
| $25,000 to $49,999 | 916 (89.5%) | 107 (10.5%) |
| $50,000 to $74,999 | 454 (92.3%) | 38 (7.7%) |
| $75,000 to $99,999 | 646 (93.8%) | 43 (6.2%) |
| $100,000 and over | 761 (90.5%) | 80 (9.5%) |
Public vs Private Health Insurance Coverage by Age in Livingston
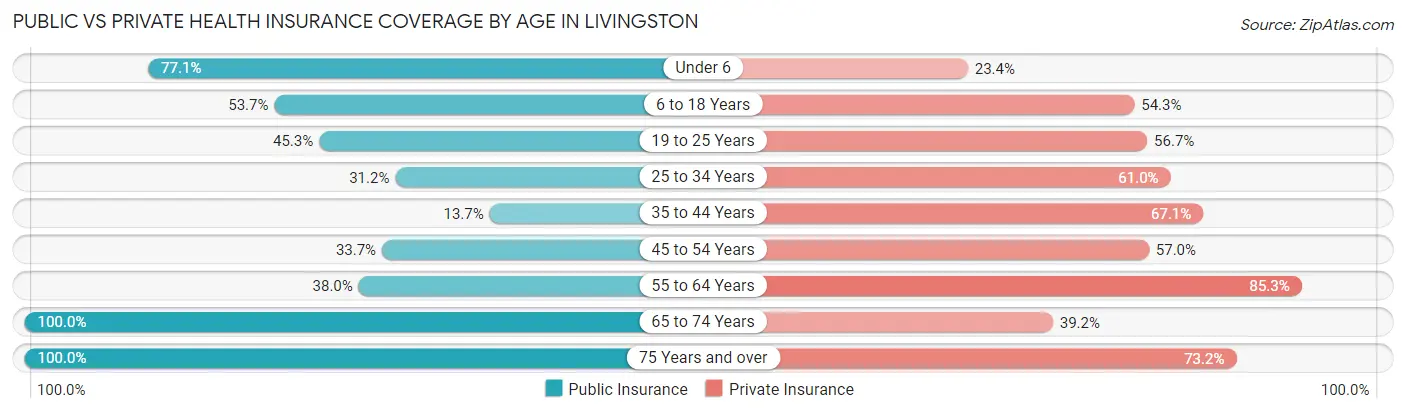
| Age Bracket | Public Insurance | Private Insurance |
| Under 6 | 168 (77.1%) | 51 (23.4%) |
| 6 to 18 Years | 338 (53.6%) | 342 (54.3%) |
| 19 to 25 Years | 112 (45.3%) | 140 (56.7%) |
| 25 to 34 Years | 176 (31.2%) | 344 (61.0%) |
| 35 to 44 Years | 47 (13.7%) | 230 (67.1%) |
| 45 to 54 Years | 166 (33.7%) | 281 (57.0%) |
| 55 to 64 Years | 228 (38.0%) | 512 (85.3%) |
| 65 to 74 Years | 360 (100.0%) | 141 (39.2%) |
| 75 Years and over | 224 (100.0%) | 164 (73.2%) |
| Total | 1,819 (49.4%) | 2,205 (59.9%) |
Disability Status by Sex by Age in Livingston
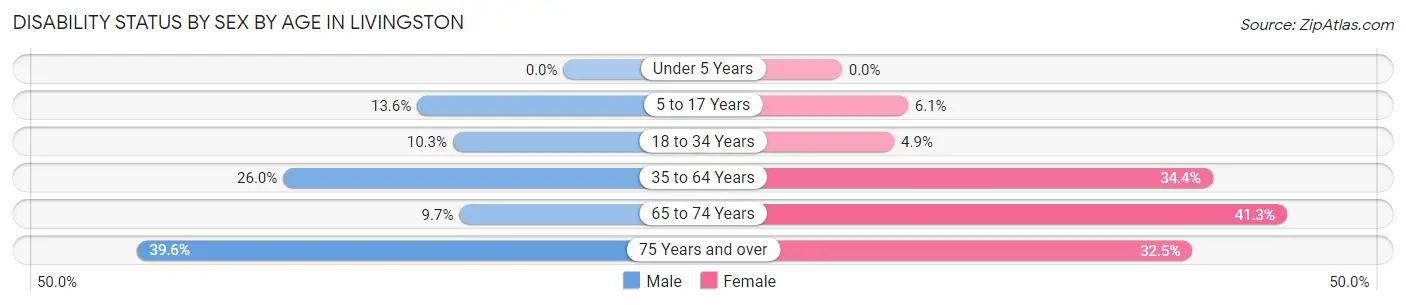
| Age Bracket | Male | Female |
| Under 5 Years | 0 (0.0%) | 0 (0.0%) |
| 5 to 17 Years | 47 (13.6%) | 16 (6.1%) |
| 18 to 34 Years | 40 (10.3%) | 24 (4.9%) |
| 35 to 64 Years | 186 (26.0%) | 248 (34.4%) |
| 65 to 74 Years | 17 (9.7%) | 76 (41.3%) |
| 75 Years and over | 40 (39.6%) | 40 (32.5%) |
Disability Class by Sex by Age in Livingston
Disability Class: Hearing Difficulty
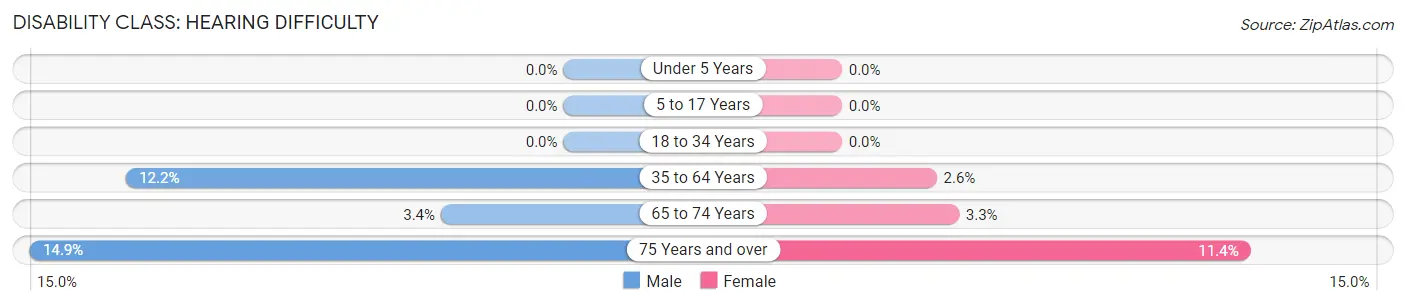
| Age Bracket | Male | Female |
| Under 5 Years | 0 (0.0%) | 0 (0.0%) |
| 5 to 17 Years | 0 (0.0%) | 0 (0.0%) |
| 18 to 34 Years | 0 (0.0%) | 0 (0.0%) |
| 35 to 64 Years | 87 (12.2%) | 19 (2.6%) |
| 65 to 74 Years | 6 (3.4%) | 6 (3.3%) |
| 75 Years and over | 15 (14.8%) | 14 (11.4%) |
Disability Class: Vision Difficulty
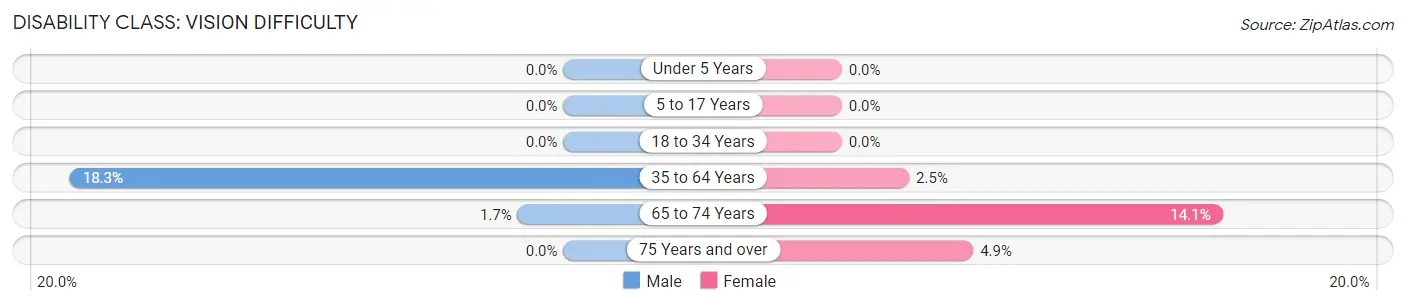
| Age Bracket | Male | Female |
| Under 5 Years | 0 (0.0%) | 0 (0.0%) |
| 5 to 17 Years | 0 (0.0%) | 0 (0.0%) |
| 18 to 34 Years | 0 (0.0%) | 0 (0.0%) |
| 35 to 64 Years | 131 (18.3%) | 18 (2.5%) |
| 65 to 74 Years | 3 (1.7%) | 26 (14.1%) |
| 75 Years and over | 0 (0.0%) | 6 (4.9%) |
Disability Class: Cognitive Difficulty
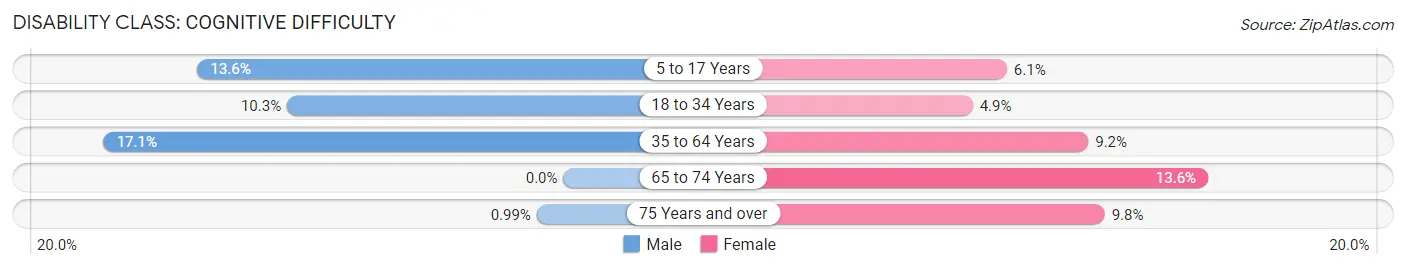
| Age Bracket | Male | Female |
| 5 to 17 Years | 47 (13.6%) | 16 (6.1%) |
| 18 to 34 Years | 40 (10.3%) | 24 (4.9%) |
| 35 to 64 Years | 122 (17.1%) | 66 (9.1%) |
| 65 to 74 Years | 0 (0.0%) | 25 (13.6%) |
| 75 Years and over | 1 (1.0%) | 12 (9.8%) |
Disability Class: Ambulatory Difficulty
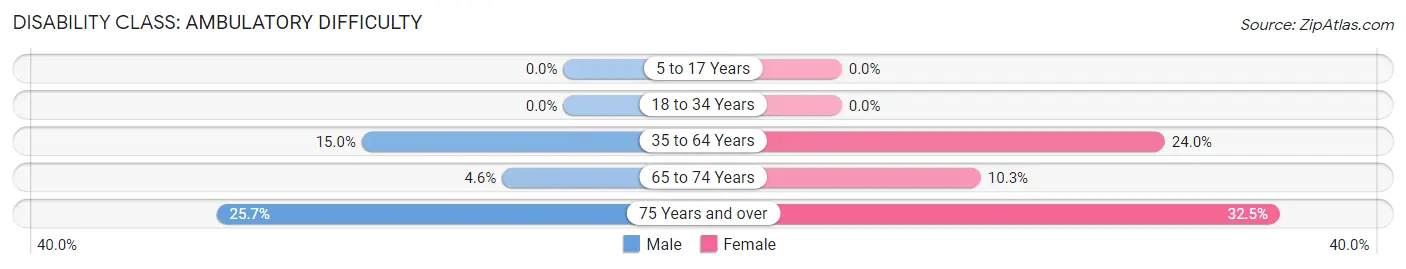
| Age Bracket | Male | Female |
| 5 to 17 Years | 0 (0.0%) | 0 (0.0%) |
| 18 to 34 Years | 0 (0.0%) | 0 (0.0%) |
| 35 to 64 Years | 107 (15.0%) | 173 (24.0%) |
| 65 to 74 Years | 8 (4.5%) | 19 (10.3%) |
| 75 Years and over | 26 (25.7%) | 40 (32.5%) |
Disability Class: Self-Care Difficulty
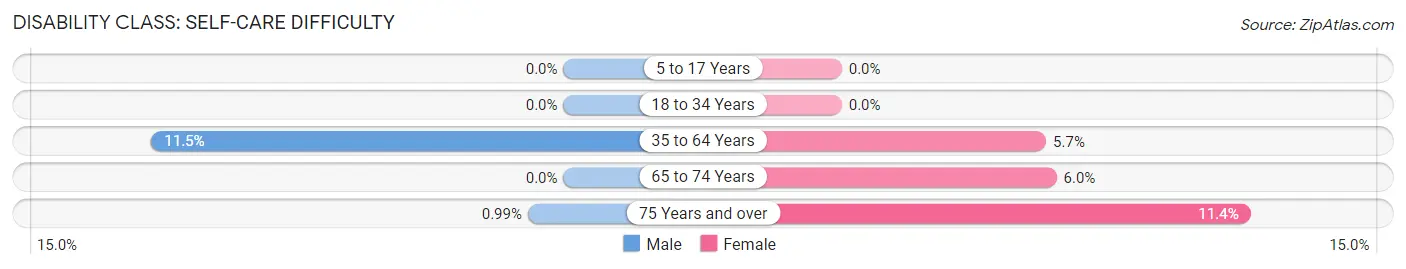
| Age Bracket | Male | Female |
| 5 to 17 Years | 0 (0.0%) | 0 (0.0%) |
| 18 to 34 Years | 0 (0.0%) | 0 (0.0%) |
| 35 to 64 Years | 82 (11.5%) | 41 (5.7%) |
| 65 to 74 Years | 0 (0.0%) | 11 (6.0%) |
| 75 Years and over | 1 (1.0%) | 14 (11.4%) |
Technology Access in Livingston
Computing Device Access in Livingston
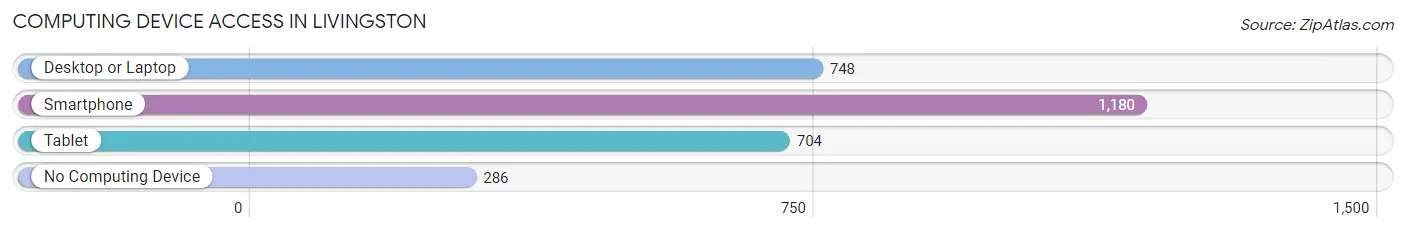
| Device Type | # Households | % Households |
| Desktop or Laptop | 748 | 48.8% |
| Smartphone | 1,180 | 76.9% |
| Tablet | 704 | 45.9% |
| No Computing Device | 286 | 18.6% |
| Total | 1,534 | 100.0% |
Internet Access in Livingston
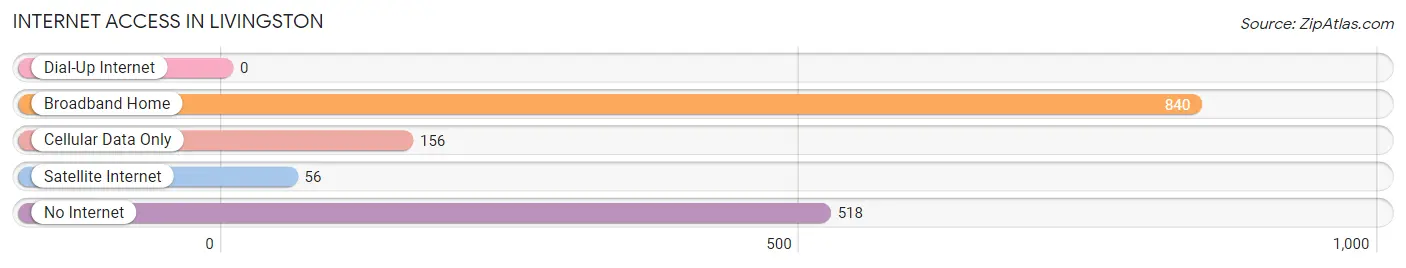
| Internet Type | # Households | % Households |
| Dial-Up Internet | 0 | 0.0% |
| Broadband Home | 840 | 54.8% |
| Cellular Data Only | 156 | 10.2% |
| Satellite Internet | 56 | 3.6% |
| No Internet | 518 | 33.8% |
| Total | 1,534 | 100.0% |
Livingston Summary
Livingston, Tennessee is a small town located in Overton County in the Upper Cumberland region of the state. It is situated in the foothills of the Appalachian Mountains and is the county seat of Overton County. The town has a population of approximately 5,000 people and is located about 90 miles east of Nashville.
History
Livingston was founded in 1806 by William Livingston, a Revolutionary War veteran. He purchased the land from the Cherokee Indians and named the town after himself. The town was incorporated in 1810 and was the first county seat of Overton County. In the early 19th century, Livingston was a thriving agricultural center and was known for its production of tobacco, cotton, and other crops.
In the late 19th century, Livingston began to experience a period of growth and development. The town was connected to the railroad in 1883 and the first bank was established in 1884. The town also became a center for education with the establishment of Livingston Academy in 1885.
Geography
Livingston is located in the Upper Cumberland region of Tennessee. It is situated in the foothills of the Appalachian Mountains and is surrounded by rolling hills and forests. The town is located about 90 miles east of Nashville and is situated along the banks of the Cumberland River.
The climate in Livingston is humid subtropical, with hot summers and mild winters. The average annual temperature is around 60 degrees Fahrenheit. The town receives an average of 48 inches of precipitation per year.
Economy
Livingston’s economy is largely based on agriculture and tourism. The town is home to several farms that produce tobacco, cotton, and other crops. The town is also home to several manufacturing companies, including a furniture factory and a paper mill.
The town is also a popular tourist destination. It is home to several historic sites, including the Livingston Academy, the Overton County Courthouse, and the Livingston Depot. The town also hosts several annual festivals, including the Overton County Fair and the Livingston Heritage Festival.
Demographics
As of the 2010 census, the population of Livingston was 5,099. The racial makeup of the town was 95.3% White, 1.3% African American, 0.3% Native American, 0.3% Asian, 0.1% Pacific Islander, and 2.7% from other races. The median household income was $30,938 and the median family income was $37,917.
Livingston is a small town with a rich history and a vibrant economy. It is a popular tourist destination and is home to several historic sites and annual festivals. The town is also home to several farms and manufacturing companies, making it an important part of the Upper Cumberland region of Tennessee.
Common Questions
What is Per Capita Income in Livingston?
Per Capita income in Livingston is $30,298.
What is the Median Family Income in Livingston?
Median Family Income in Livingston is $56,696.
What is the Median Household income in Livingston?
Median Household Income in Livingston is $37,346.
What is Income or Wage Gap in Livingston?
Income or Wage Gap in Livingston is 31.5%.
Women in Livingston earn 68.5 cents for every dollar earned by a man.
What is Family Income Deficit in Livingston?
Family Income Deficit in Livingston is $6,815.
Families that are below poverty line in Livingston earn $6,815 less on average than the poverty threshold level.
What is Inequality or Gini Index in Livingston?
Inequality or Gini Index in Livingston is 0.58.
What is the Total Population of Livingston?
Total Population of Livingston is 3,921.
What is the Total Male Population of Livingston?
Total Male Population of Livingston is 1,992.
What is the Total Female Population of Livingston?
Total Female Population of Livingston is 1,929.
What is the Ratio of Males per 100 Females in Livingston?
There are 103.27 Males per 100 Females in Livingston.
What is the Ratio of Females per 100 Males in Livingston?
There are 96.84 Females per 100 Males in Livingston.
What is the Median Population Age in Livingston?
Median Population Age in Livingston is 40.6 Years.
What is the Average Family Size in Livingston
Average Family Size in Livingston is 3.2 People.
What is the Average Household Size in Livingston
Average Household Size in Livingston is 2.4 People.
How Large is the Labor Force in Livingston?
There are 1,853 People in the Labor Forcein in Livingston.
What is the Percentage of People in the Labor Force in Livingston?
57.2% of People are in the Labor Force in Livingston.
What is the Unemployment Rate in Livingston?
Unemployment Rate in Livingston is 1.8%.